HAL Id: ird-03044170
https://hal.ird.fr/ird-03044170
Submitted on 7 Dec 2020
HAL is a multi-disciplinary open access
archive for the deposit and dissemination of
sci-entific research documents, whether they are
pub-lished or not. The documents may come from
teaching and research institutions in France or
abroad, or from public or private research centers.
L’archive ouverte pluridisciplinaire HAL, est
destinée au dépôt et à la diffusion de documents
scientifiques de niveau recherche, publiés ou non,
émanant des établissements d’enseignement et de
recherche français ou étrangers, des laboratoires
publics ou privés.
Seventeen new exon-primed intron-crossing polymerase
chain reaction amplifiable introns in fish
M. Hassan, C. Lemaire, C. Fauvelot, F. Bonhomme
To cite this version:
M. Hassan, C. Lemaire, C. Fauvelot, F. Bonhomme. Seventeen new exon-primed intron-crossing
polymerase chain reaction amplifiable introns in fish. Molecular Ecology Notes, Wiley-Blackwell,
2002, �10.1046/j.1471-8286�. �ird-03044170�
Molecular Ecology Notes (2002), 2, 334 –340 doi:10.1046/j.1471-8286 .2002.00236.x
© 2002 Blackwell Science Ltd
Blackwell Science, Ltd
P R I M E R N O T E
Seventeen new exon-primed intron-crossing polymerase
chain reaction amplifiable introns in fish
M . H A S S A N , * C . L E M A I R E , * C . F A U V E L O T * † and F . B O N H O M M E *
*Laboratoire Génome, Populations, Interactions Cnrs Umr 5000, SMEL 1, Quai de la Daurade, 34200 Sète, France; †Ecole Pratique, Des Hautes Etudes, Université de Perpignan, Perpignan, France
Abstract
We used exon-primed, intron-crossing polymerase chain reaction (EPIC-PCR) amplification
to assay variation in nuclear loci in some teleost fishes (Carangidae, Centropomidae,
Chaetodontidae, Clupeidae, Holocentridae, Moronidae, Mullidae, Pomacentridae, Scombridae,
Siganidae). We designed primers in the conserved regions flanking splice sites of consecutive
exons of different genes, allowing the amplification of 17 putative introns. Among the
satisfactory amplified systems, 14 showed length polymorphism with 2–14 alleles.
Keywords:EPIC-PCR, length polymorphism, teleost fishes
Received 27 February 2002; revision received 10 April 2002; accepted 10 April 2002
Introns range in size from ≈ 80 to 10 000 or more nucleotides. Unlike exons, the nucleotide sequence of introns seems to be little constrained; it is often possible to alter most of their sequence without greatly affecting gene function. Introns accumulate mutations rapidly and often display a high genetic variability, including length polymorphism (Palumbi 1995). Exon-primed, intron-crossing polymerase chain reaction (EPIC-PCR) amplification provides a widely applicable strategy for finding DNA polymorphism in eukaryotic genomes. Thus, introns can be targeted as markers of population variation and subdivision (Lessa 1992). They constitute suitable markers for analysing population structure within a species as well as for reconstructing relationships among closely related species (He & Haymer 1997). Intron variation allows high-resolution genetic characterization of invading populations in both natural and managed systems (Villablanca et al. 1998). This method was used to detect and rapidly assess allelic variation at the nucleotide level in mammals (Palumbi & Baker 1994), birds (Heslewood
et al. 1998), insects (Gomulski et al. 1998; He & Haymer 1999), crustaceans (Bierne et al. 2000) and mussels (Côrte-Real
et al. 1994; Daguin et al. 2001).
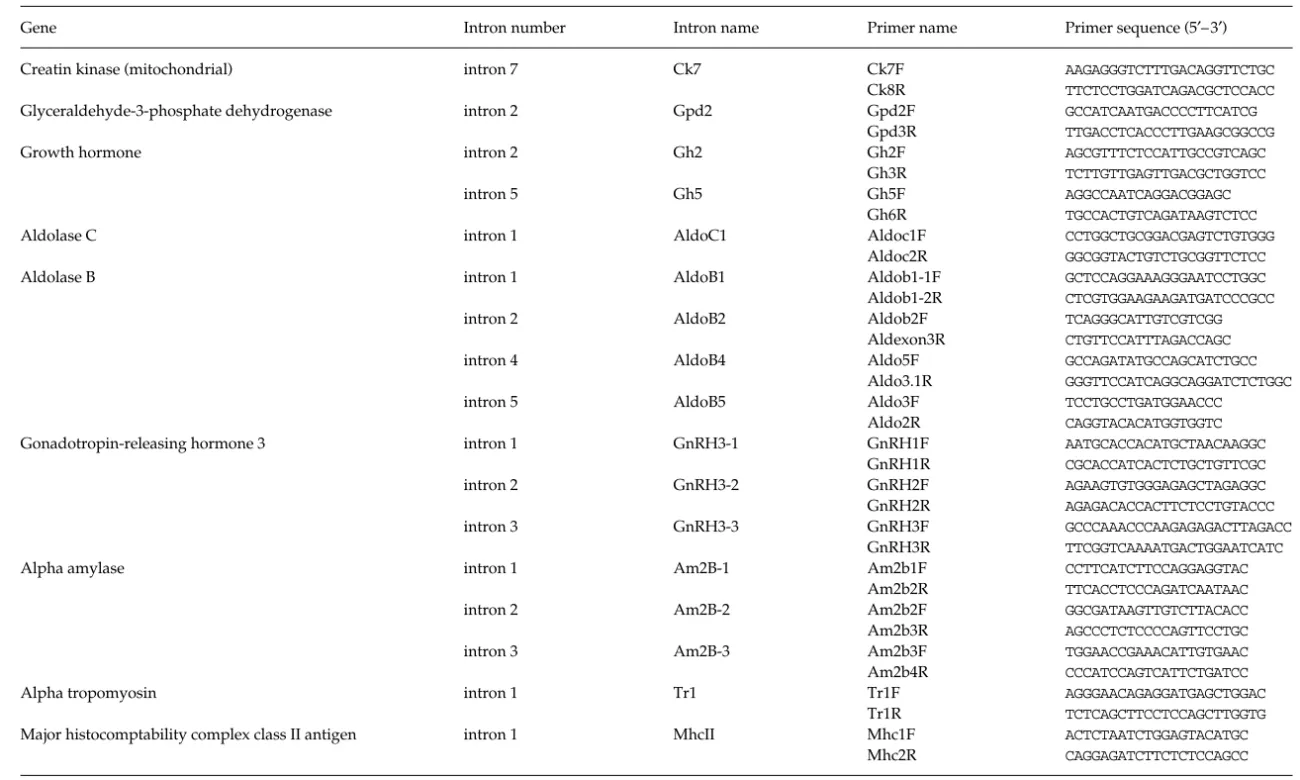
Using the same approach, we designed primers in the conserved regions of consecutive exons of different genes, after a search of exonic sequences published to date (Table 1) in different species of teleost fishes. Each 10 µL PCR contained
0.5 U of Taq DNA polymerase (Promega, Madison WI, USA), 1 µL buffer (Promega), 0.75 mm dNTPs, 1.8 mm MgCl2 and 30–50 ng template DNA. Right before the PCR, primer (Forward) was labelled radioactively with the 33P using 1 U
of polynucleotide-kinase T4 (Eurogenetic, Liège, Belgium, 10 U/µL) in a reaction mixture contained 0.3 µm of the primer and 0.4 mCi/mL of [γ33P] ATP (Amersham Pharmacia
Biotech, UK). This mixture was incubated 30 min at 37 °C. PCR was performed in a Crocodile III Thermocycler (Appligène, Strasbourg, France), using the following cycle profile: one initial denaturation step at 95 °C for 3 min, followed by 35 cycles of amplification [denaturation at 94 °C for 12 s, annealing at (see Table 2) for 12 s and extension at 72 °C for 20 s] and a final extension at 72 °C for 5 min. PCR products were mixed with 5 µL of formamide dye (95% formamide, 20 mm EDTA, 0.05% xylene cyanol and 0.05% bromophenol blue), denaturated at 95 °C for 5 min and 4 µL were loaded on a 6% polyacrylamide gel in TBE buffer. The gels were run for 3 h at 50 W. After drying, the gels were exposed against films of Biomax autoradiograph.
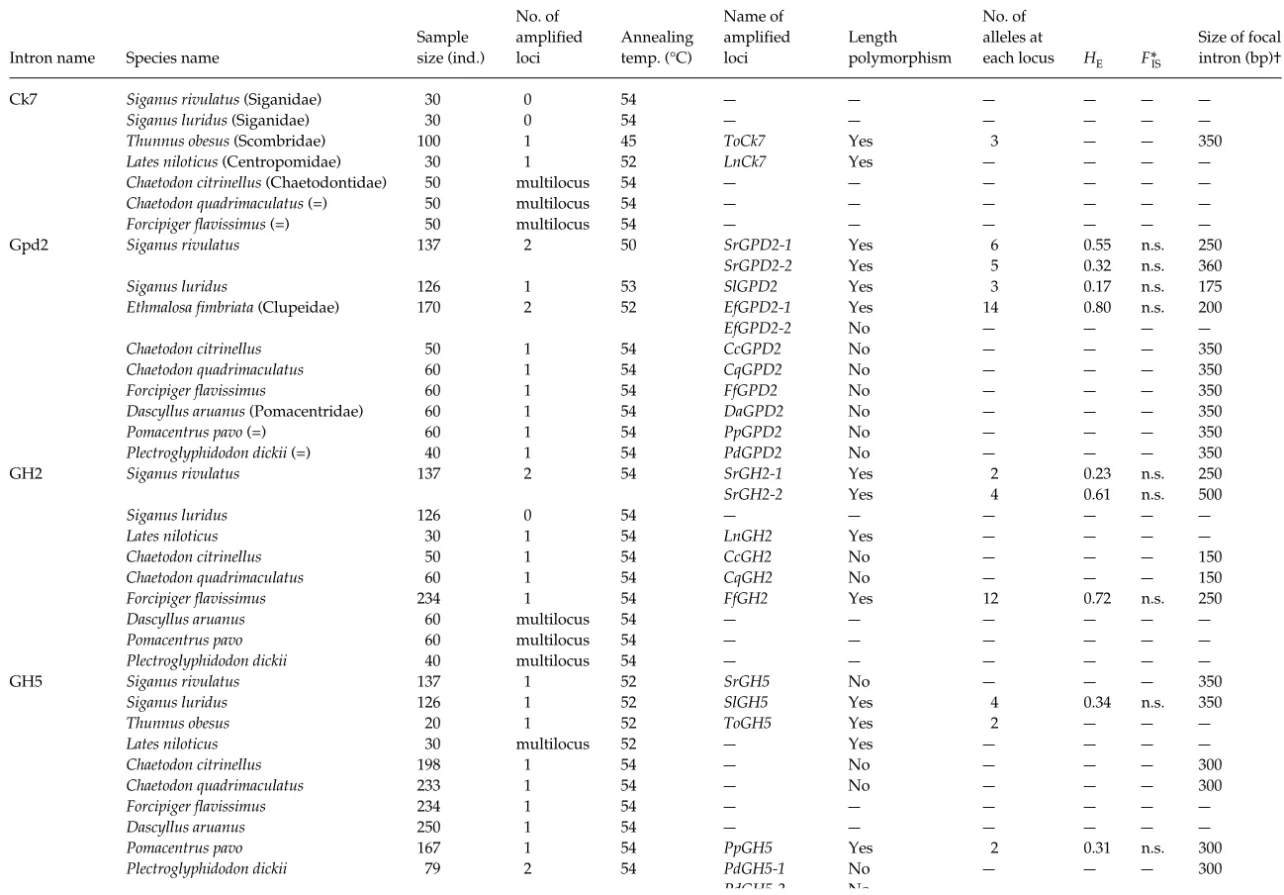
Table 2 presents the principal results of the 17 EPIC-PCR on the tested species. The simultaneous amplification of two or three loci can reveal either the presence of another gene, or of a pseudogene in the species that show these multiple amplifications. It does not seem that these simul-taneous amplifications disturb the quality of PCRs and the reading of the genotypes because: (i) the supplementary profiles do not present parasitic bands, (ii) the variation
Correspondence: M. Hassan. Fax: +33 4 67 46 33 99; E-mail: [email protected]
PRIMER
NOTE
335
© 2002 Blackwell Science Ltd,
Molecular Ecology Notes
, 2, 334
–340
Table 1 Designed primers for introns amplifications
Gene Intron number Intron name Primer name Primer sequence (5′– 3′)
Creatin kinase (mitochondrial) intron 7Ck7 Ck7F AAGAGGGTCTTTGACAGGTTCTGC
Ck8R TTCTCCTGGATCAGACGCTCCACC
Glyceraldehyde-3-phosphate dehydrogenase intron 2 Gpd2 Gpd2F GCCATCAATGACCCCTTCATCG
Gpd3R TTGACCTCACCCTTGAAGCGGCCG
Growth hormone intron 2 Gh2 Gh2F AGCGTTTCTCCATTGCCGTCAGC
Gh3R TCTTGTTGAGTTGACGCTGGTCC
intron 5 Gh5 Gh5F AGGCCAATCAGGACGGAGC
Gh6R TGCCACTGTCAGATAAGTCTCC
Aldolase C intron 1 AldoC1 Aldoc1F CCTGGCTGCGGACGAGTCTGTGGG
Aldoc2R GGCGGTACTGTCTGCGGTTCTCC
Aldolase B intron 1 AldoB1 Aldob1-1F GCTCCAGGAAAGGGAATCCTGGC
Aldob1-2R CTCGTGGAAGAAGATGATCCCGCC
intron 2 AldoB2 Aldob2F TCAGGGCATTGTCGTCGG
Aldexon3R CTGTTCCATTTAGACCAGC
intron 4 AldoB4 Aldo5F GCCAGATATGCCAGCATCTGCC
Aldo3.1R GGGTTCCATCAGGCAGGATCTCTGGC
intron 5 AldoB5 Aldo3F TCCTGCCTGATGGAACCC
Aldo2R CAGGTACACATGGTGGTC
Gonadotropin-releasing hormone 3 intron 1 GnRH3-1 GnRH1F AATGCACCACATGCTAACAAGGC
GnRH1R CGCACCATCACTCTGCTGTTCGC
intron 2 GnRH3-2 GnRH2F AGAAGTGTGGGAGAGCTAGAGGC
GnRH2R AGAGACACCACTTCTCCTGTACCC
intron 3 GnRH3-3 GnRH3F GCCCAAACCCAAGAGAGACTTAGACC
GnRH3R TTCGGTCAAAATGACTGGAATCATC
Alpha amylase intron 1 Am2B-1 Am2b1F CCTTCATCTTCCAGGAGGTAC
Am2b2R TTCACCTCCCAGATCAATAAC
intron 2 Am2B-2 Am2b2F GGCGATAAGTTGTCTTACACC
Am2b3R AGCCCTCTCCCCAGTTCCTGC
intron 3 Am2B-3 Am2b3F TGGAACCGAAACATTGTGAAC
Am2b4R CCCATCCAGTCATTCTGATCC
Alpha tropomyosin intron 1 Tr1 Tr1F AGGGAACAGAGGATGAGCTGGAC
Tr1R TCTCAGCTTCCTCCAGCTTGGTG
Major histocomptability complex class II antigen intron 1 MhcII Mhc1F ACTCTAATCTGGAGTACATGC
Mhc2R CAGGAGATCTTCTCTCCAGCC
336 PRIMER NOTE © 2002 Blackwell Science Ltd, Molecular Ecology Notes , 2, 334 –340
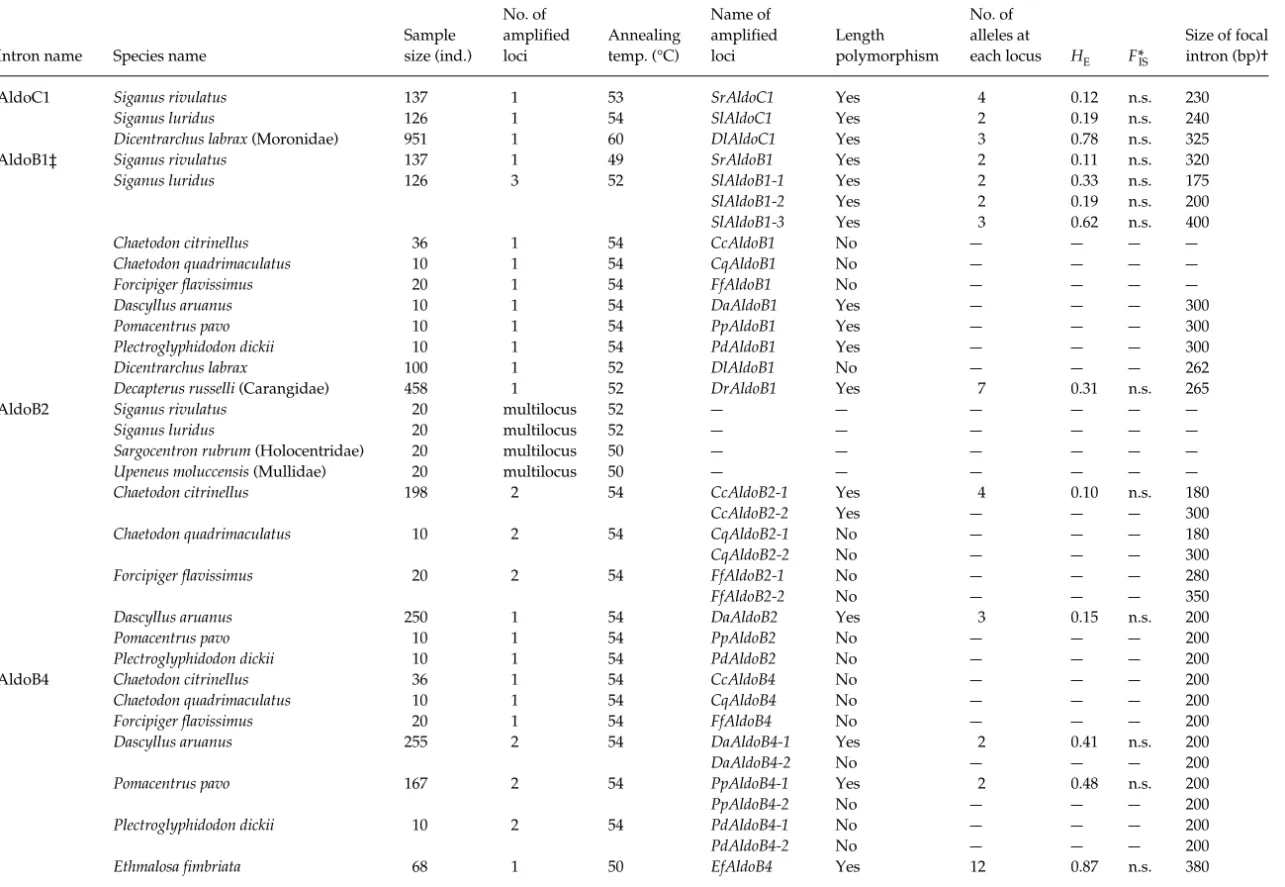
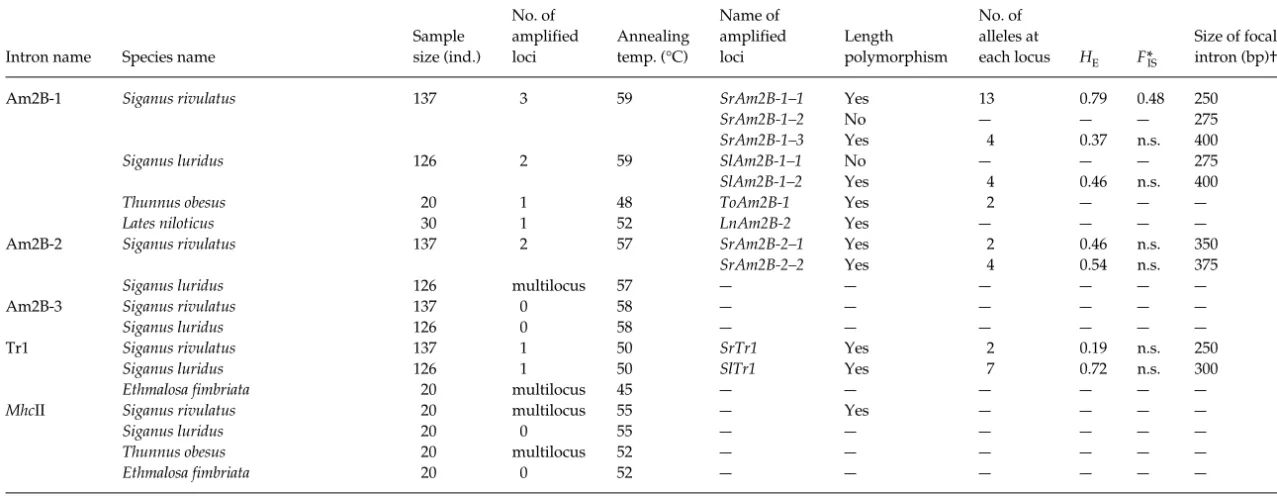
Table 2 Details of general results
Intron name Species name
Sample size (ind.) No. of amplified loci Annealing temp. (°C) Name of amplified loci Length polymorphism No. of alleles at each locus HE F*IS Size of focal intron (bp)†
Ck7 Siganus rivulatus (Siganidae) 30 0 54 — — — — — —
Siganus luridus (Siganidae) 30 0 54 — — — — — —
Thunnus obesus (Scombridae) 100 1 45 ToCk7 Yes 3 — — 350
Lates niloticus (Centropomidae) 30 1 52 LnCk7 Yes — — — —
Chaetodon citrinellus (Chaetodontidae) 50 multilocus 54 — — — — — —
Chaetodon quadrimaculatus (=) 50 multilocus 54 — — — — — —
Forcipiger flavissimus (=) 50 multilocus 54 — — — — — —
Gpd2 Siganus rivulatus 1372 50 SrGPD2-1 Yes 6 0.55 n.s. 250
SrGPD2-2 Yes 5 0.32 n.s. 360
Siganus luridus 126 1 53 SlGPD2 Yes 3 0.17n.s. 175
Ethmalosa fimbriata (Clupeidae) 170 2 52 EfGPD2-1 Yes 14 0.80 n.s. 200
EfGPD2-2 No — — — —
Chaetodon citrinellus 50 1 54 CcGPD2 No — — — 350
Chaetodon quadrimaculatus 60 1 54 CqGPD2 No — — — 350
Forcipiger flavissimus 60 1 54 FfGPD2 No — — — 350
Dascyllus aruanus (Pomacentridae) 60 1 54 DaGPD2 No — — — 350
Pomacentrus pavo (=) 60 1 54 PpGPD2 No — — — 350
Plectroglyphidodon dickii (=) 40 1 54 PdGPD2 No — — — 350
GH2 Siganus rivulatus 1372 54 SrGH2-1 Yes 2 0.23 n.s. 250
SrGH2-2 Yes 4 0.61 n.s. 500
Siganus luridus 126 0 54 — — — — — —
Lates niloticus 30 1 54 LnGH2 Yes — — — —
Chaetodon citrinellus 50 1 54 CcGH2 No — — — 150
Chaetodon quadrimaculatus 60 1 54 CqGH2 No — — — 150
Forcipiger flavissimus 234 1 54 FfGH2 Yes 12 0.72 n.s. 250
Dascyllus aruanus 60 multilocus 54 — — — — — —
Pomacentrus pavo 60 multilocus 54 — — — — — —
Plectroglyphidodon dickii 40 multilocus 54 — — — — — —
GH5 Siganus rivulatus 1371 52 SrGH5 No — — — 350
Siganus luridus 126 1 52 SlGH5 Yes 4 0.34 n.s. 350
Thunnus obesus 20 1 52 ToGH5 Yes 2 — — —
Lates niloticus 30 multilocus 52 — Yes — — — —
Chaetodon citrinellus 198 1 54 — No — — — 300
Chaetodon quadrimaculatus 233 1 54 — No — — — 300
Forcipiger flavissimus 234 1 54 — — — — — —
Dascyllus aruanus 250 1 54 — — — — — —
Pomacentrus pavo 1671 54 PpGH5 Yes 2 0.31 n.s. 300
Plectroglyphidodon dickii 79 2 54 PdGH5-1 No — — — 300
PdGH5-2 No — — — —
*FIS = (HE−HO)/HE.
†Approximate size.
PRIMER
NOTE
337
© 2002 Blackwell Science Ltd,
Molecular Ecology Notes
, 2, 334
–340
AldoC1 Siganus rivulatus 1371 53 SrAldoC1 Yes 4 0.12 n.s. 230
Siganus luridus 126 1 54 SlAldoC1 Yes 2 0.19 n.s. 240
Dicentrarchus labrax (Moronidae) 951 1 60 DlAldoC1 Yes 3 0.78 n.s. 325
AldoB1‡ Siganus rivulatus 1371 49 SrAldoB1 Yes 2 0.11 n.s. 320
Siganus luridus 126 3 52 SlAldoB1-1 Yes 2 0.33 n.s. 175
SlAldoB1-2 Yes 2 0.19 n.s. 200
SlAldoB1-3 Yes 3 0.62 n.s. 400
Chaetodon citrinellus 36 1 54 CcAldoB1 No — — — —
Chaetodon quadrimaculatus 10 1 54 CqAldoB1 No — — — —
Forcipiger flavissimus 20 1 54 FfAldoB1 No — — — —
Dascyllus aruanus 10 1 54 DaAldoB1 Yes — — — 300
Pomacentrus pavo 10 1 54 PpAldoB1 Yes — — — 300
Plectroglyphidodon dickii 10 1 54 PdAldoB1 Yes — — — 300
Dicentrarchus labrax 100 1 52 DlAldoB1 No — — — 262
Decapterus russelli (Carangidae) 458 1 52 DrAldoB1 Yes 70.31 n.s. 265
AldoB2 Siganus rivulatus 20 multilocus 52 — — — — — —
Siganus luridus 20 multilocus 52 — — — — — —
Sargocentron rubrum (Holocentridae) 20 multilocus 50 — — — — — —
Upeneus moluccensis (Mullidae) 20 multilocus 50 — — — — — —
Chaetodon citrinellus 198 2 54 CcAldoB2-1 Yes 4 0.10 n.s. 180
CcAldoB2-2 Yes — — — 300
Chaetodon quadrimaculatus 10 2 54 CqAldoB2-1 No — — — 180
CqAldoB2-2 No — — — 300
Forcipiger flavissimus 20 2 54 FfAldoB2-1 No — — — 280
FfAldoB2-2 No — — — 350
Dascyllus aruanus 250 1 54 DaAldoB2 Yes 3 0.15 n.s. 200
Pomacentrus pavo 10 1 54 PpAldoB2 No — — — 200
Plectroglyphidodon dickii 10 1 54 PdAldoB2 No — — — 200
AldoB4 Chaetodon citrinellus 36 1 54 CcAldoB4 No — — — 200
Chaetodon quadrimaculatus 10 1 54 CqAldoB4 No — — — 200
Forcipiger flavissimus 20 1 54 FfAldoB4 No — — — 200
Dascyllus aruanus 255 2 54 DaAldoB4-1 Yes 2 0.41 n.s. 200
DaAldoB4-2 No — — — 200
Pomacentrus pavo 1672 54 PpAldoB4-1 Yes 2 0.48 n.s. 200
PpAldoB4-2 No — — — 200
Plectroglyphidodon dickii 10 2 54 PdAldoB4-1 No — — — 200
PdAldoB4-2 No — — — 200
Ethmalosa fimbriata 68 1 50 EfAldoB4 Yes 12 0.87n.s. 380
Intron name Species name
Sample size (ind.) No. of amplified loci Annealing temp. (°C) Name of amplified loci Length polymorphism No. of alleles at each locus HE F*IS Size of focal intron (bp)† *FIS = (HE− HO)/HE. †Approximate size.
‡Additionally, this intron was proven to amplify correctly in 23 other teleost species and one chondrichthyes species; (–) incomplete data; n.s. = insignificant value.
Table 2 Continued
338 PRIMER NOTE © 2002 Blackwell Science Ltd, Molecular Ecology Notes , 2, 334 –340
AldoB5 Siganus rivulatus 20 0 5 8 — — — — — —
Siganus luridus 20 0 5 8 — — — — — —
Sargocentron rubrum 20 0 5 8 — — — — — —
Upeneus moluccensis 20 0 5 8 — — — — — —
Chaetodon citrinellus 36 1 54 CcAldoB5 No — — — 200
Chaetodon quadrimaculatus 10 1 54 CqAldoB5 No — — — 200
Forcipiger flavissimus 20 1 54 FfAldoB5 No — — — 200
GnRH3-1 Siganus rivulatus 136 2 48 SrGnRH3-1–1 Yes 2 0.41 n.s. 250
SrGnRH3-1–2 Yes 9 0.77 n.s. 400
Siganus luridus 126 3 48 SlGnRH3-1–1 Yes 50.53 n.s. 275
SlGnRH3-1–2 Yes 4 0.15n.s. 325
SlGnRH3-1–3 Yes 8 0.74 n.s. 375
Chaetodon citrinellus 198 1 54 CcGnRH3-1 Yes 8 0.67 0.43 280
Chaetodon quadrimaculatus 233 1 54 CqGnRH3-1 Yes 6 0.61 n.s. 280
Forcipiger flavissimus 5 0 1 5 4 FfGnRH3-1 No — — — 280
Dascyllus aruanus 20 1 54 DaGnRH3-1 No — — — 25 0
Pomacentrus pavo 20 1 54 PpGnRH3-1 No — — — 25 0
Plectroglyphidodon dickii 20 0 5 4 — — — — — —
GnRH3-2 Siganus rivulatus 137 1 56 SrGnRH3-2 No — — — 230
Siganus luridus 126 1 56 SlGnRH3-2 No — — — 230
Decapterus russelli 458 1 52 DrGnRH3-2 Yes 7 0.71 n.s. 300
Chaetodon citrinellus 198 1 54 CcGnRH3-2 Yes 4 0.52 0.21 280
Chaetodon quadrimaculatus 233 1 54 CqGnRH3-2 Yes 4 0.53 n.s. 280
Forcipiger flavissimus 234 1 54 FfGnRH3-2 Yes 7 0.36 n.s. 300
Dascyllus aruanus 20 1 54 DaGnRH3-2 No — — — 300
Pomacentrus pavo 20 1 54 PpGnRH3-2 No — — — 300
Plectroglyphidodon dickii 79 1 50 PdGnRH3-2 Yes 13 0.69 n.s. 300
GnRH3-3 Siganus rivulatus 137 1 52 SrGnRH3-3 Yes 4 0.40 n.s. 325
Siganus luridus 126 1 53 SlGnRH3-3 Yes 4 0.48 n.s. 375
Thunnus obesus 20 1 52 ToGnRH3-3 No — — — —
Chaetodon citrinellus 5 0 1 5 4 CcGnRH3-3 No — — — 400
Chaetodon quadrimaculatus 550 1 54 CqGnRH3-3 No — — — 400
Forcipiger flavissimus 5 0 1 5 4 FfGnRH3-3 No — — — 400
Dascyllus aruanus 20 1 54 DaGnRH3-3 Yes — — — 400
Pomacentrus pavo 20 1 54 PpGnRH3-3 No — — — 400
Plectroglyphidodon dickii 20 1 54 PdGnRH3-3 No — — — 400
Intron name Species name
Sample size (ind.) No. of amplified loci Annealing temp. (°C) Name of amplified loci Length polymorphism No. of alleles at each locus HE F*IS Size of focal intron (bp)† *FIS = (HE−HO)/HE. †Approximate size.
‡Additionally, this intron was proven to amplify correctly in 23 other teleost species and one chondrichthyes species; (–) incomplete data; n.s. = insignificant value.
Table 2 Continued
PRIMER
NOTE
339
© 2002 Blackwell Science Ltd,
Molecular Ecology Notes
, 2, 334
–340
Am2B-1 Siganus rivulatus 1373 59 SrAm2B-1–1 Yes 13 0.79 0.48 250
SrAm2B-1–2 No — — — 27 5
SrAm2B-1–3 Yes 4 0.37n.s. 400
Siganus luridus 126 2 59 SlAm2B-1–1 No — — — 27 5
SlAm2B-1–2 Yes 4 0.46 n.s. 400
Thunnus obesus 20 1 48 ToAm2B-1 Yes 2 — — —
Lates niloticus 30 1 52 LnAm2B-2 Yes — — — —
Am2B-2 Siganus rivulatus 1372 57 SrAm2B-2–1 Yes 2 0.46 n.s. 350
SrAm2B-2–2 Yes 4 0.54 n.s. 375
Siganus luridus 126 multilocus 57— — — — — —
Am2B-3 Siganus rivulatus 1370 58 — — — — — —
Siganus luridus 126 0 58 — — — — — —
Tr1 Siganus rivulatus 1371 50 SrTr1 Yes 2 0.19 n.s. 250
Siganus luridus 126 1 50 SlTr1 Yes 70.72 n.s. 300
Ethmalosa fimbriata 20 multilocus 45 — — — — — —
MhcII Siganus rivulatus 20 multilocus 55 — Yes — — — —
Siganus luridus 20 0 55 — — — — — —
Thunnus obesus 20 multilocus 52 — — — — — —
Ethmalosa fimbriata 20 0 52 — — — — — —
Intron name Species name
Sample size (ind.) No. of amplified loci Annealing temp. (°C) Name of amplified loci Length polymorphism No. of alleles at each locus HE F*IS Size of focal intron (bp)† *FIS = (HE− HO)/HE. †Approximate size.
‡Additionally, this intron was proven to amplify correctly in 23 other teleost species and one chondrichthyes species; (–) incomplete data; n.s. = insignificant value.
Table 2 Continued
340 P R I M E R N O T E
© 2002 Blackwell Science Ltd, Molecular Ecology Notes, 2, 334 –340
of size between band systems was larger than the size polymorphism of each locus and, finally, (iii) we did not find significant departure from Hardy – Weinberg equilibrium in those samples in which we could analyse a sufficient number of individuals to test it properly.
Acknowledgements
We are grateful to N. Bierne, J.D. Durand, A. Rohfritsch, and J.F. Agnèse for their help.
References
Bierne N, Lehnert SA, Bédier E, Bonhomme F, Moore SS (2000) Screening for intron-length polymorphisms in penaeid shrimps using exon-primed intron-crossing (EPIC)-PCR. Molecular
Ecology, 9, 233 – 235.
Côrte-Real HBSM, Dixon DR, Holland PWH (1994) Intron-targeted PCR: a new approach to survey neutral DNA polymorphism in bivalve populations. Marine Biology, 120, 407– 413.
Daguin C, Bonhomme F, Borsa P (2001) The zone of sympatry and hybridization of Mytilus edulis and M. galloprovincialis, as described by intron length polymorphism at locus mac-1. Heredity, 86, 342 – 354.
Gomulski LM, Bourtzis K, Brogna S et al. (1998) Intron size polymorphism of the Adh sub (1) gene parallels the worldwide colonization history of the Mediterranean fruit fly, Ceratitis
capitata. Molecular Ecololgy, 7, 1729 –1741.
He M, Haymer DS (1997) Polymorphic intron sequences detected within and between populations of the Oriental fruit fly (Diptera: Tephritidae). Annals of the Entomological Society of America, 90, 825 – 831.
He M, Haymer DS (1999) Genetic relationships of populations and the origins of new infestations of the Mediterranean fruit fly.
Molecular Ecology, 8, 1247–1257.
Heslewood MM, Elphinstone MS, Tidemann SC, Baverstock PR (1998) Myoglobin intron variation in the Gouldian finch
Eryth-rura gouldiae assessed by temperature gradient gel
electrophore-sis. Electrophoresis, 19, 142 –151.
Lessa EP (1992) Rapid surveying of DNA sequence variation in natural populations. Molecular Biology and Evolution, 9, 323 – 330. Palumbi SR (1995) Nucleic acids II: the polymerase chain reaction. In: Molecular Systematics, 2nd edn (ed. Hillis D, Moritz C), pp. 205 – 247. Sinauer, Sunderland, MA.
Palumbi SR, Baker CS (1994) Contrasting population structure from nuclear intron sequences and mtDNA of humpback whales.
Molecular Biology and Evolution, 11, 426 – 435.
Villablanca FX, Roderick GK, Palumbi SR (1998) Invasion genetics of the Mediterranean fruit fly: variation in multiple nuclear introns.