HAL Id: cirad-00179846
http://hal.cirad.fr/cirad-00179846
Submitted on 16 Oct 2007HAL is a multi-disciplinary open access archive for the deposit and dissemination of sci-entific research documents, whether they are pub-lished or not. The documents may come from teaching and research institutions in France or abroad, or from public or private research centers.
L’archive ouverte pluridisciplinaire HAL, est destinée au dépôt et à la diffusion de documents scientifiques de niveau recherche, publiés ou non, émanant des établissements d’enseignement et de recherche français ou étrangers, des laboratoires publics ou privés.
To cite this version:
Marcel Kuper, Zaigham Habib. Containing salinity through irrigation management: the case of the Fordwah area in Pakistan. Atelier du PCSI (Programme Commun Systèmes Irrigués) sur une Maîtrise des Impacts Environnementaux de l’Irrigation, 2002, Montpellier, France. 17 p. �cirad-00179846�
Serge Marlet et Pierre Ruelle (éditeurs scientifiques), 2002. Vers une maîtrise des impacts environnementaux de l’irrigation. Actes de l’atelier du PCSI, 28-29 mai 2002, Montpellier, France. CEMAGREF, CIRAD, IRD, Cédérom du CIRAD.
C
ontaining salinity through irrigation management:
the case of the Fordwah area in Pakistan
Marcel Kuper*, Zaigham Habib**
* CIRAD-TERA, UMR Sagert, 73 rue J.F. Breton, 34398 Montpellier, kuper@cirad.fr ** Shirkat Gah, 58 Canal Burg, Lahore, Pakistan, zaihabib@yahoo.com
Résumé
Gestion de la salinité par l’irrigation : le cas de la zone de Fordwah au Pakistan. La salinité des sols a toujours été une contrainte de l’agriculture irriguée dans le bassin de l’Indus. Traditionnellement, ce phénomène était associé à la remontée d’une nappe, devenue sub-affleurante à certains endroits, avec l’introduction des périmètres irrigués à grande échelle. Le concept de la « menace jumelle » de l’engorgement et de la salinité des sols a impulsé depuis les années 1960 un grand nombre de projets de drainage à grande échelle pour rabattre la nappe. Par ailleurs, pour faire face aux pénuries d’eau, les agriculteurs ont recouru à des pompages individuels dans la nappe dont le niveau a ainsi baissé. Le nombre de forages est estimé à plus de 500 000 et continue d’augmenter. L’utilisation des eaux souterraines, souvent d’une qualité médiocre mais hétérogène dans l’espace, accentue une tendance à la salinisation des sols. L’eau de surface, en revanche, est d’excellente qualité et représente une valeur inestimable pour les paysans ayant des problèmes de salinité et sodicité. Une distribution de l’eau de surface en phase avec les contraintes des paysans en termes de qualité de l’eau de nappe pourrait contribuer à diminuer ces problèmes.
Abstract
Managing salinity through irrigation management : the case of the Fordwah area in Pakistan. Soil salinity has always been a constraint to irrigated agriculture in the Indus river basin. Traditionally, this phenomenon was linked with a rise in the groundwater tables with the introduction of large-scale irrigation in the second half of the 19th century. The concept of the twin menace of “waterlogging and salinity” has prompted the implementation of a large number of drainage projects in order to control groundwater tables. At the same time, farmers have installed since the 1980s a large number of tubewells – an estimated 500.000, presently -, which have contributed to lowering the groundwater table. The use of groundwater for irrigation, often of doubtful quality but heterogeneous in space, increases the risks of soil salinization. The surface water, on the other hand, is of excellent quality, representing an inestimable resource to the farmers faced with problems of salinity and sodicity. A surface water distribution in line with the physical constraints of farmers could contribute to addressing these problems.
contributing about 40% of the total irrigation supplies (Indian Irrigation Commission, 1903). Lieftinck et al. (1968) considered that about 200,000 wells were still operational in the 1960s, estimating the groundwater use in the Indus Basin canal commands at 11.9 billion m3, amounting to 15 % of the total irrigation supplies.
In the past 35 years extensive development of Pakistan’s groundwater resources has taken place through the installation of 16.000 public tubewells. These tubewells were meant to lower the groundwater tables, but also provided additional water supplies for irrigation. At the same time, farmers have installed a large number of shallow tubewells, having a capacity of about 30 ls-1. Presently, 500,000 tubewells provide 30-40 % of the irrigation water at the farm gate (Nespak/Sgi, 1991). Studies in the 1990s showed that almost all farmers have now access to groundwater either through ownership or through water markets (Strosser and Kuper, 1994). The conjunctive use of surface and groundwater for irrigation is, therefore, a reality for the majority of the farmers in the Indus Basin, especially in the Punjab, allowing them a greater flexibility and better access to irrigation water.
Traditionally, salinity has been associated with irrigated agriculture in the Indus Basin (Framji et al., 1984, Ahmed and Chaudry, 1988). Salinity was considered linked with waterlogging, related to the introduction of large-scale perennial irrigation in the Indus Basin. However, the Soil Survey of Pakistan showed in the 1970s that there were more causes of salinity. Genetic salinity, due to weathering of parent material, was thought to affect some 4.8 million ha of land (Choudry, 1979). A second source of salinization was the rise in groundwater tables in the doabs (land between two rivers), displacing salts and bringing them into the root zone through capillary rise. Finally, the Soil Survey of Pakistan warned about the threat of salinization through the use of poor quality groundwater by tubewells. The often doubtful quality of groundwater was known for much longer (Council of the Bahawalpur State, 1900), but has become an important issue due to the massive deployment of tube wells in the Indus Basin.
Soil salinity: status and measures taken
Measures in Pakistan to control salinity have focused on controlling the groundwater table. This included the prevention of seepage through canal lining (from 1895 onwards), surface and interceptor drains (from 1930 onwards), irrigation management (canal closures) and vertical drainage through tubewells from 1940 onwards (Ahmed and Chaudry, 1988). The Directorate for Land Reclamation, Punjab, conducts an annual salinity survey since 1943 (Muhammed, 1978). On this basis, it advises the irrigation agency on the installation of
reclamation shoots (pipe outlets installed for 3 months during the flood season), thus
providing extra water to those areas affected by salinity. In recent years, due to the tremendous pressure on canal water, very few reclamation shoots have been sanctioned. The Water and Power Development Authority (WAPDA), created in 1958, was entrusted with the responsibility of tackling waterlogging and salinity in the Indus Basin, through large-scale vertical and horizontal drainage schemes, referred to as Salinity Control And Reclamation Projects (SCARP). These had a dual aim of lowering groundwater tables by installing public tubewells and increasing agricultural production, making additional irrigation supplies available at the farm gate. 32 SCARP projects of a total cost of 1.2 billion dollars were implemented covering 3.8 million ha, resulting in the installation of about 13,000 public tubewells, 5000 km of surface drains and 2000 km of sub-surface drains (Ghassemi et al., 1995). In addition, the Left Bank Outfall Drain in Lower Sindh drains an area of 600,000 ha with a main drain of 270 km and 2000 public tubewells. Public tubewells were later transferred to farmers due to excessive operation and maintenance costs. In most cases, farmers preferred installing small private tubewells, further encouraged by government subsidies.
In the seventies, researchers recognized the existence of sodic soils, evidenced in the WAPDA surveys, and realized the adverse effects of (bi)carbonates and sodium in irrigation water hailing from the aquifer. Recommendations were made regarding safe limits of irrigation water, gypsum application, and salinity-tolerant crops (Ahmad and Majeed, 1975;
Bakhsh and Hussain, 1975; Muhammed, 1975). Their recommendations went largely unheeded in the large scale development projects in the country, which continued to focus on the prevention of seepage through the lining of about 20,000 thousand watercourses and the implementation of large-scale drainage projects based on the waterlogging and salinity
paradigm (Muhammed, 1978). This signaled the inception of a dispute between researchers
who understood the complexity of the salinity issue and engineers who had to come up with practical solutions for a problem affecting millions of hectares.
Several surveys have been undertaken in the Indus Basin to qualify the extent of soil salinity and the impact of government interventions, including the 1953-54 WASID survey and the WAPDA survey of 1977-79. Ahmad and Chaudhry (1988) show that the overall salinity status has improved over these years. While in 1963 only 53% of the irrigated area was salt free, about 67% of the area was free of salts in 1978. The 1977-79 survey showed that 4,2 million ha were affected by salinity. It further showed the importance of sodicity, present in more than 25% of the samples (n = 63866).
The decreasing trend in soil salinity, which can be partly attributed to the lowering of the groundwater tables due to the large-scale interventions of the government and the groundwater exploitation of farmers, has also been favoured by the increased availability of irrigation water. Groundwater resources indeed provided an additional 50 billion m3 of irrigation water. At the same time, the surface water diversions increased from 75 billion m3 in the 1950s to a maximum of about 135 billion m3 with the extension of the irrigation schemes (Kotri, Taunsa, Guddu) and the achievement of Mangla and Tarbela dams (6.58 and 11.59 billion m3 storage respectively) in 1965 and 1978. Farmers were thus able to reclaim large tracts of land in their conjunctive use environment.
Interestingly, farmers have been very diverse in their measures, bringing large areas - hitherto fore affected by salinity - under cultivation. These range from the application of good quality water and taking various biotic, mechanical and chemical reclamation measures. Farmers are also unremittingly mitigating the effects of high groundwater tables and poor quality irrigation water on soils and crop yields, by adapting the quantity, frequency and ratio of application of surface and tubewell water, the crop choice and the application of chemical amendments (Kielen, 1996; Kuper, 1997).
This paper investigates the impact of farmers’ measures on soil salinity and determines the physical constraints they are confronted with in order to formulate recommendations on government interventions aimed at reducing the impact of soil salinity on agricultural production.
Methods and materials
Study area
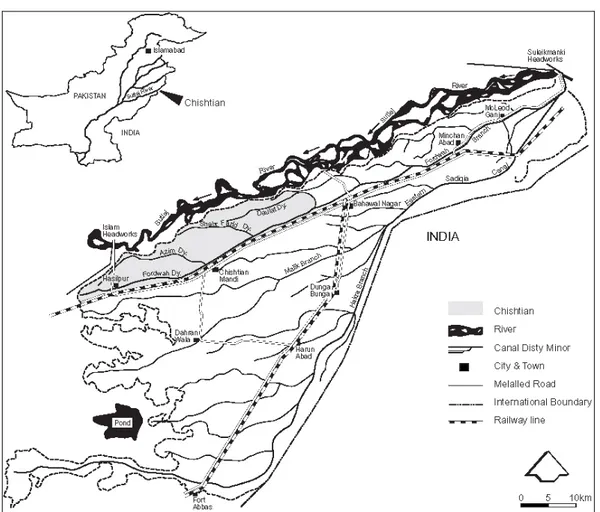
The research was carried out in the Chishtian sub-division, a 75.000 ha hydraulic unit of the Fordwah canal command offtaking from Suleimanke Headworks on Sutlej river in Pakistan’s Punjab (Figure 1).
Figure 1. Map of the Chishtian sub-division, Punjab, Pakistan
Chishtian is fed by the Fordwah Branch (primary canal), serving 14 distributaries (secondary canals) who in turn distribute water to a total of 503 watercourses (tertiary units). The area receives about 0.51 billion m3 of surface water annually. In addition, a total number of 4450 tubewells (according to a 1996 census), corresponding to a density of 6.4 tubewells per 100 ha, represent a total pumping capacity more than three times the maximum discharge of the surface water irrigation system. The cropping pattern in the area is mainly based on a cotton (summer) - wheat (winter) rotation and annual cropping intensities reach 150%. The crop yields are below the national average with an average wheat yield of almost 1.9 t ha-1 (2.3 at the national level). The area operated by farmers is on average 6.4 ha, but varies considerably. The climate is semi-arid continental with annual potential evaporation (class A pan) at 2400 mm far exceeding the annual rainfall of 200 mm.
Research methodology
A water and salt balance was elaborated for 8 watercourses of Fordwah and Azim distributaries, two major secondary canals in the Chishtian sub-division. The equations used are classical and documented for the study area by van Waijjen (1996). For these watercourses, irrigation application data were collected weekly and soil and water samples (n=600) seasonally. Interviews with farmers (n=278) allowed to determine the farm characteristics for all landholdings in these watercourses.
To determine the effect of irrigation on soil salinity, a one-dimensional soil water flow-solute transport model, SWAP93 was used (Feddes et al., 1988; van Dam and Feddes, 1996). The model simulates water, solute and heat transport in the air-plant-soil environment. It includes hysteresis, the possibility of simulating preferential flow and adsorption and decomposition processes as described by Boesten and van der Linden (1991). The model calculates the soil water flow with Richards’ equation, based on Darcy’s law and the principle of mass
conservation. To solve the equation, the soil hydraulic functions are described by the van Genuchten-Mualam parameters (van Genuchten, 1987; Wösten and van Genuchten, 1988). The root water uptake is described semi-empirically by a sink term as a function of the maximum root water uptake, the soil water pressure head and the salt concentration (Feddes et al., 1988; Prasad, 1988). The transport of conservative solutes is described with the convection-dispersion equation. Saline soil moisture conditions reduce the root water uptake due to an increased osmotic head of the soil water. The osmotic head is added to the matrix head, and the total head is used to derive the reduction factor for root water uptake. The model reduces crop transpiration due to water and salinity stress only, while all other factors (e.g. nutrient availability) are considered optimal.
Groundwater use and salinity in the Chishtian sub-division
Following earlier studies of the Soil Survey of Pakistan (e.g. Choudhry, 1979), Kijne and VanderVelde (1992) demonstrated the impact of the application of poor quality groundwater through tubewells on soil salinity and sodicity in the Mananwala distributary command area in central Punjab. In subsequent publications they referred to this phenomenon as the process of “secondary salinization” as opposed to a primary salinization caused by the capillary rise of salts in the rootzone in the presence of shallow groundwater tables. They found an increasing trend of soils salinity and sodicity towards the tail of the Mananwala distributary, which they attributed to a decreasing availability of canal water from head to tail, as well as a deteriorating groundwater quality, impacting on the quality of available irrigation water. A redistribution of (good quality) canal water, bringing it there where it is most needed, i.e. to those areas suffering from poor quality groundwater, would then be a means of sustaining agricultural production with poor quality groundwater (Kijne and VanderVelde, 1992).
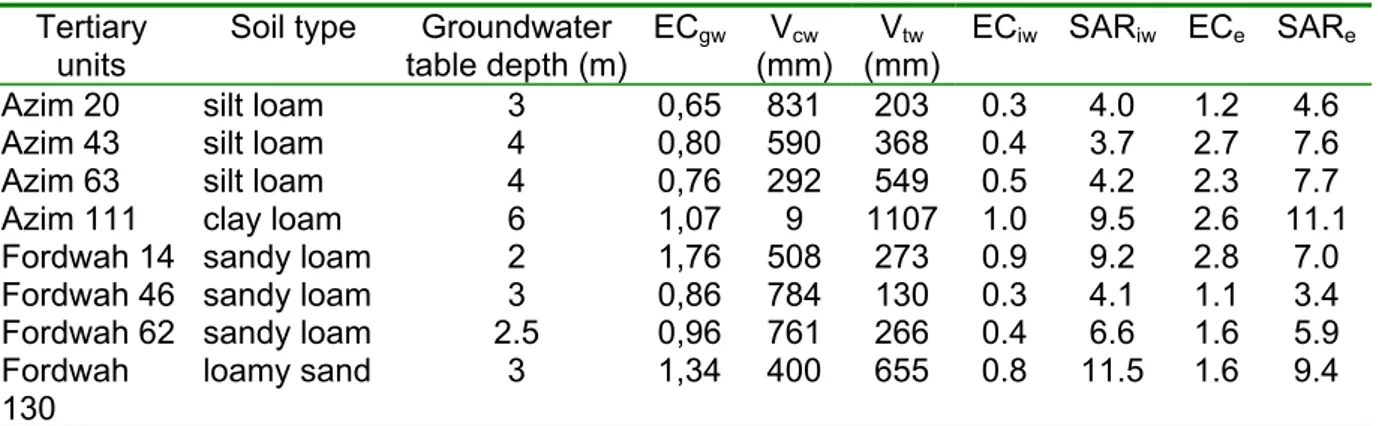
In further studies the impact of irrigation with poor quality groundwater on soil salinity and sodicity in the Indus Basin was confirmed (Van Waijjen, 1996; Smets et al., 1997; Condom et al., 1999). It was further shown that the physical environment inducing problems of salinity and sodicity is very diffuse and complex. Along an irrigation canal soil types, depth to groundwater tables and groundwater quality are generally quite heterogeneous, impacting on the soil salinity and sodicity status of these units. This is shown for eight tertiary units of the Fordwah and Azim distributaries in Table 1.
The table shows indeed a contrasting physical environment, linked to the geological formation of the alluvial plains of the Sutlej and Hakra rivers (Soil Survey of Pakistan, 1998), where especially farmers in Fordwah 14 are faced with adverse conditions combining a poor groundwater quality with a groundwater table close to the surface. The proximity of the groundwater table seems a determinant factor in explaining the adverse salinity and sodicity conditions in Fordwah 14 and 62. The physical conditions are more favourable for the Azim tertiary units. However, the surface water availability for these units is much inferior to that of the Fordwah units, which explains the high groundwater use in the Azim units and thus the relatively poor irrigation water quality (ECiw, SARiw). The irrigation water quality is here
Table I. Physical environment, irrigation practices and their impact on soil salinity and sodicity for eight watercourses of the Fordwah and Azim distributaries (Kuper, 1997)
Tertiary units
Soil type Groundwater table depth (m) ECgw Vcw (mm) Vtw (mm) ECiw SARiw ECe SARe
Azim 20 silt loam 3 0,65 831 203 0.3 4.0 1.2 4.6
Azim 43 silt loam 4 0,80 590 368 0.4 3.7 2.7 7.6
Azim 63 silt loam 4 0,76 292 549 0.5 4.2 2.3 7.7
Azim 111 clay loam 6 1,07 9 1107 1.0 9.5 2.6 11.1
Fordwah 14 sandy loam 2 1,76 508 273 0.9 9.2 2.8 7.0
Fordwah 46 sandy loam 3 0,86 784 130 0.3 4.1 1.1 3.4
Fordwah 62 sandy loam 2.5 0,96 761 266 0.4 6.6 1.6 5.9 Fordwah
130
loamy sand 3 1,34 400 655 0.8 11.5 1.6 9.4
The electrical conductivity is presented in dS m-1, the Sodium Adsorption Ratio in (mmol l-1)0.5. The number after the name of the distributary indicates the distance to the head of the canal in thousand feet. The time-related data cover a one-year period from May 1994 to April 1995.
On the basis of these data, a salt and water balance at the level of the watercourse was established by van Waijjen (1996), showing the relative water stress imposed by farmers on their crops with a ratio ETa/ETpot of less than 0.9 and an average leaching fraction of a little
over 0.1. This leaching fraction is sufficient to keep the average predicted salinity levels below 4 dS m –1, except in Fordwah 14 due to its physical constraints (poor groundwater quality, superficial groundwater table) and Azim 63 due to under-irrigation. Interestingly, the capillary rise in Fordwah 14 has a positive impact on the soil salinity. With capillary rise the soil is more wet, resulting in a higher leaching fraction. The salts removed from the rootzone through percolation exceed the salt inflow through capillary rise.
The importance of the availability of good quality surface water for the salinity status of irrigated lands was also demonstrated in other canal commands in the Punjab (Kijne and VanderVelde, 1992; Kuper and Van Waijjen, 1993). The surface water availability is very heterogeneous between the different canal commands. The water allocation to different canal commands at the watercourse head varies from 500 to more than 2000 mm for different canal commands. In addition, the surface water availability along irrigation canals is not always uniform (Bhutta and VanderVelde, 1992; Kuper and Van Waijjen, 1993; Tareen et al., 1996). In addition, certain watercourses are privileged, usually through an increased size of the outlet (breadth, width), irrespective of their location along the canal. In other words, in addition to a considerable heterogeneity in physical constraints (groundwater quality, depth to groundwater table, soils), there is also a great diversity in the access to surface water, which explains the wide variety of situations to which farmers are confronted.
Farmers’ salinity management
"Owners are reluctant to give up cultivation until the process of deterioration makes
germination of seed impossible" (Mehta, 1940).
There is a need to understand and analyse the salinity management of farmers. Firstly, the diverse physical constraints farmers face need to be understood. Only then, appropriate interventions can be formulated, which effectively help farmers to cope with the adverse effects of irrigation. Secondly, the experiences farmers have in coping with salinity and sodicity can be beneficial for devising interventions. Finally, there is a large range in farmers' socio-economic background, determining whether farmers can or want to take advantage of the opportunities that are offered. This latter aspect is not developed in this paper.
Farmers use a vernacular terminology to define salinity phenomena (Table 2). The classification is based on visual characteristics, such as the white efflorescence on soil surfaces or the dark film caused by a dispersion of organic matter, the physical degradation (reduced intake rate, surface crust or hard layers), and the effects on crop growth (germination problems). The Central Board of Irrigation (1941) investigated this vernacular
classification. White salinity or kallar was found to be associated with sodium and magnesium chlorides, while black kallar was found in the presence of sodium carbonates. Farmers in the study area distinguish mainly between white or chitta kallar and black or kala kallar. A surface crust is mainly associated with white salinity, while black salinity is often accompanied by hard layers at the surface or in the profile (zacht). Kallar shor, mentioned in the 1941 classification as "impregnated with salts", is a soil difficult to cultivate due to poor physical properties.
Table II. Vernacular soil salinity classification (Central Board of Irrigation, 1941; Kielen, 1996)
Classes Characteristics
Chitta White (chitta) efflorescence, surface crust
Kala kallar Black (kala) appearance with hard upper soil layer Zacht Hard layers in the profile
Kallar shor White salts at the surface, extremely difficult to cultivate
When relating farmers' observations to the results of soil samples, it appeared that farmers observe chitta kallar at ECe levels of 2.4 dS m-1 and higher, while zacht happens at SAR
levels as low as 6 (Kielen, 1996), which corresponds to an ESP of only 7 when using the relationship developed by the USDA (Richards, 1954). The values that are thus obtained, are much lower than the criteria defined in the same publication, where an ECe of 4 dS m-1 and
an ESP of 15 are assumed to distinguish between non-saline and saline, and non-sodic and sodic soils. This is an important observation, as these criteria are often used in Pakistan as a reference.
Farmers recognize the different origins of salinity and/or sodicity status, relating them to the
presence of high groundwater tables, to genetic salinity and to the use of poor quality irrigation water. Farmers appreciate the potential contribution of high groundwater tables to
salinity and sodicity, even though the groundwater can provide considerable amounts of water to the crop. Genetic salinity covered substantial parts of the Chishtian Sub-division, but farmers have reclaimed large tracts using canal water. Some of these soils, e.g. the dense sodic soils, have physical properties, which make them difficult to cultivate, and pose lasting limitations to farmers (Soil Survey of Pakistan, 1998).
Figure 2. Farmers' perceptions of the irrigation water quality (good, marginal and poor) in comparison with the FAO classification (Ayers and Westcot, 1985). The farmers' perceptions of the water quality are obtained from Kielen (1996)
The use of poor quality irrigation water, pumped by tube wells, in areas away from the river is a relatively recent phenomenon, from 1985 onwards. Farmers differentiate the impact of various tube well waters on soil and plants conditions. The importance of the quality of irrigation water can be appreciated from the farmers' classification of irrigation water. Generally, irrigation water is evaluated for its effect on soils and crops: the water of a certain tube well causes zacht or a hard layer in the profile. The classification is not entirely in line with the FAO classification of Ayers and Westcot (1985), who emphasize the risk of reduced infiltration rates with waters of low salt concentration and a relatively high amount of sodium, see Figure 2. The greatest disagreement relates perhaps to canal water with an EC of 0.19 and an SAR of 0.2, which poses according to the FAO classification a moderate sodicity hazard but is judged to be of excellent quality by farmers. According to farmers, tube well water with an SAR greater than 5 and an EC greater than 1.0 causes hard layers in the soil. Farmers experience the adverse effects of poor quality irrigation water rapidly. After 2-3 irrigations with such water, a surface crust develops, while hard layers in the soil can occur within an irrigation season. Their views were confirmed by Condom et al. (1999), who used a geo-chemical model in conjunction with a solute transfer model and provided evidence for a rapid sodification of soils. From Figure 2 it appears that the logic of the FAO classification does not correspond with farmers perceptions. The FAO emphasizes the physical logic. When a soil is irrigated with water having a low concentration in salts, the Diffuse Double Layer tends to increase in size, degrading the soil structure and reducing the hydraulic conductivity. This increase is favoured by the presence of the mono valent cation Na+ as opposed to the divalent cations Ca2+ and Mg2+, i.e. high values of SAR.
Farmers have a long term perspective. Irrigation waters with high salt concentrations are more likely to cause soil salinity and sodicity, especially when dominated by sodium bi-carbonates. This was confirmed in a modelling exercise where the ESP of a soil was determined while concentrating the soil water (Condom et al., 1999). An ESP of 15 was attained with a 5-fold concentration of irrigation water with an EC of 1.4 dS m-1, while a 10-fold concentration was required to obtain an ESP of 15 for an irrigation water with a lower EC (0.8 dS m-1), but with a similar chemical composition.
Simulating the impact of irrigation application on soil salinity
The soil water flow – solute transport model SWAP93 was calibrated and validated for four fields of 0.4 ha each, cultivated by farmers with a cotton-wheat rotation, and representing the dominant soil types in the area, i.e. a loamy sand (LS), a sandy loam (SL), a loam (L) to silty clay loam (SiCL), and a loam to silt loam (SiL). The calibration and validation of the model was documented by Smets et al. (1997).
Simulating the effect of the irrigation application on the water and salt balance The long term effect of different quantities and qualities of irrigation on salinity and Tact was
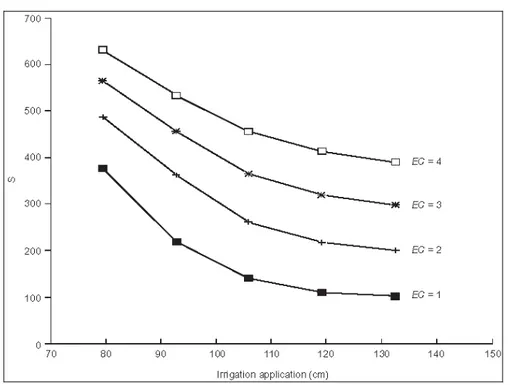
assessed for one of the four fields, a sandy loam. A total of 16 irrigations were provided during a single year for a cotton and wheat crop. The groundwater table was assumed to be sufficiently deep in order to have free drainage. The water and solute transfer was simulated for a soil profile of 2 m. Since small quantities of water were applied in some of the scenarios, which influences the rapidity with which an equilibrium is reached, a total simulation period of 10 years was adopted. The results at the end of this period were compared. This is at the end of the cotton season, just before the pre-sowing irrigation for wheat. The simulation results are shown in Figures 3 and 4 for the relative transpiration and
S, respectively. The total yearly irrigation application of the different scenarios were as
follows: 133, 120, 107, 93, 80 cm. The irrigation water quality was 1, 2, 3, 4 dS m-1 respectively.
Figure 3 shows the direct relationship between the irrigation quantity and the amount of water that can be extracted by plants. This relationship is curvi-linear with a tangent that decreases with the amount of water that is applied. A reduction in irrigation quantity leads also directly to a reduction in the leaching fraction. When irrigating with an EC of 4 dS m-1, for example, the leaching fraction decreases from 0.22 to 0.09 when comparing the highest with the lowest irrigation quantity. This leads to increases in S with decreasing irrigation amounts, as shown in Figure 4.
Figure 3. Simulation results of the effect of irrigation quantity and quality on the relative transpiration Tact/Tpot, of cotton and wheat for a sandy loam (after Smets et al.,
1997)
Figure 4. Simulation results of the effect of irrigation quantity and quality on the salts in the soil profile (in mg cm-2) for a sandy loam (after Smets et al., 1997)
Increases in the EC of the irrigation water lead to slightly higher leaching fractions, due to the fact that in dry conditions the plants are more restricted in their water uptake when the soil water is saline. This positive effect attenuates to a certain extent the extra input of salts when irrigating with more saline water, although it cannot prevent the increase in S for irrigation waters with higher concentrations. The relative transpiration is adversely affected by the increase of concentration of the irrigation water.
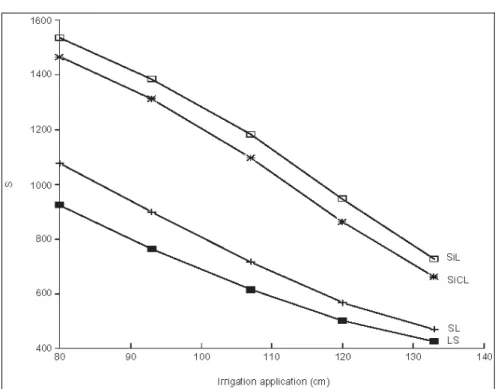
Simulating the effect of the groundwater table on the water and salt balance In a limited part of the area groundwater tables are within 2-3 m of the soil surface. In the section on calibration/validation, it was already shown that this affects soil salinity. Long term simulations were carried out to assess the effect of a groundwater table at 2 m of the soil surface on the water and salt balance for four soil types, i.e. loamy sand, sandy loam, loam to silty clay loam and silt loam. The EC of the irrigation water is 3 dS m-1. The results are presented in Figure 5 for the soil salinity.
Figure 5. Simulation results of the effect of the irrigation quantity on the soil salinity S, in the presence of a groundwater table at 2 m depth for a loamy sand (LS), sandy loam (SL), loam to silty clay loam (SiCL) and a silt loam (SiL). The EC of the irrigation water is 3 dS m-1
The effect of the groundwater table is very pronounced. When comparing with Figure 4, the salinity has in some cases more than doubled. This is related to the capillary rise that occurs, especially in the first 2-3 years of the simulations. The cumulative leaching fraction is very low in this period. At the same time, the soil profile is wetter due to the presence of the groundwater table, resulting in lower salt concentrations, and thus a smaller amount of salts that is leached. Soon, a relatively high salinity level is reached. Due to the fact that the plants are constrained in their root water uptake, the leaching fraction increases. At the end of the simulation period, the leaching fraction is only slightly smaller than in the case of free drainage. However, the salinity levels remain relatively high. In case of small irrigation quantities, the effect of the groundwater table is more important as is evidenced by the
The effect of farmers' irrigation practices on soil salinity and transpiration
Farmers were shown in an earlier section to dispose of a large array of measures to deal with salinity. In this section, the effect of some of these measures in the present physical environment will be evaluated. This will enable an assessment of how much of the salinity problem can be overcome by farmers themselves, and how the effectiveness of their measures compare with the proposed interventions. Two measures are investigated, i.e. the frequency of irrigation and the quality of the pre-sowing irrigation water, since farmers have expressed to use both techniques in order to mitigate the effect of irrigation water quality on crop production. The existing irrigation regime consists generally of a large pre-sowing application, in one or two applications, and a number of subsequent irrigations. In the study area, the number of applications for wheat is generally recommended to be 1 pre-sowing irrigation and 4-6 subsequent applications, while for cotton these are usually 2 and 6-8, respectively. Farmers generally prefer to apply good quality canal water (0.2 dS m-1) for the pre-sowing irrigations. The reference scenario will follow the recommended practices. The first alternative scenario consists of applying the same amount of water in a higher number of applications, see Table 3. The second alternative scenario follows the frequency of the reference scenario, but the pre-sowing irrigations are done with poor quality water, i.e. an EC of 1.5 dS m-1.
Both alternative scenarios will be compared with the irrigation management intervention, i.e. a reduction of 40% in the quantity of water that is available. Also, a comparison will be made with a scenario showing a physical constraint in the form of the presence of a shallow groundwater table.
An analysis of the evolution of salinity and Tact will be carried out inside the crop seasons,
because the interventions of farmers occur punctually during the season. The irrigation regime of the reference scenario was derived from the recommendations of the Agricultural Department in the study area and consist of 6 irrigations for wheat and 10 for cotton, including the pre-sowing irrigations. The total application is 132 cm. The initial soil moisture content is 15.7 cm for the profile, while the initial value of S is 153.2 mg cm-2. The simulations are carried out for a three year period with cultivation of cotton and wheat under the same irrigation practices. The results of the third year are then analyzed.
Table III. Definition of scenarios to evaluate the intra-seasonal effect of irrigation practices and a shallow groundwater table on soil salinity and transpiration
Scenarios Soil type Irrigation
application (cm) Number of irrigations Bottom boundary condition
Reference SiL 132 16 Free drainage
High frequency SiL 132 20 Free drainage
Pre-sowing irrigation with poor quality water
SiL 132 16 Free drainage
Under-irrigation SiL 80 16 Free drainage
Groundwater table SiL 132 16 Groundwater table at 2 m
The first results show that the leaching fractions for the high frequency irrigation and for the poor quality pre-sowing irrigation are very similar to that of the reference scenario (Kuper, 1997). This is certainly not the case for the other two scenarios. In case of a presence of a superficial groundwater table, the leaching fraction increases considerable with values between 0.2 and 0.6. The under-irrigation scenario decreases the leaching fraction, as expected, with values below 0.05. The effect of these scenarios on the relative transpiration is limited for most of the scenarios. Only in case of under-irrigation there is a reduction by about 10% of the fraction Ta/Tpot.
The simulation results show a high leaching fraction in the period January-March for most of the scenarios. Interesting is that the leaching fraction for the under-irrigation scenario is almost zero in that same period, resulting in a substantial salinization. Finally, the effect of a groundwater table at 2 m is shown to impact greatly on the leaching fraction. However, the concentration of the water that is leached is much lower than for other scenarios due to the wetter profile. Thus, only in case of under-irrigation there is a considerable impact on Tact.
This applies both to cotton and wheat. In the case of wheat, the fact that the pre-sowing irrigation in December as well as the first subsequent irrigation are 40% lower than in the reference scenario is shown to especially affect adversely Tact.
The effect of the different irrigation practices on the salt accumulation for the same soil (silt loam) is presented in Figure 6. Generally, the salinity tends to be lower in Kharif than in Rabi. This is due to the fact that in the period January to March before the beginning of Kharif over-irrigation takes place. The temperatures are not so high yet resulting in low values of ETpot,
which makes leaching possible. In Kharif farmers have difficulty to even keep the profile moist and leaching reduces to a minimum. Thus, salinity gradually increases and is at its peak at the onset of Rabi.
Figure 6 shows that applying the same amount of irrigation water in a higher frequency does not affect much the salinity as compared to the reference scenario, a finding which was also established for irrigation with a lower frequency, i.e. 12 irrigations yearly, for the same soil (Smets et al., 1997). This may well be related to the soil type. Smets et al. (1997) found for a loamy sand that the frequency of irrigation is very important due to its lower soil moisture retention. Moisture stress more easily occurs in this case when the irrigations are too far apart. More impact has the decrease in water quality for the pre-sowing irrigations for wheat and cotton, resulting in a higher soil salinity. The impact of the pre-sowing irrigations, one in December and two in May/June can be detected in Figure 6.
Figure 6. Simulation results of the impact of irrigation practices on soil salinity S for a silt loam
An interesting observation was made by Smets et al. (1997), who showed that in case of over-irrigation soil salinity may actually decrease in the presence of a shallow groundwater table. This was attributed to a higher leaching fraction, induced by a higher soil moisture content. However, in case of under-irrigation, a shallow groundwater table clearly increases
S in the soil profile as shown in Figure 6.
The under-irrigation scenario is shown to affect salinity very much. It is also the only scenario where after 3 years of irrigation, still no equilibrium is attained. The most important impact of a reduction of irrigation quantity is that farmers are no longer able to reduce salinity in the period January-March. The remainder of the year the salinity trend is very similar to the reference scenario.
There is considerable variation in soil salinity during the year with higher salinity levels in Rabi than in Kharif. The period January-March is shown to be of utmost importance for salinity management. In winter time farmers can leach salts due to low values of ETpot. The
effect on transpiration due to high salinity levels seems limited, but is highest towards the end of Kharif for cotton as well as the beginning of Rabi for wheat. Farmers' practices, within the existing limits of irrigation water availability and physical conditions, were shown to influence soil salinity. However, the effects of farmers' practices are certainly much smaller than a change in the irrigation quantity or quality.
Conclusion
Farmers have shown a tremendous ability to manage salinity in the Indus Basin irrigation system. Firstly, they have reclaimed large tracts of hitherto fore salinized lands through a series of measures. Indeed, in the Chishtian sub-division the area moderately or severely affected by salinity decreased by 7,000 ha from 16,950 to 10,275 ha (-40%) from 1953 to 1978. Secondly, they have been able to maintain cropping intensities at around 150% even on salt affected lands over a long period of time, juggling between different sources of irrigation water (surface and groundwater) and adapting their irrigation practices to a wide diversity of physical constraints. Laboratory results indicate that for different watercourses of the Fordwah and Azim distributaries almost 30% of the cultivated fields that were sampled had an SAR greater than 8. These fields are confronted with severe problems of sodicity (hard layers, infiltration problems), but continue to produce. The government interventions, mainly focused on lowering groundwater tables, have supported farmers in their salinity management. The greater availability of good quality surface water to the Indus Basin canal commands has also contributed significantly in this regard.
This study shows indeed the importance of an access for farmers to an irrigation water of sufficient quality, be it surface or groundwater. Farmers in Azim distributary have thus been able to replace a diminishing surface water supply by using more tubewell water. Farmers in Fordwah distributary, whose poor quality groundwater can only be used when combined with surface water, have made sure that their access to canal supplies remains ensured. In those areas where the groundwater is of poor quality, farmers rely indeed entirely on the supply of surface water and any problem related to this supply impacts directly on the crop production. Extra water supplies for reclaiming portions of land affected by salinity are no longer sanctioned due to the severe water stress in the Indus Basin. A reallocation of water to canal commands, taking the salinity status and the present conjunctive use environment into account, could be envisaged in order to maximise the extent of the irrigated land and the number of farmers that participate in irrigated agriculture.
The water allocation in the Indus Basin is a patchwork of water rights that have been fixed at the design stage of the different canal commands, defining the extent of the irrigation schemes (the so-called canal command areas, CCA) and the entitlement per unit of land. In addition, certain canal commands receive year-round supplies (perennial systems), while others receive water only during the flood season, Kharif (non-perennial systems). Climate, soil and crop type, depth to groundwater table, historical water rights and a negotiation process between the different riparian provinces and independent states to demarcate the
share of water of a proposed irrigation scheme were important factors in this process. The water allocation is revised regularly at a local level through the inclusion of hitherto fore unirrigated land into the CCA. However, these revisions are generally not accounted for in the authorised discharges at higher levels of the irrigation system. The water allocation has also been discussed regularly at a regional level through a series of high level committees culminating in the 1991 Water Apportionment Accord, specifying the shares of each of the provinces. The accord is much less specific at the canal command level. A reallocation of water in the Indus Basin canal commands is, of course, a very sensitive and extremely important issue, and is definitely not related to salinity control only. However, the salinity of irrigated lands threatens the livelihood of those farmers located in physically unfavourable conditions and should be taken into account when discussing the water allocation in the Indus Basin.
The spatial heterogeneity of physical parameters and temporal variability of different processes, as well as the diversity of farms are inherent in the analysis of irrigation systems. This is a disadvantage, because it implies that the spatial and temporal structure of information needs to be analyzed, requiring a more substantial data set, and advanced geo-statistical techniques to classify and extrapolate. For policy makers and irrigation managers, this poses also a serious problem as the effectiveness of global interventions are reduced. However, heterogeneity/variability can also be seen as an important strength and opportunity. Strength because the system is better adapted to external shocks, and opportunity because the heterogeneity and variability offer possibilities for redistribution of resources. Kuper (1997) showed that due to a heterogeneity in groundwater quality and soil types, a redistribution of water can lead to a considerable decrease in the area affected by salinity and sodicity. The challenge is thus in understanding and quantifying the existing heterogeneity and use it for defining policy and management interventions. These interventions will need to be more diverse and better targeted to specific local conditions in order to be more effective.
Bibliography
AHMAD R. and A. MAJEED. 1975. Country report - Pakistan. In Proceedings of the international conference on waterlogging and salinity, University of Engineering and Technology, Lahore.
AHMAD M. 2002. Estimation of net groundwater use in irrigated river basins using geo-information techniques: a case study in Rechna Doab, Pakistan. PhD thesis, Wageningen Agricultural University, The Netherlands, 143 p.
AHMED N. and G.R. CHAUDRY. 1988. Irrigated agriculture of Pakistan. Shahzad Nazir Publishers, Lahore, Pakistan, 760 p.
AYERS R.S. and D.W. WESTCOT. 1985. Water quality for agriculture. Irrigation and Drainage Paper 29. Food and Agriculture Organization, Rome, Italy, 174 p.
BAKHSH S.A. and Ch. M. HUSSAIN. 1975. Prospects of irrigated agriculture with saline water in Pakistan. Proceedings of the international conference on waterlogging and salinity, University of Engineering and Technology, Lahore.
CONDOM N., KUPER M., MARLET S., VALLES V., J.W. KIJNE. 1999. Salinisation, alkalinisation and sodification in Punjab, Pakistan: Characterisation of the geochemical and physical processes of degradation. J. of Land Degradation and Rehabilitation 10 : 123-140. Council of the Bahawalpur State. 1900. Letter no. 684 from the Wazir Bahawalpur State, to Col. L.J.H. Grey, Superintendent Bahawalpur State. Archives Irrigation Department, Bahawalpur, Pakistan.
DAM J.C. van and R.A. FEDDES. 1996. Modeling of water flow and solute transport for irrigation and drainage. In Sustainability of irrigated agriculture: 493-512, L.S. Pereira, R.A. Feddes, Gilley J.R. and B. Lesaffre (eds), NATO ASI series, Series E: Applied Sciences vol. 312.
FEDDES R.A., van BAKEL P.J.T, KABAT P., BRONSWIJK J.H.M. and J. HALBERTSMA. 1988. Modeling soil water dynamics in the unsaturated zone - state of the art. J. of Hydrology 100: 69-111.
FRAMJI K.K., GARG B.C. and S.P. KAUSHISH. 1984. Historical development of irrigation in the Indus Basin. Lecture delivered at the special session on the history of irrigation, Fort Collins, CO, U.S.A.
GENUCHTEN van M.Th. 1987. A numerical model for water and solute movement in and below the root zone, Res. Report, US Salinity Laboratory, Riverside, CA.
GHASSEMI F., JAKEMAN A.J. and H.A. NIX. 1995. Salinisation of land and water resources: human causes, management and case studies. CABI/Univ. New South Wales Press Ltd. INDIAN IRRIGATION COMMISSION. 1903. Report of the Indian Irrigation Commission, Part II - Provincial. Office of the Superintendent of Government Printing, Calcutta, India.
KIELEN N. 1996. Farmers' ability to cope with salinity and sodicity. Research report no. 6, International Irrigation Management Institute, Lahore, Pakistan, 78 p.
KIJNE J.W. and E.J. VANDERVELDE. 1992. Salinity in Punjab watercourse commands and irrigation system operations. In Advances in IIMI's Research 1989-1991. Colombo, Sri Lanka, p. 139-176
KUPER M. and E.W. van WAIJJEN. 1993. Farmers' irrigation practices and their impact on soil salinity: is salinity here to stay? Paper presented at the ninth internal program review, International Irrigation Management Institute, Colombo, Sri Lanka: XIII-1 – XIII-43.
KUPER M. 1997. Irrigation management strategies for improved salinity and sodicity control. PhD thesis, Agricultural University Wageningen, The Netherlands, 238 p.
LIEFTINCK P., SADOVE A.R., CREYKE T.C. 1968. Water and Power resources of West Pakistan, a study in sector planning, the main report, volume 1, 319 p, World Bank, Washington
MEHTA M.L. 1940. The formation and the reclamation of thur lands in the Punjab. Paper no. 235, Proceedings Punjab Engineering Congress, Lahore, Pakistan.
MUHAMMED S. 1978. Salt-affected soils of Pakistan. Proceedings of a seminar on membrane biophysics and salt tolerance in plants. University of Agriculture Faisalabad.
NESPAK/SGI. 1991. Contribution of private tube wells in the development of water potential. Ministry of Planning and Development, Government of Pakistan, Islamabad.
PRASAD R. 1988. A linear root water uptake model. J. of Hydrol. 99: 297-306
RICHARDS L.A. (ed.). 1954. Diagnosis and improvement of saline and alkali soils. USDA Agricultural Handbook 60. Washington D.C., USA.
SMETS S.M.P., KUPER M., VAN DAM J.C., R.A. FEDDES. 1997. Salinization and crop transpiration of irrigated fields in Pakistan’s Punjab. Agricultural Water Management no. 35 : 43-60.
SOIL SURVEY OF PAKISTAN. 1998. Semi-detailed soil survey of the Chishtian sub-division. IIMI Research Report n° 45, Lahore, Pakistan.
STROSSER P. and M. KUPER. 1994. Water markets in the Fordwah/Eastern Sadiqia area. Working Paper no. 30, International Irrigation Management Institute, Colombo, Sri Lanka, 33 p.
TABET D. 1999. Intérêt d’une approche spatiale pour le suivi de la salinité des sols dans les systèmes irriguées. PhD thesis, ENGREF, Paris, France, 435 p.
TAREEN A.K., MEHMOOD K., IQBAL A., KHAN M.A. and M. KUPER. 1996. Water distribution at the secondary level in the Chishtian sub-division. International Irrigation Management Institute, Lahore, Pakistan, 179 p.
WAIJJEN E.G. van. 1996. Study of water and salt balances for 8 sample watercourse commands in Chishtian Sub-division, Punjab, Pakistan. International Irrigation Management Institute, Lahore, Pakistan, 33 p.
WÖSTEN J.H.M. and M.Th. van GENUCHTEN. 1988. Using texture and other soil properties to predict the unsaturated soil hydraulic properties. Soil Sci. Soc. of Am. J. 52: 1762-1770.