HAL Id: hal-02273135
https://hal.sorbonne-universite.fr/hal-02273135
Submitted on 28 Aug 2019
HAL is a multi-disciplinary open access
archive for the deposit and dissemination of
sci-entific research documents, whether they are
pub-lished or not. The documents may come from
teaching and research institutions in France or
abroad, or from public or private research centers.
L’archive ouverte pluridisciplinaire HAL, est
destinée au dépôt et à la diffusion de documents
scientifiques de niveau recherche, publiés ou non,
émanant des établissements d’enseignement et de
recherche français ou étrangers, des laboratoires
publics ou privés.
Copyright
Facilitation- versus competition-driven succession: the
key role of resource-ratio
Thomas Koffel, Simon Boudsocq, Nicolas Loeuille, Tanguy Daufresne
To cite this version:
Thomas Koffel, Simon Boudsocq, Nicolas Loeuille, Tanguy Daufresne.
Facilitation- versus
competition-driven succession: the key role of resource-ratio. Ecology Letters, Wiley, 2018, 21 (7),
pp.1010-1021. �10.1111/ele.12966�. �hal-02273135�
Facilitation- versus competition-driven succession: the key role of
resource-ratio
Thomas Koffel
1,2,∗Simon Boudsocq
1Nicolas Loeuille
3Tanguy Daufresne
11. Eco&Sols, INRA, CIRAD, IRD, Montpellier SupAgro, Univ Montpellier, 34060, Montpellier, France;
2. Kellogg Biological Station, Michigan State University, 3700 E Gull Lake Dr, Hickory Corners, MI 49060, USA; 3. Sorbonne Universités, UPMC Univ Paris 06, CNRS, IRD, INRA, Université Paris Diderot, Institute of Ecology and Environmental Sciences (UMR7618), 7 quai St Bernard, 75005, Paris, France.
∗ Corresponding author; e-mail: koffelth@msu.edu.
Running title: Facilitative succession by N-fixers
Keywords (up to 10): Nitrogen fixation, facilitation, zero net growth isocline, alternative stable states, primary succession, ecosystem development, resource-ratio theory
Type of article: Letter
Number of words in abstract (147/150); number of words in main text (excluding abstract, acknowledgements, references, table and figure legends = 4997); number of words in text box (0)
Number of references (98)
Number of figures (5); Number of tables (0); Number of text boxes (0)
Statement of authorship: T.K., S.B. and T.D. designed the study. T.K. performed the modeling work. T.K. wrote the first draft of the manuscript, and all authors contributed substantially to revisions.
Data accessibility statement : Should this manuscript be accepted, the data supporting the results will be archived in an appropriate public repository such as Dryad or Figshare and the data DOI will be included at the end of the article.
Abstract
Symbiotic nitrogen (N)-fixing plants are abundant during primary succession, as typical bedrocks lack available N. In turn, fixed N accumulates in soils through biomass turnover and recycling, favoring more nitrophilous organisms. Yet, it is unclear how this facilitation mechanism interacts with competition for other limiting nutrients such as phosphorus (P) and how this affects succession. Here, we introduce a resource-explicit, community assembly model of N-fixing species
5
and analyze successional trajectories along resource availability gradients using contemporary niche theory. We show that facilitation-driven succession occurs under low N and high enough P availabilities, and is characterized by autogenic ecosystem development and relatively ordered trajectories. We show that late facilitation-driven succession is sensitive to catastrophic shifts, highlighting the need to invoke other mechanisms to explain ecosystem stability near the climax. Put together with competition-driven succession, these results lead to an enriched version of Tilman’s resource-ratio theory of
10
Introduction
Primary succession, the sequential replacement of plant species through time following the appearance of a bare substrate, is a central concept in ecology (Walker and del Moral 2003; Shugart 2013), and occurs on virtually any substrate, from sand dunes (Cowles 1901; Olson 1958) to glacial moraines (Chapin et al. 1994). Odum (1969) defines succession through three
15
characteristics: (i) it is a reasonably directional and orderly process, (ii) it results from the reciprocal interaction between the plant community and its physical environment, (iii) it culminates in a climax maximizing biomass and stability.
Nitrogen (N)-fixing organisms such as legumes and actinorhizal plants usually thrive during primary succession due to an initial lack of available N (Walker and del Moral 2003). In Glacier Bay, Alaska, succession usually includes a broad range of N-fixing species (Walker 1993), from pioneers like ‘black crust’-forming cyanobacteria (Worley 1973; Schmidt
20
et al. 2008) and lichen of the genus Stereocaulon, to mid- and late colonists like Drummond’s aven (Dryas drummondii ; Lawrence et al. 1967) and green alder (Alnus viridis). Conversely, because of biomass turnover and recycling, fixed N accumulates in the soil and becomes available to the whole community (Crocker and Major 1955; Chapin et al. 1994; Halvorson and Smith 1995; Crews et al. 2001; Walker et al. 2003; Kohls et al. 2003). Such facilitation mechanisms between plants (Callaway 1995) are potential drivers of primary succession, as exemplified by the facilitation model of succession,
25
or facilitation-driven succession, in which ‘early colonizers modify the environment, thereby making it more suitable for later colonizers to invade and prosper and less suitable for early colonizers to survive’ (Connell and Slatyer 1977).
In fact, N-fixing organisms also compete for the access to other essential resources such as light or phosphorus (P). Contrary to N availability, P availability in the pre-succession substrate is usually high, then decreases over time as it gets weathered from the bedrock and immobilized in the biotic compartments (Walker and Syers 1976; Vitousek et al.
30
1993, 2010). These central yet contrasted roles played by N and P during succession have put them at the center of models of ecosystem development over the last decades (Vitousek and Farrington 1997; Marleau et al. 2011; Laliberté et al. 2012; Menge et al. 2012). Both the absolute and relative richnesses of the abiotic environment in these two nutrients are expected to control succession, as formalized in the ‘resource-ratio theory of succession’ (Tilman 1985). Yet, it is still unclear how competition for P and facilitation for N interact during succession (Callaway and Walker 1997), and when
35
this results in facilitation-driven successions.
Models of primary succession have long been limited to verbal and conceptual approaches (Clements 1916; Odum 1969; Connell and Slatyer 1977). Their formalization first led to Markovian models of succession, i.e. based on phenomenological transitions between vegetated states, without specifying any competition mechanisms or making explicit the soil properties that mediates them (Van Hulst 1979; Usher 1981; Siles et al. 2008). By contrast, population- (Tilman 1985) or
individual-40
based (Huston and Smith 1987) resource competition models rely on the feedback between plants and their environment. In the context of P acquisition and N fixation, recent resource competition models mostly consider short-scale transient dynamics including only a few different species (Marleau et al. 2011) or a single undifferentiated plant compartment (Menge et al. 2012). Other succession models rely on a large number of species in a game theoretical perspective, but
ignore N accumulation (Tilman 1985; Loreau 1998; Sheffer et al. 2015) or have focused on the succession end point rather
45
than the whole developmental trajectory (Menge et al. 2008; Kylafis and Loreau 2008).
In this paper, we investigate autogenic succession by a community of N-fixers, differing in their abilities to fix N and acquire P. First, we use a mechanistic plant-soil model to describe how these species perform in the absence of other competing species, and classify them into three categories accordingly. Second, we embed this ecological model into a community assembly dynamics model to answer the following questions: how do competition and facilitation interact,
50
and under what conditions does it lead to facilitation-driven succession? How does ecosystem stability change during succession? We conclude by summarizing these results into an enriched version of Tilman’s (1985) ‘resource-ratio theory of succession’.
Ecological model and analysis
Plant-soil model
55
We consider a classical plant-soil model from resource competition theory (MacArthur 1970; León and Tumpson 1975; Tilman 1982; Grover 1995; Chase and Leibold 2003) adapted to account for N-fixation, where a single species with population biomass BF grows on soil nitrogen (N) and phosphorus (P), with concentrations N and P respectively. N and
P are supplied externally at constant influxes IN and IP and leave the system at leaching rates lN and lP. Following
Leibig’s law of the minimum, plant growth is limited by the least available nutrient:
60
gtot(P, N ) = min[gP(P ), gN(N ) + F ] (1)
where plant growth rate when P is limiting is given by gP(P ), and plant growth rate when N is limiting is the sum of
growth on soil N denoted gN(N ) and maximal N-fixation rate F . Assuming constant plant stoichiometric coefficient qP
and qN, plant growth translates into proportional P uptake equal to qP.gtot (Tilman 1982). On the N side, we make
the key assumption of facultative N-fixation, which is more realistic than purely obligate N-fixation (e.g. Tyrrell 1999), with important ecological consequences (Agawin et al. 2007; Menge et al. 2009). More precisely, facultative N-fixation
65
translates into soil N uptake being systematically privileged over atmospheric N-fixation, the latter only happening when soil N is limiting. This mechanism is justified by the substantial costs associated with N-fixation (Gutschick 1981) and implicitly assumes that the plants can freely down-regulate their N-fixing activities. As a result, soil N uptake is equal to qN. min[gP(P ), gN(N )]. The interplay between P limitation and N-fixation leads to three different uptake regimes for
the plant: P-limitation without N-fixation, P-limitation with partial N-fixation and N-limitation with maximal N-fixation
70
(Fig 1 and Appendices A, B). Finally, plant biomass is lost at constant per capita mortality rate m and partially recycled to P and N with efficiency λ. The plant-soil population dynamics is then given by the following ordinary differential
equation system: dBF dt = [min[gP(P ), gN(N ) + F ] − m] BF (2a) dP dt = IP− lPP − qPmin[gP(P ), gN(N ) + F ]BF+ qPλmBF (2b) dN dt = IN − lNN − qNmin[gP(P ), gN(N )]BF+ qNλmBF (2c) These equations are a simplified version of the model of Menge et al. (2009), not explicitly including organic nutrient pools, as they have no influence on our results at the ecological equilibrium. In practice, the associated extra parameters
75
can be thought of being lumped in λ.
Regional species pool
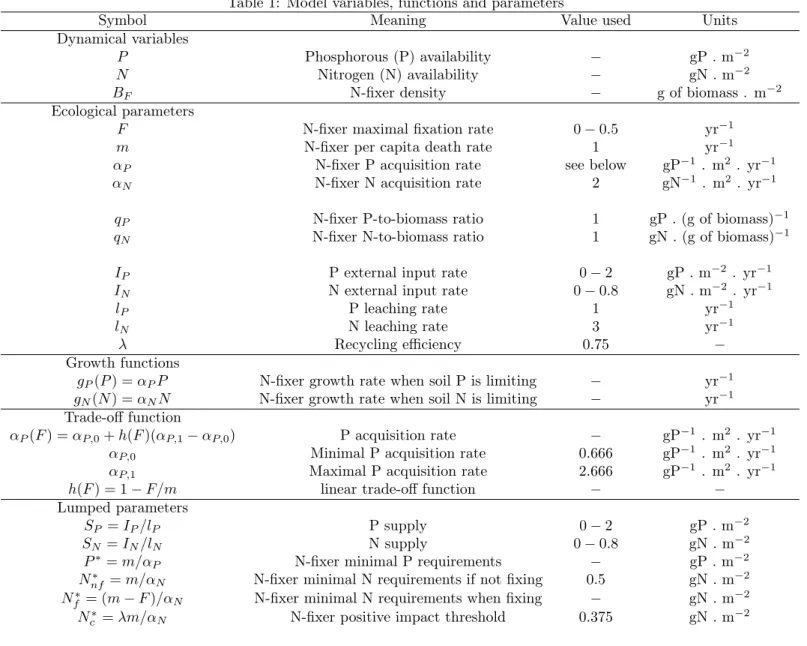
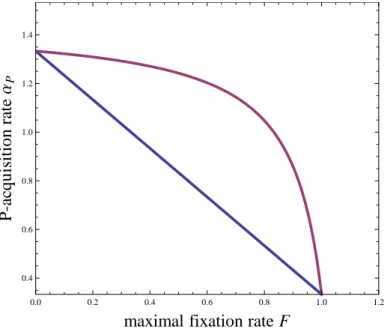
We consider that the various N-fixing plant species that can establish during succession form a regional pool of strategies with different maximal fixation rates F , from plants with low fixing abilities that mostly rely on soil nitrogen to plants that can be completely independent from soil N referred to as "total fixers" (Holter 1984). We make the key assumption
80
that plants’ maximal fixation rates F trade off against their ability to acquire P (see Table 1 for details, Appendix D for loosening this assumption, and Discussion). This is justified by the substantial costs associated with plants’ specific adaptations to low-P soil conditions (Zhu and Lynch 2004; Lynch and Ho 2005), such as root morphology and architecture (e.g. lateral and cluster roots), root exudates, rhizosphere acidification and mycorrhizal symbioses, which leads to trade-offs between P-acquisition and other costly functions such as N-fixing ability, e.g. root-nodule allocation trade-offs (Thuynsma
85
et al. 2014).
Graphical analysis and N-fixers classification
Before addressing succession dynamics, we first visualize the equilibrium properties of an ecosystem dominated by a given plant species with maximal fixation rate F along N and P external supplies. Doing so, we classify N-fixing species from the species pool into three categories —low, high and total N-fixers— according to their qualitative behavior, highlighting
90
the different roles the N-fixing species will play during succession. Our model is adapted from the essential resource case of competition theory (Tilman 1982; Grover 1997; Chase and Leibold 2003) with the inclusion of nitrogen fixing and nutrient recycling (Daufresne and Hedin 2005). It can therefore be studied graphically with the help of three ingredients: supply points, Zero Net Growth Isoclines (ZNGI) and impact vectors.
The supply point (SP, SN) corresponds to N and P levels at equilibrium in the absence of any plant. It characterizes 95
the baseline fertility of the bare substrate. Setting eq. (2b-2c) to zero with B = 0 gives SP = IP/lP and SN = IN/lN.
The supply point can be displayed in the resource plane (Black dot, Fig. 2b-d).
The ZNGI of a N-fixing species with biomass BF can be obtained by setting the growth eq. (2a) to zero. It gives the
substrate conditions under which this species can establish itself starting from a very low density. As in the standard
100
essential resource case (Tilman 1982), the ZNGI is a right-angle line whose corner’s coordinates are Tilman’s R∗ for N and P, the minimal resource required for growth (Fig. 2). We denote them P∗ and Nf∗, the latter subscript f distinguishing Nf∗ from the plant’s minimal requirements in the absence of fixation Nnf∗ (See Appendix B for details). As Nnf∗ > Nf∗, N-fixation enables the plant to grow under harsher N-limiting conditions, graphically lowering the position of the ZNGI corner. Because of the trade-off between maximal fixation rate F and P acquisition, P∗ and Nf∗are negatively correlated.
105
This can be visualized graphically when a large number of species with varying maximal fixation rates are sampled from the species pool and their ZNGIs displayed (Fig. 2a): all the ZNGIs’ corner form a decreasing curve called the envelope (Klausmeier et al. 2007; Danger et al. 2008; Koffel et al. 2016). This continuum of strategies can be divided into three categories: low, high and total N-fixers (respectively Fig. 2b-d). Total N-fixers correspond to strategies with F > m, as they have Nf∗= 0. They can invade the bare substrate even in the complete absence of N supply, but are the poorest P
110
competitors (Fig 2c).
To understand the difference between low and high fixers, we need to introduce the impact vectors. The impact vectors describe the net impact of the plant population on the two nutrients, through uptake and recycling. Their coordinates can be read as the factors in front of BF in eq. (2b,2c). They are displayed on Fig. 2 for a few equilibrium points located
on the ZNGI. Contrary to the low N-fixer case (Fig. 2b), the high and total N-fixer cases (Fig. 2c,d) present a soil N
115
threshold denoted Nc∗ under which plant presence has a net positive impact on N, with biotic supply by fixation and
recycling exceeding soil uptake. This facilitation by and between N-fixing individuals under low N conditions leads to N accumulation and destabilizes the N-limited equilibria (Dashed ZNGI lower branch in Fig. 2c, compare with Fig. 2b).
In the high N-fixer case, facilitation leads to alternative stable states, namely, the non-zero plant population state and the bare substrate (Purple region in Fig. 2c; mathematical details in Appendix B). Indeed, N supply under the ZNGI
120
is too low for N-fixers to invade from low density, but a larger population can persist under these conditions thanks to facilitation. This alternative stable state regime disappears for total N-fixers, as they can invade for any N availability (Fig. 2d). The presence of alternative stable states means that the vegetated ecosystem can undergo a sudden transition to the bare substrate (Scheffer et al. 2001; Kéfi et al. 2008). This sudden transition could be triggered by a slight change in environmental conditions such as a decrease in external phosphorous supply, or happen after a perturbation, e.g. fire
125
or herbivore outbreak, that would be large enough to drive the N-fixing population under its recovery threshold.
Reading Fig. 2 as bifurcation diagrams along the nutrient supplies summarizes this analysis, with the white region corresponding to the bare substrate only (the plant can neither invade nor persist), the blue region the plant population only (the plant can invade and persist) and the purple region alternative stable states between the two (the plant cannot invade, but can persist).
Community assembly dynamics
Given the species pool described above, we now investigate the succession dynamics occurring among these species. Indeed, we suppose that these N-fixing species form a regional species pool (Drake 1990; Morton and Law 1997; Chase and Leibold 2003), from which colonization attempts happen at random with the introduction of a few invading individuals into the succession site. To make the problem tractable, we assume a time scale separation between rare colonization attempts
135
from the N-fixing species pool and faster ecosystem relaxation between these invasions. As we are interested in the role played by facilitation during succession, we also assume for the next two subsections that N availability is low enough for N-fixation to induce a positive feedback loop (SN < Nc∗).
Successional step
Let us describe what happens when a focal invading species is introduced in the system formerly at equilibrium. This
140
pre-invasion equilibrium situation corresponds either to the initial bare substrate, or follows the stabilization of a resident vegetated ecosystem after a previous successful colonization, as described in the previous section. In both cases, the pre-invasion soil properties are given by their equilibrium nutrient concentrations, noted ˆN and ˆP , and completely determine the success of the invader. Denoting F0 and BF0 the maximal fixation rate and biomass of this invader, its success is
quantified by the sign of its per capita growth rate when rare, the invasion fitness ρ (Metz et al. 1992; Geritz et al. 1997,
145 1998; Hui et al. 2016): ρ(F0, ˆP , ˆN ) = 1 BF0 dBF0 dt P , ˆˆN ;B F 0→0+ = min[gP0 ( ˆP ), gN( ˆN ) + F0] − m (3)
where g0P denotes phosphorus uptake by the invader and trades off against F0. According to the previous section, if the pre-invasion ecosystem is the bare substrate, ˆN and ˆP are simply equal to the supplies SN and SP. Otherwise, ˆN and ˆP
are fully determined by the equilibrium of the pre-invasion plant-soil model, i.e. located on the ZNGI of the resident plant species, whose maximal fixing rate is denoted F (like in Fig. 2b). If ρ(F0, ˆP , ˆN ) is negative, invasion fails as the invader
150
goes extinct and the resident ecosystem stays the same. If ρ(F0, ˆP , ˆN ) is positive, invasion is successful and the invader’s population gets large enough to impact the resident equilibrium. From there, several outcomes from this competition phase are technically possible when invading a resident population: 1) the invader becomes the new resident after excluding the former resident; 2) the invader and the resident reach an equilibrium where they coexist; or 3) invasion by the invader leads to a collapse of the whole ecosystem towards the bare substrate state, a particular case of a phenomenon known as
155
‘the resident strikes back’ (Mylius and Diekmann 2001; Geritz et al. 2002). Under the assumption of low N availability (SN < Nc∗), the positive feedback loop ensures that all strategies can only be P-limited at equilibrium, which, in virtue of
Tilman’s (1982) R∗ rule, excludes option 2, i.e. coexistence. As we also checked numerically that option 3, i.e. invasion-driven ecosystem collapse, does not happen, the only outcome here is option 1, i.e. exclusion of the resident by the invader. This means that the community is always dominated by a single species throughout the succession.
As the invader replaces and becomes the new resident, it sets the nutrient levels at equilibrium on its own ZNGI. This new equilibrium can have the bare substrate as an alternative stable state if strategy F0 cannot invade on its own (e.g. situation with high N-fixer depicted in Fig. 2c). When this happens, the presence of the resident F facilitated the establishment of F0, by making the invasion of the latter possible (Gerla et al. 2011; Rapaport 2017). We call such an invader-resident replacement a facilitation-driven successional step. This facilitation-driven successional step is illustrated
165
in Fig. 3 with two different strategies from the regional species pool, F1close to total N-fixation but not very competitive
for P and F2 with high N-fixation but more balanced N and P competitive abilities (F1> F2). The supply point is such
that the initial bare substrate is rich in P but highly N depleted, meaning that only F1, the pioneer species, can at first
invade (S in Fig. 3a). However, the establishment of F1 increases N availability at equilibrium due to positive impact
(R1 in Fig. 3). This leads to N level that are above F2 requirements, making invasion by F2 possible. Being better at 170
P-acquisition, F2 competitively excludes F1 by pulling P levels down as it invades, and further increases N levels in the
system (R2 in Fig. 3). As a new resident, F2 can persist after outcompeting F1 thanks to the positive feedback loop on
N, as S is located in F2 alternative stable state region.
This successional step can be visualized using a graphical tool adapted from the eco-evolutionary literature, the Pairwise Invasibility Plot (PIP) (Geritz et al. 1997). It consists in plotting the sign of the invasion growth rate ρ against both the
175
invader trait F0 on the y-axis, and the pre-invasion state (resident F or bare substrate) on the x-axis (Fig. 3b). The figure obtained is divided in two parts: the PIP proper on the left displaying invasion success of an invader F0 against a resident F , and an additional bar plot on the right displaying the invader success in the bare substrate (ρ > 0 in blue, ρ < 0 in white and gray Fig. 3b). The strategies with positive invasion on the bar plot correspond to the pioneer species. Information on the status of the resident state is displayed on the plot, indicating whether this strategy cannot be resident
180
for this supply point (black), or can be resident with (grey) or without an alternative stable state (white). The trajectory on the PIP illustrates the substitution sequence leading to the successional step.
Facilitation-driven succession and ecosystem development
The facilitation-driven successional step described in the previous section can be iterated by repeated successful coloniza-tions events, leading to facilitation-driven successions. We assume equal probability of introduction for all the N-fixing
185
species, i.e. no colonization-competition trade-off (Tilman 1990). As discussed later, we expect facilitation-driven suc-cession to be robust to the release of this assumption. Some general properties of this sucsuc-cession can be read directly on the PIP or deduced from the equilibrium properties of the plant-soil model. We also randomly generate successional trajectories and track the three quartiles of the distribution of probability to be in a given succession state through time (Fig. 4c-f), using the information contained in the PIP to assess the invasion success of invaders repeatedly chosen at
190
random from the species pool.
In terms of community assembly, succession always starts with a pioneer species, i.e. a plant presenting a high enough maximal fixation rate to invade the bare substrate. This species can be displaced by another pioneer species, or facilitate
its replacement by species with higher P-acquisition and lower fixation rates unable to invade by their own, themselves facilitating species with even lower fixation rates, etc, in an orderly monotonic process. However, as fixation rates decrease
195
along succession, a decreasing range of strategies are able to invade, up to a certain strategy where no further invasion is possible (Fig. 4b). Such successional endpoint is located at the edge of the positive invasion region (blue, Fig. 4b), and is called an Evolutionary Stable Strategy (ESS) in the eco-evolutionary literature. Interestingly, this ESS is never attained but only approached asymptotically, as it is unable to invade any other strategy (Geritz et al. 1998). This leads to a progressive slowdown in late succession. As the ESS is located on the edge of the bistable region (gray, Fig. 4b), the
200
late succession ecosystem is not globally stable, and a strong enough perturbation affecting plant biomass, such as fire or a sudden herbivore outbreak, could lead to the collapse of succession towards a non-vegetated state.
Such a succession of above-ground N-fixing strategies is associated with simultaneous below-ground changes in soil properties, leading to ecosystem development. Soil P starts at the initial substrate availability SP and then decreases,
tending towards a reduced availability as we get close to the ESS (Fig. 4e). Conversely, soil N starts at SN and increases, 205
asymptotically reaching a plateau (Fig. 4f). Such accumulation of soil N over time during succession seems at first contradictory as the strategies that establish in the course of succession are less and less efficient at N-fixation (Fig. 4c). However, plant biomass also increases during succession, as plants better at exploiting P establish in the ecosystem (Fig. 4d). As total fixation is proportional to both N-fixer biomass and fixation rate, the increase in biomass compensates the decrease in per capita fixation rates, leading to an overall increase in fixation, and thus soil N, during succession. A
210
last characteristic of facilitation-driven succession relies in the relative similarity between multiple trajectories despite the intrinsic stochastic nature of the colonization events (Fig. 4b-d). This is captured by the particular shape of the PIP, as the positive invasion region is restricted to a relatively narrow band.
A resource-ratio theory of succession
We now want to delimit exactly the nutrient supplies that lead to facilitation-driven succession, and explore other possible
215
succession scenarios (Connell and Slatyer 1977). Drawing such a bifurcation diagram along the nutrient supply gradients can be done easily using the ‘envelope approach’, a graphical tool adapting resource competition theory to community assembly dynamics (Koffel et al. 2016).
The results are summarized in Fig. 5. Four regions can be identified and labeled with corresponding PIPs. In the bare substrate region (0), N and P are so low that no strategy from the regional species pool can establish or persist. The
220
facilitation-driven succession region (I) is found for low enough N (SN < Nc∗) and high enough P supplies (on the right of
the envelope). Interestingly, a small region (II) is located between (0) and (I). There, succession cannot start because no strategy can invade the bare substrate, but the community would go through succession and persist there if a population of high N-fixers were already present. This can be thought of as community-level alternative stable states between the bare substrate and a community that would undergo succession. Finally, region (III) emerges at high N supplies (SN < Nc∗), 225
corresponding PIPs: most strategies can invade the initial bare substrate, including the ESS, and the establishment of any strategy only decreases the chances of further invasion by other strategies. Contrary to the facilitation-driven succession case, trajectories are not monotonous as the trait F can oscillate around the ESS, and early succession is much more unpredictable as most strategies can establish on the bare substrate (see Fig. 9 in Appendix). Plant biomass increases
230
along succession while both soil P and N availabilities decrease. This competition-driven scenario is close to what Connell and Slatyer (1977) called the tolerance model.
Nutrient supplies not only control succession qualitatively (competition- vs facilitation-driven), they also influence it quantitatively. This can be read on Fig. 5 using the envelope and the impact vectors from the resource-ratio theory. First, because every succession endpoint resource level is located on the envelope, final soil N and P are negatively correlated.
235
For example, the higher the N supply, the higher the N and the lower the P levels at the succession endpoint. The system responds differently to P substrate availability depending on the succession scenario. When competition-driven, an increase in SP leads to an increase in final soil P; the opposite happens in the facilitation case, as a P-richer substrate
eventually leads to a more P-depleted soil. These counter-intuitive results stem from the community-level regulation of N availability around Nc∗, a consequence of the coupling between the ecological positive feedback loop and community
240
assembly. When taken separately, each plant species in the facilitation-driven scenario is only P-limited, as an increase in SN does not lead to an increase in biomass. This contrasts with the community-wide response to nutrient addition, as
the community endpoint biomass responds positively to an increase in both SN and SP, due to species turnover.
Discussion
In this paper, we show how facilitation-driven succession can emerge from repeated invasions of a diversity of N-fixing
245
species in interaction with soil N and P. We characterize the traits, nutrient and biomass dynamics of the developing ecosystem during facilitation-driven succession and show that late succession presents an increasing sensitivity to catas-trophic shifts. Finally, we show how changes in N and P external supplies influence succession characteristics and even succession scenario, shifting from facilitation- to competition-driven.
Facilitation-driven succession differs from classic competition-driven succession by the fact that the invasion success
250
of non-pioneer species relies on the successful invasion and environmental modifications of previous strategies. Such a mechanism gives a straightforward way to test for facilitation-driven succession empirically, as initially proposed by Connell and Slatyer (1977): experimentally remove the pioneer species and watch for changes in the succession dynamics. This approach gave evidence for facilitation-driven succession in rocky intertidal communities (Farrell 1991), but seemed to rule out this mechanism on old-field secondary succession (Hils and Vankat 1982; Armesto and Pickett 1986) and in
255
recent experiments on carrion (Michaud and Moreau 2017).
Our model however suggests that such tests should not be restricted to pioneer species, as any species can facilitate the invasion of subsequent strategies. Every species can thus play a role during facilitation-driven succession and slow it down
when absent. Indeed, the mean succession time of facilitation-driven succession is expected to depend on the colonization rates of all the species in the pool, in stark contrast with competition-driven succession where the mean succession time
260
is essentially the inverse of the colonization rate of the climax strategy, usually much shorter. We therefore suggest that competition versus facilitation- driven succession could be tested experimentally by rarefying the species pool: a subsequent increase in mean succession time would support facilitation-driven succession. If rarefying opens a large gap in the species pool, succession could get blocked in its early stages. However, redundancy between closely functioning N-fixers ensures a certain robustness of facilitation-driven succession to species loss. This illustrates a dynamical ‘insurance effect’
265
on ecosystem development provided by the diversity of N-fixing strategies of the regional species pool (Yachi and Loreau 1999).
Our model describes a replacement from high-fixers to low-fixers during succession, consistently with some empirical evidence reviewed by Vitousek et al. (2013). This is accompanied with an increasing sensitivity to catastrophic shifts of facilitation-driven succession as it approaches its climax, inevitably leading to a late succession collapse towards the
270
bare substrate in the presence of disturbances. From there, succession has to start again from scratch, meaning that in practice, facilitation-driven succession exhibits periodic alternations between developmental phases and sudden collapses, like Watt’s (1947) autogenic succession cycles or other community assembly cycles (Morton and Law 1997; Steiner and Leibold 2004). Such cycles have been observed on empirical systems such as individual associations between cacti and nursing shrubs (Yeaton and Esler 1990; Valiente-Banuet et al. 1991), but we are not aware of any empirical evidence at
275
the ecosystem scale.
From a theoretical perspective, such increasing sensibility to collapse is a consequence of the opposition between the private costs of facilitation and their collective benefits, which selects for cheaters with less efficient fixation, an ecological phenomenon known as the tragedy of the commons (Hardin 1968) or evolutionary suicide (Ferrière 2000; Gyllenberg and Parvinen 2001). Some mechanisms such as spatial aggregation (Kéfi et al. 2008), kin selection (Lion and van Baalen
280
2008) or ‘leakiness’ from the ‘Black Queen Hypothesis’ (Morris 2015) could explain how facilitation is maintained during succession, potentially reconciling our approach with Odum’s (1969) hypothesis of maximal stability at the climax. In fact, some ecosystems such as tropical forests present an abundance of N-fixing plants despite high availability of N (Hedin et al. 2009). Accounting for mechanisms such as the ones mentioned above is thus necessary to understand ecosystem stability and the maintenance of facilitation in late succession.
285
Another prediction of our model is that the succession scenario depends on the external nutrient supplies. This can be tested through nitrogen-addition experiments, by characterizing succession under various levels of fertilization of an N-depleted substrate. We expect facilitation-driven succession to vanish under high levels of fertilization, and mean succession time and final soil P concentration to decrease along fertility gradients. Conversely, the absence of such patterns would suggest that the initial substrate is too rich for facilitation to drive the succession, as exemplified by some studies
290
of secondary succession in old-fields (Huberty et al. 1998; Wilson and Tilman 2002). In this perspective, we predict that the recent global increase in N availability due to human activities (Vitousek et al. 1997) has favored competition-driven
succession and decreased mean succession times.
In our approach, we parsimoniously assumed equal colonization probability for every strategy. However, species differ in their dispersal and competitive abilities, e.g. due to seed size/number trade-offs (Turnbull et al. 1999), which leads
295
to competition/colonization trade-offs at the core of the corresponding succession scenario (Tilman 1994). How would a classical competition/colonization trade-off combine with the facilitation-driven succession scenario? This would depend on how maximal fixation rate correlates with dispersal ability. General information on these correlations is lacking, but N-fixing pioneers tend to be very good dispersers, e.g. microorganisms that travel worldwide attached to dust particules (Gorbushina et al. 2007) or Dryas drummondii and its wind-dispersed plumed achenes (Lawrence et al. 1967). Such
300
dispersal syndromes could in turn explain how these inferior competitors — crucial to initiate succession — are maintained at the landscape level in a metacommunity perspective (Hastings 1980; Leibold et al. 2004).
Our approach relied on two critical assumptions, justified by previous works, that fixation is facultative and that it incurs a cost in terms of P acquisition. If we instead considered obligate N-fixers, we expect facilitation through enriched soil nitrogen to be much stronger. This would dramatically accelerate facilitation-driven succession, and allow most
N-305
fixing species to invade after a short pioneer-dominated phase. This, in turn, could further weaken late succession, and lead to an almost certain collapse of the ecosystem when low-fixing strategies, too weak to maintain the positive feedback loop, happen to invade. This, again, emphasizes the need for additional mechanisms to understand late succession stability.
Loosening the trade-off between that maximal N-fixation and P-acquisition does not qualitatively alter our analysis (Appendix D). Completely relaxing the trade-off would, in the current version of the model, turn the total-fixer into
310
a ‘Hutchinsonian demon’ (Kneitel and Chase 2004), a species that would exclude all the others and freeze succession. The trade-off we use relies on the idea of fixed allocation between two plant traits only. Yet, it is possible that other limiting factors involved in succession actually limit fixation rates. For example, herbivory is known to affect N-fixers and succession (Ritchie and Tilman 1995; Kurokawa et al. 2010). Adding a third trait to our approach would lead to a multidimensional problem, providing a promising direction for future modeling work on facilitation-driven succession.
315
We focused on N-mediated facilitation, but there are other ways through which early colonists can facilitate later invading species (Bruno et al. 2003), e.g. by improving water infiltration (Klausmeier 1999; HilleRisLambers et al. 2001), providing shade to light-intolerant species (Gerla et al. 2011), or increasing nutrient availability through improved soil retention or changes in soil pH (Hinsinger et al. 2011). Such mechanisms could explain decreased nutrient leaching rates during succession (Odum 1969; Vitousek and Reiners 1975) and the exclusion of N-fixing strategies in some late successions
320
(Chapin et al. 1994; Menge et al. 2008), two situations that cannot happen within our model.
To conclude, we presented two principal results regarding facilitation-driven succession by N-fixers. First, we showed that resource availability determines if the succession scenario is facilitation- or competition-driven. Second, we showed that late facilitation-driven succession is sensitive to catastrophic shifts, leading to succession cycles. We therefore expect that the addition of some mechanisms, yet to be explored, is crucial to explain both the maintenance of facilitation during
325
Acknowledgments
Vanessa Ezenwa and two anonymous reviewers provided helpful comments on the manuscript. We thank Bertrand Cloez, Christopher Klausmeier, Yannick Kouakep Tchaptchié, Elena Litchman and the other members of the Litchman-Klausmeier Lab for useful discussions on this subject. This is Kellogg Biological Station contribution #2011.
330
References
Agawin, N. S. R., Rabouille, S., Veldhuis, M. J. W., Servatius, L., Hol, S., van Overzee, H. M. J., and Huisman, J. (2007). Competition and facilitation between unicellular nitrogen-fixing cyanobacteria and non-nitrogen-fixing phytoplankton species. Limnology and Oceanography, 52(5):2233–2248.
Armesto, J. J. and Pickett, S. T. A. (1986). Removal experiments to test mechanisms of plant succession in oldfields.
335
Vegetatio, 66(2):85–93.
Bruno, J. F., Stachowicz, J. J., and Bertness, M. D. (2003). Inclusion of facilitation into ecological theory. Trends in Ecology & Evolution, 18(3):119–125.
Callaway, R. M. (1995). Positive interactions among plants. The Botanical Review, 61(4):306–349.
Callaway, R. M. and Walker, L. R. (1997). Competition and facilitation: a synthetic approach to interactions in plant
340
communities. Ecology, 78(7):1958–1965.
Chapin, F. S., Walker, L. R., Fastie, C. L., and Sharman, L. C. (1994). Mechanisms of primary succession following deglaciation at Glacier Bay, Alaska. Ecological Monographs, 64(2):149–175.
Chase, J. M. and Leibold, M. A. (2003). Ecological Niches: Linking Classical and Contemporary Approaches. University of Chicago Press, Chicago.
345
Clements, F. E. (1916). Plant Succession. An Analysis of the Development of Vegetation.
Connell, J. H. and Slatyer, R. O. (1977). Mechanisms of succession in natural communities and their role in community stability and organization. The American Naturalist, 111(982):1119–1144.
Cowles, H. C. (1901). The physiographic ecology of Chicago and vicinity: a study of the origin, development, and classification of plant societies. Botanical Gazette, 31(3):73–108, 145–182.
350
Crews, T. E., Kurina, L. M., and Vitousek, P. M. (2001). Organic matter and nitrogen accumulation and nitrogen fixation during early ecosystem development in Hawaii. Biogeochemistry, 52(3):259–279.
Crocker, R. L. and Major, J. (1955). Soil development in relation to vegetation surface age at Glacier Bay, Alaska. Journal of Ecology, 43:427–448.
Danger, M., Daufresne, T., Lucas, F., Pissard, S., and Lacroix, G. (2008). Does Liebig’s law of the minimum scale up
355
from species to communities? Oikos, 117(11):1741–1751.
Daufresne, T. and Hedin, L. O. (2005). Plant coexistence depends on ecosystem nutrient cycles: extension of the resource-ratio theory. Proceedings of the National Academy of Sciences of the United States of America, 102(26):9212–9217.
Drake, J. A. (1990). The mechanics of community assembly and succession. Journal of Theoretical Biology, 147:213–233.
Farrell, T. M. (1991). Models and mechanisms of succession: an example from a rocky intertidal community. Ecological
360
Monographs, 61(1):95–113.
Ferrière, R. (2000). Adaptive responses to environmental threats: evolutionary suicide, insurance, and rescue. Options, Spring:12–16.
Geritz, H., Gyllenberg, M., Jacobs, A., and Parvinen, K. (2002). Invasion dynamics and attractor inheritance. Journal of Mathematical Biology, 44(6):548–560.
365
Geritz, S., Metz, J. A. J., Kisdi, É., and Meszéna, G. (1997). Dynamics of adaptation and evolutionary branching. Physical Review Letters, 78(10):2024–2027.
Geritz, S. A. H., Kisdi, É., Meszéna, G., and Metz, J. A. J. (1998). Evolutionarily singular strategies and the adaptive growth and branching of the evolutionary tree. Evolutionary Ecology, 12(1):35–57.
Gerla, D. J., Mooij, W. M., and Huisman, J. (2011). Photoinhibition and the assembly of light-limited phytoplankton
370
communities. Oikos, 120:359–368.
Gorbushina, A. A., Kort, R., Schulte, A., Lazarus, D., Schnetger, B., Brumsack, H.-j., Broughton, W. J., and Favet, J. (2007). Life in Darwin’s dust: intercontinental transport and survival of microbes in the nineteenth century. Environ-mental Microbiology, 9(12):2911–2922.
Grover, J. P. (1995). Competition, herbivory and enrichment: nutrient-based models for edible and inedible plants. The
375
American Naturalist, 145(5):746–774.
Grover, J. P. (1997). Resource Competition. Chapman & Hall, London.
Gutschick, V. P. (1981). Evolved strategies in nitrogen acquisition by plants. The American Naturalist, 118(5):607–637.
Gyllenberg, M. and Parvinen, K. (2001). Necessary and sufficient conditions for evolutionary suicide. Bulletin of Mathe-matical Biology, 63(5):981–993.
380
Halvorson, J. J. and Smith, J. L. (1995). Decomposition of lupine biomass by soil-microorganisms in developing Mount St-Helens pyroclastic soils. Soil Biology & Biochemistry, 27(8):983–992.
Hardin, G. (1968). The tragedy of the commons. Science, 162:1243–1248.
Hastings, A. (1980). Disturbance, coexistence, history, and competition for space. Theoretical Population Biology, 18:363– 373.
385
Hedin, L. O., Brookshire, E. N. J., Menge, D. N. L., and Barron, A. R. (2009). The nitrogen paradox in tropical forest ecosystems. Annual Review of Ecology, Evolution, and Systematics, 40:613–635.
HilleRisLambers, R., Rietkerk, M., van den Bosch, F., Prins, H. H. T., and De Kroon, H. (2001). Vegetation pattern formation in semi-arid grazing systems. Ecology, 82(1):50–61.
Hils, M. H. and Vankat, J. L. (1982). Species removals from a first-year old-field plant community. Ecology, 63(3):705–711.
390
Hinsinger, P., Betencourt, E., Bernard, L., Brauman, A., Plassard, C., Shen, J., Tang, X., and Zhang, F. (2011). P for two, sharing a scarce resource: soil phosphorus acquisition in the rhizosphere of intercropped species. Plant physiology, 156(3):1078–86.
Holter, V. (1984). N2(C2H2)-fixation in early stages of a primary succession on a reclaimed salt marsh. Holarctic Ecology, 7:165–170.
395
Huberty, L. E., Gross, K. L., and Miller, C. J. (1998). Effects of nitrogen addition on successional dynamics and species diversity in Michigan old-fields. Journal of Ecology, 86(5):794–803.
Hui, C., Richardson, D. M., Landi, P., Minoarivelo, H. O., Garnas, J., and Roy, H. E. (2016). Defining invasiveness and invasibility in ecological networks. Biological Invasions, 18(4):971–983.
Huston, M. and Smith, T. (1987). Plant succession: life history and competition. The American Naturalist, 130(2):168–198.
400
Kéfi, S., van Baalen, M., Rietkerk, M., and Loreau, M. (2008). Evolution of local facilitation in arid ecosystems. The American Naturalist, 172(1):E1–E17.
Klausmeier, C. A. (1999). Regular and irregular patterns in semiarid vegetation. Science, 284(5421):1826–8.
Klausmeier, C. A., Litchman, E., and Levin, S. A. (2007). A model of flexible uptake of two essential resources. Journal of Theoretical Biology, 246(2):278–89.
405
Kneitel, J. M. and Chase, J. M. (2004). Trade-offs in community ecology: linking spatial scales and species coexistence. Ecology Letters, 7(1):69–80.
Koffel, T., Daufresne, T., Massol, F., and Klausmeier, C. A. (2016). Geometrical envelopes: extending graphical contem-porary niche theory to communities and eco-evolutionary dynamics. Journal of Theoretical Biology, 407:271–289.
Kohls, S. J., Baker, D. D., Van Kessel, C., and Dawson, J. O. (2003). An assessment of soil enrichment by actinorhizal
410
Kurokawa, H., Peltzer, D. A., and Wardle, D. A. (2010). Plant traits, leaf palatability and litter decomposability for co-occurring woody species differing in invasion status and nitrogen fixation ability. Functional Ecology, 24(3):513–523.
Kylafis, G. and Loreau, M. (2008). Ecological and evolutionary consequences of niche construction for its agent. Ecology Letters, 11(10):1072–81.
415
Laliberté, E., Turner, B. L., Costes, T., Pearse, S. J., Wyrwoll, K. H., Zemunik, G., and Lambers, H. (2012). Experimental assessment of nutrient limitation along a 2-million-year dune chronosequence in the south-western Australia biodiversity hotspot. Journal of Ecology, 100(3):631–642.
Lawrence, D. B., Schoenike, R. E., Quispel, A., and Bond, G. (1967). The role of Dryas drummondii in vegetation development following ice recession at Glacier Bay, Alaska, with special reference to its nitrogen fixation by root nodules.
420
Journal of Ecology, 55(3):793–813.
Leibold, M. A., Holyoak, M., Mouquet, N., Amarasekare, P., Chase, J. M., Hoopes, M. F., Holt, R. D., Shurin, J. B., Law, R., Tilman, D., Loreau, M., and Gonzalez, A. (2004). The metacommunity concept: a framework for multi-scale community ecology. Ecology Letters, 7(7):601–613.
León, J. A. and Tumpson, D. B. (1975). Competition between two species for two complementary or substitutable
425
resources. Journal of Theoretical Biology, 50(1):185–201.
Lion, S. and van Baalen, M. (2008). Self-structuring in spatial evolutionary ecology. Ecology Letters, 11(3):277–295.
Loreau, M. (1998). Ecosystem development explained by competition within and between material cycles. Proceedings of the Royal Society of London B: Biological Sciences, 265(1390):33–38.
Lynch, J. P. and Ho, M. D. (2005). Rhizoeconomics: Carbon costs of phosphorus acquisition. Plant and Soil, 269(1-2):45–
430
56.
MacArthur, R. H. (1970). Species packing and competitive equilibrium for many species. Theoretical Population Biology, 1:1–11.
Marleau, J. N., Jin, Y., Bishop, J. G., Fagan, W. F., and Lewis, M. A. (2011). A stoichiometric model of early plant primary succession. The American Naturalist, 177(2):233–245.
435
Menge, D. N. L., Hedin, L. O., and Pacala, S. W. (2012). Nitrogen and phosphorus limitation over long-term ecosystem development in terrestrial ecosystems. PLoS ONE, 7(8):e42045.
Menge, D. N. L., Levin, S. A., and Hedin, L. O. (2008). Evolutionary tradeoffs can select against nitrogen fixation and thereby maintain nitrogen limitation. Proceedings of the National Academy of Sciences of the United States of America, 105(5):1573–1578.
Menge, D. N. L., Levin, S. A., and Hedin, L. O. (2009). Facultative versus obligate nitrogen fixation strategies and their ecosystem consequences. The American Naturalist, 174(4):465–477.
Metz, J. A. J., Nisbet, R. M., and Geritz, S. A. (1992). How should we define ’fitness’ for general ecological scenarios? Trends in Ecology & Evolution, 7(6):198–202.
Michaud, J. P. and Moreau, G. (2017). Facilitation may not be an adequate mechanism of community succession on
445
carrion. Oecologia, 183(4):1143–1153.
Morris, J. J. (2015). Black Queen evolution: the role of leakiness in structuring microbial communities. Trends in Genetics, 31(8):475–482.
Morton, R. D. and Law, R. (1997). Regional species pools and the assembly of local ecological communities. Journal of Theoretical Biology, 187(3):321–331.
450
Mylius, S. D. and Diekmann, O. (2001). The resident strikes back: invader-induced switching of resident attractor. Journal of Theoretical Biology, 211:297–311.
Odum, E. P. (1969). The strategy of ecosystem development. Science, 164(3877):262–270.
Olson, J. S. (1958). Rates of succession and soil changes on southern Lake Michigan sand dunes. Botanical Gazette, 119(3):125–170.
455
Rapaport, A. (2017). Some non-intuitive properties of simple extensions of the chemostat model. Ecological Complexity, page https://doi.org/10.1016/j.ecocom.2017.02.003.
Ritchie, M. E. and Tilman, D. (1995). Responses of legumes to herbivores and nutrients during succession on a nitrogen-poor soil. Ecology, 76(8):2648–2655.
Scheffer, M., Carpenter, S., Foley, J. A., Folke, C., and Walker, B. (2001). Catastrophic shifts in ecosystems. Nature,
460
413:591–596.
Schmidt, S. K., Reed, S. C., Nemergut, D. R., Grandy, A. S., Cleveland, C. C., Weintraub, M. N., Hill, A. W., Costello, E. K., Meyer, A. F., Neff, J. C., and Martin, A. M. (2008). The earliest stages of ecosystem succession in high-elevation (5000 metres above sea level), recently deglaciated soils. Proceedings of the Royal Society of London B: Biological Sciences, 275(1653):2793–2802.
465
Sheffer, E., Batterman, S. A., Levin, S. A., and Hedin, L. O. (2015). Biome-scale nitrogen fixation strategies selected by climatic constraints on nitrogen cycle. Nature Plants, 1(12):15182.
Shugart, H. H. (2013). Ecological succession and community dynamics. In Leemans, R., editor, Ecological Systems: Selected Entries from the Encyclopedia of Sustainability Science and Technology, pages 31–57. Springer Science.
Siles, G., Rey, P. J., Alcántara, J. M., and Ramírez, J. M. (2008). Assessing the long-term contribution of nurse plants to
470
restoration of Mediterranean forests through Markovian models. Journal of Applied Ecology, 45(6):1790–1798.
Steiner, C. F. and Leibold, M. A. (2004). Cyclic assembly trajectories and the generation of scale-dependent productivity-biodiversity relationships. Ecology, 85(1):107–113.
Thuynsma, R., Valentine, A., and Kleinert, A. (2014). Phosphorus deficiency affects the allocation of below-ground resources to combined cluster roots and nodules in Lupinus albus. Journal of Plant Physiology, 171(3-4):285–291.
475
Tilman, D. (1982). Resource Competition and Community Structure. Princeton University Press, Princeton, NJ.
Tilman, D. (1985). The resource-ratio hypothesis of plant succession. The American Naturalist, 125(6):827–852.
Tilman, D. (1990). Constraints and tradeoffs: toward a predictive theory of competition and succession. Oikos, 58(1):3–15.
Tilman, D. (1994). Competition and biodiversity in spatially structured habitats. Ecology, 75(1):2–16.
Turnbull, L. A., Rees, M., and Crawley, M. J. (1999). Seed mass and the competition/colonization trade-off: a sowing
480
experiment. Journal of Ecology, 87:899–912.
Tyrrell, T. (1999). The relative influences of nitrogen and phosphorus on oceanic primary production. Nature, 400:525–531.
Usher, M. B. (1981). Modelling ecological succession, with particular reference to Markovian models. Vegetatio, 46:11–18.
Valiente-Banuet, A., Vite, F., and Zavala-Hurtado, J. A. (1991). Interaction between the cactus Neobuxbaumia tetetzo and the nurse shrub Mimosa luisana. Journal of Vegetation Science, 2(1978):11–14.
485
Van Hulst, R. (1979). On the dynamics of vegetation: Markov chains as models of succession. Vegetatio, 40(1):3–14.
Vitousek, P. M. and Farrington, H. (1997). Nutrient limitation and soil development: experimental test of a biogeochemical theory. Biogeochemistry, 37:63–75.
Vitousek, P. M., Menge, D. N. L., Reed, S. C., and Cleveland, C. C. (2013). Biological nitrogen fixation: rates, patterns and ecological controls in terrestrial ecosystems. Philosophical Transactions of the Royal Society B: Biological Sciences,
490
368(1621):20130119–20130119.
Vitousek, P. M., Mooney, H. A., Lubchenco, J., and Melillo, J. M. (1997). Human Domination of Earth’s Ecosystems. Science, 277(5325):494–499.
Vitousek, P. M., Porder, S., Houlton, B. Z., and Chadwick, O. A. (2010). Terrestrial phosphorus limitation: mechanisms, implications, and nitrogen-phosphorus interactions. Ecological Applications, 20(1):5–15.
495
Vitousek, P. M. and Reiners, W. A. (1975). Ecosystem succession and nutrient retention: a hypothesis. BioScience, 25(6):376–381.
Vitousek, P. M., Walker, L. R., Whiteaker, L. D., and Matson, P. A. (1993). Nutrient limitations to plant growth during primary succession in Hawaii Volcanoes National Park. Biogeochemistry, 23(3):197–215.
Walker, L. R. (1993). Nitrogen fixers and species replacements in primary succession. In Miles, J. and Walton, D. W. H.,
500
editors, Primary Succession on Land, pages 249–272.
Walker, L. R., Clarkson, B. D., Silvester, W. B., and Clarkson, B. R. (2003). Colonization dynamics and facilitative impacts of a nitrogen-fixing shrub in primary succession. Journal of Vegetation Science, 14(2):277–290.
Walker, L. R. and del Moral, R. (2003). Primary Succession and Ecosystem Rehabilitation. Cambridge University Press, Cambridge, UK.
505
Walker, T. W. and Syers, J. K. (1976). The fate of phosphorus during pedogenesis. Geoderma, 15:1–19.
Watt, A. S. (1947). Pattern and process in the plant community. Journal of Ecology, 35(1/2):1–22.
Wilson, S. D. and Tilman, D. (2002). Quadratic variation in old-field species richness along gradients of disturbance and nitrogen. Ecology, 83(2):492–504.
Worley, I. A. (1973). The "black crust" phenomenon in Upper Glacier Bay, Alaska. Northwest Science, 47:20–29.
510
Yachi, S. and Loreau, M. (1999). Biodiversity and ecosystem productivity in a fluctuating environment: The insurance hypothesis. Proceedings of the National Academy of Sciences of the United States of America, 96:1463–1468.
Yeaton, R. I. and Esler, K. J. (1990). The dynamics of a succulent karoo vegetation. Vegetatio, 88(2):103–113.
Zhu, J. and Lynch, J. P. (2004). The contribution of lateral rooting to phosphorus acquisition efficiency in maize (Zea mays) seedlings. Functional Plant Biology, 31(10):949–958.
P
N
λm
F
g
Pg
NB
F
(a)
N
P
P-limited no N-fixation P-limited partial N-fixation co-limited maximal N-fixation N-limited maximal N-fixationN
P
P
N
P
N
decreasing N availability gtotgtot gtot gtot
(b)
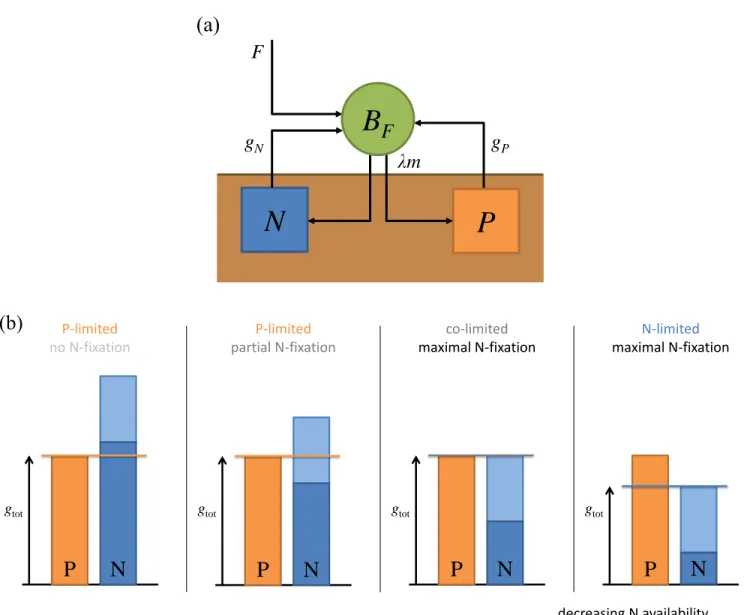
Figure 1: (a) Flow diagram of the model. (b) Schematic representation of how soil P availability (orange), soil N availability (dark blue) and maximal N-fixation (light blue) combine in Liebig’s law to determine the growth gtot, uptake and fixation
rates (black arrow) of facultative N-fixers along a N availability gradient. When soil P is more limiting than soil N, plants are P-limited and fixation is unnecessary (far left). When soil N is more limiting than soil P, there are three possibilities: either maximal fixation rate is large enough for N not to be limiting, leading to P-limitation with partial N-fixation (center left), or maximal fixation is just right to reach colimitation (center right), or fixation is insufficient to overcome N limitation, leading to N-limitation with maximal N-fixation (far right). The mathematical expression of the effective fixation rate associated with these different scenarios can be found in Appendix A.
F
‰
0.0 0.5 1.0 1.5 2.0 0.0 0.2 0.4 0.6 0.8Phosphorus concentration P
Nitrogen
concentration
N
HaL
N-fixing species pool
S
=
HSP
, S
NLB
FHP
`
, N
`
L
Æ
0. 0.25 P* 0.75 1. 1.25 1.5 1.75 2. 0. 0.1 0.2 0.3 0.6 0.7 0.8 N*f N*nfPhosphorus concentration P
Nitrogen
concentration
N
HbL
low N-fixer
S
B
FB
FÈÆ
Æ
0. 0.25 0.5 P* 1. 1.25 1.5 1.75 2. 0. 0.1 0.3 0.6 0.7 0.8 N*f N*nf N*cPhosphorus concentration P
Nitrogen
concentration
N
HcL
high N-fixer
0.0 0.2 0.4 0.6 0.8 -1.0 -0.50.0 0.5 1.0 1.5 2.0 SN BS
B
FÆ
0. 0.25 0.5 0.75 1. 1.25 P* 1.75 2. 0.1 0.2 0.3 0.6 0.7 0.8 N*f N*nf N*cPhosphorus concentration P
Nitrogen
concentration
N
HdL
total N-fixer
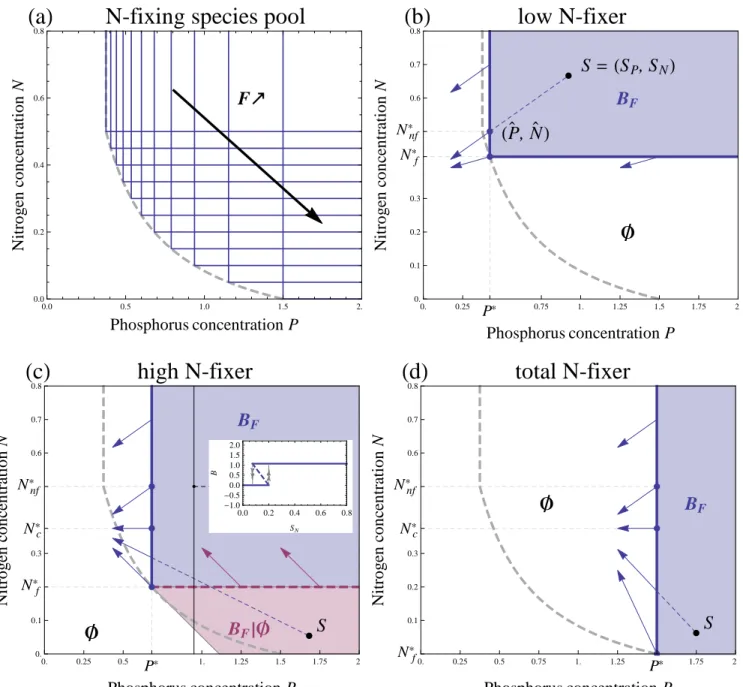
Figure 2: (a) set of ZNGIs (blue, L-shaped) representing the competitive abilities of N-fixers from the species pool with fixation abilities F/m comprised between 0 and 1. The ZNGI corners all line up on a decreasing envelope (dashed grey), which materializes the trade-off between P∗ and Nnf∗ . (b),(c) and (d): Ecological phase diagrams along N and P availabilities for three different N-fixing strategies: low, high and total N-fixer corresponding respectively to F/m = 0.15, 0.6 and 1. The ZNGI (thick, L-shaped), a strategy’s minimal nutrient requirements for growth, also gives the possible nutrient levels at equilibrium, which can be either stable (blue, plain) or unstable (purple, dashed). The impact vectors (blue and purple vectors) correspond to a strategy’s per capita impact on the two nutrients. They point down when the impact on N is negative (consumption), up when it is positive (accumulation). The blue-shaded region (labeled BF) gives
the region of external nutrient supplies S = (SP, SN) (e.g. black dot) under which the N-fixer can subsist, leading to a
vegetated ecosystem. In the white region (labeled ∅), supplies are too low and the N-fixer goes extinct, leading to a bare substrate. The purple-shaded region (labeled BF|∅) has the vegetated ecosystem and the bare substrate as two alternative
stable states. This can be seen in the inset in (c), where the biomass at equilibrium (blue) of these two stable states (plain) and the unstable state that separates them (dashed) have been plotted against a nutrient gradient with increasing SN
Figure 3: Representation of a facilitation-driven successional step in the nutrient (a) and strategy space (b), emerging under low N- and high P-availability, i.e. S = (SP, SN) = (1.8, 0.05). (a) The ZNGIs of two high N-fixing strategies F1and
F2 are superimposed, following the color code of Fig2. F1 is a better N-fixer than F2(F1> F2), but worse P-competitor.
Only F1 can invade the bare substrate (S), the supply point (black dot) being located above the invasion N requirements
of F1 (dashed, purple) but below the ones of F2. As F1establishes, it moves the nutrient levels to R1, where invasion by
F2 is possible. As F2 establishes, it further moves the nutrient levels to R2, competitively excluding F1. As S belongs
in F2 alternative stable state region (purple), F2 can subsist there even after displacing F1. (b) Same successional step
represented on a PIP, picturing the invasion success of an invader (F0) versus a resident state (F and ∅). The resident state can either be the bare substrate (∅), or a previously established strategy with trait F that is globally stable (white, e.g. F1) or sensitive to catastrophic shift because the bare substrate is an alternative stable state (gray, e.g. F2). Some
strategies F are unable to be resident (black). Positive invasion pairs, by an invader F0 in a resident F or ∅, are pictured in blue. F1can invade the bare substrate while F2cannot. After F1 establishes, F2 can invade F1 and displace it, leading
0 10 20 30 40 50 60 70 0.40 0.60 0.80 1.00
Succession time t
Max
.
fixation
rate
F
`
HcL
0 10 20 30 40 50 60 70 0.00 2.00 4.00 6.00 8.00Succession time t
Plant
biomass
B
F`
HdL
0 10 20 30 40 50 60 70 0.50 0.75 1.00 1.25 1.50Succession time t
Soil
phosphorous
P
`
HeL
0 10 20 30 40 50 60 70 0.10 0.15 0.20 0.25 0.30Succession time t
Soil
nitrogen
N
`
HfL
Figure 4: Facilitation-driven succession trajectories, under low N and high P supplies, i.e. S = (SP, SN) = (1.8, 0.05).
All the trajectories were the result of 100 iterations of random colonization attempts from the species pool with equal probability followed by an ecological sorting phase resulting in either 1) extinction of the invader; 2) replacement of the resident by the invader. (a) and (b): same situation as Fig. 3 iterated 100 times. Rapidly, as the trajectory gets close to the ESS, virtually every colonization attempt fails, which explains why only 5 colonizations succeed out of 100. (c), (d), (e) and (f): ecosystem properties dynamics along succession, respectively maximal fixation rate F , biomass ˆBF and soil
nutrient levels ˆP and ˆN . 10 random trajectories are represented (colored, plain) as well as the three quartiles (thick black, median plain; 1st and 3rd quartiles dashed) of the full distribution of probability of the succession process, obtained with
a Markov chain. F and ˆP decrease during succession, while ˆBF and ˆN increase, all of them reaching a climax as we get
close to the ESS. Contrary to competition-driven succession (Fig. 9 in Appendix E), facilitation ensures that ecosystem properties are ‘channeled’ during early succession.
Figure 5: Community-level phase diagram summarizing the different succession scenarios along external nutrient supplies SP and SN. When N and P supplies are too low (white region on the left of the gray curve), not a single strategy can
subsist and the ecosystem stays in the bare substrate state (0). Low N supply (SN < Nc∗) favors high N-fixation rates
with positive net impact on N, which leads to facilitation-driven succession (I). High N supply (SN > Nc∗) favors low
A
Effective fixation rate
In this appendix, we show how the modeling assumptions introduced in the main text on facultative fixation lead to a downregulation of the effective fixation rate, denoted φ, by N and P availabilities. Doing so, we present an alternative — and equivalent — formulation of the plant-soil model that is more explicit towards the amount of nitrogen that is actually fixed by the plant.
520
As a starting point, we recall the two dynamical equations describing N-fixing population biomass BF and soil nitrogen
concentration N :
dBF
dt = [min[gP(P ), gN(N ) + F ] − m] BF (4a) dN
dt = IN − lNN − qNmin[gP(P ), gN(N )]BF + qNλmBF (4b) The idea here is to remember that we assumed both mass balance and fixed stoichiometry qN. Because of this, the effective
fixation rate φ — the rate at which N is actually fixed — is simply equal to the difference between the plant growth rate and the plant N uptake rate, the latter divided by the stoichiometric coefficient qN:
525
φ(P, N ) = min[gP(P ), gN(N ) + F ] − min[gP(P ), gN(N )] (5)
From there, we can use the mathematical identity min(a, b + c) − min(a, b) = max[0, min(a − b, c)] to obtain the more compact expression:
φ(P, N ) = max[0, min[gP(P ) − gN(N ), F ]] (6)
This effective fixation rate φ is represented in Fig. 6 as a function of soil N limitation gP(P ) − gN(N ), and quantifies 530
the fixation mechanism described in Fig. 1b. When P is limiting (gP(P ) − gN(N ) < 0), there is no need to fix and
φ = 0. When N is limiting while the plant fixes at its maximal rate (gP(P ) − gN(N ) > F ), we logically have φ = F .
In the region in-between (0 < gP(P ) − gN(N ) < F ), the plant fixes just the amount needed to reach co-limitation, i.e.
φ = gP(P ) − gN(N ).
To conclude, we have obtained an alternative — and equivalent — way to write the model of eq. (2):
dBF dt = [min[gP(P ), gN(N )] + φ(P, N ) − m] BF (7a) dP dt = IP− lPP − qP[min[gP(P ), gN(N )] + φ(P, N )]BF+ qPλmBF (7b) dN dt = IN− lNN − qNmin[gP(P ), gN(N )]BF+ qNλmBF (7c)
no N-fixation partial N-fixation maximal N-fixation
P-limited P-limited N-limited
-0.6 0 1.2
F
-0.6 0 1.2F
soil N limitation g
PHPL-g
NHNL
Effective
fixation
rate
f
B
Analytical results of the plant-soil model
535
In this appendix, we present the analytical calculations underlying the graphical results of the plant-soil model displayed in the main text. More precisely, we compute the different equilibria of the plant-soil model and analyze the conditions for their stability as functions of phosphorous and nitrogen supplies.
The results presented here hold for general growth functions gX(X) where X = P, N given that they satisfy ∂gX/∂X
and limX→∞gX(X) > m. 540
Equilibria
There are four cases to consider : the bare substrate, which consists in the trivial equilibrium in the absence of plant, and three situations associated with the presence of plants — P-limited non-fixing, P-limited N-fixing and N-limited N-fixing (see Fig. 1b).
545
Bare substrate ∅: This case corresponds to ˆBF = 0. From eq. (2a), it follows that ˆN = SN = IN/lN and ˆP = SP =
IP/lP. This equilibrium always exists; we will see in the next subsection the conditions for its stability.
P-limited non-fixing plant: This case corresponds to the far left panel of Fig. 1b. Formally, the P-limitation without N-fixation for BF corresponds to the constraint gP( ˆP ) < gN( ˆN ) on the nutrient levels at equilibrium. We will identify
later the parameters leading to this condition. Eq. (2a) at equilibrium then gives ˆP = P∗= g−1P (m). ˆBF is then deduced 550
from eq. (2b) and is equal to:
ˆ BF = lP qP SP− P∗ (1 − λ)m (8)
and from eq. (2c) we get:
ˆ
N = SN−
qN
lN
(1 − λ)m ˆBF (9)
Substituting these results in the condition for P-limitation without N-fixation gP( ˆP ) < gN( ˆN ), this condition rewrites 555
ˆ
N > Nnf∗ with Nnf∗ = g−1N (m), or more explicitly γ(SN − Nnf∗ ) > SP − P∗ with γ = lNqP/lP/qN. A last condition for
this equilibrium to exist is ˆBF > 0, which simply translates into SP− P∗> 0.
P-limited N-fixing plant: This case corresponds to the center left panel of Fig. 1b. Formally, the P-limitation with N-fixation for B corresponds to the constraint gN( ˆN ) < gP( ˆP ) < gN( ˆN ) + F on the nutrient levels at equilibrium. Similarly
to the previous case, we get from eq. (2a) that ˆP = P∗= g−1P (m) and ˆBF is equal to: 560 ˆ BF = lP qP SP− P∗ (1 − λ)m (10)
N is now the solution of the implicit equation:
0 = lN(SN − ˆN ) − qP[gN( ˆN ) − λm] ˆBF (11)
There is no explicit analytical solution for a general growth function gN. However, the solution can still be drawn
graphically using the supply point map as was done in the main text.
565
Substituting these results in the condition for P-limitation with N-fixation gN( ˆN ) < gP( ˆP ) < gN( ˆN ) + F , we rewrite
this condition Nnf∗ > ˆN > Nf∗with Nf∗= g−1N (m−F ). To get a more explicit expression of this condition as a function of the parameters of the system, we introduce the parameter β = (1−λ)m/[(1−λ)m−F ]. When F < (1−λ)m, we call the plant a low N-fixer and β > 0. The condition for P-limitation with N-fixation then rewrites βγ(SN−Nf∗) > SP−P∗> γ(SN−Nnf∗ ).
When F > (1 − λ)m, we call the plant a high N-fixer and β < 0. The condition for P-limitation with N-fixation then
570
rewrites SP− P∗ > max[γ(SN − Nnf∗ ), βγ(SN − Nf∗)]. A last condition for this equilibrium to exist is ˆBF > 0, which
always translates into SP − P∗> 0.
Also note that we defined in the main text the threshold Nc∗ in nitrogen concentration under which the N-fixer has a positive impact on soil nitrogen. Formally, it satisfies gN(Nc∗) − λm = 0, which gives Nc∗= g
−1 N (λm).
N-limited N-fixing plant: This case corresponds to the far right panel of Fig. 1b. Formally, the N-limitation with
575
N-fixation for B corresponds to the constraint gN( ˆN ) + F < gP( ˆP ). We get from eq. (2a) that ˆN = Nf∗. ˆBF is then
deduced from eq. (2b) and is equal to:
ˆ BF = lN qN SN − Nf∗ (1 − λ)m − F (12)
and from eq. (2c) we get:
ˆ P = SP− qP lP (1 − λ)m ˆBF (13) 580
Substituting these results in the condition for N-limitation with N-fixation gN( ˆN ) + F < gP( ˆP ), we rewrite this condition
ˆ
P > P∗ or more explicitly SP − P∗ > βγ(SN − Nf∗). A last condition for this equilibrium to exist is ˆBF > 0, which
translates into βγ(SN − Nf∗) > 0, i.e. SN − Nf∗> 0 for low N-fixers and SN− Nf∗< 0 for high N-fixers.
These results can be summarized in the supply plane by counting the different equilibria associated with each supply point (SP, SN). In the case of a low N-fixer (β > 0), the P-limited non-fixing, P-limited N-fixing and N-limited N-fixing 585
supply regions do not overlap and form together the region of plant presence — defined by the overall conditions SP > P∗
and SN > Nf∗. In the case of a high N-fixer (β < 0), the N-limited N-fixing region is included in the P-limited N-fixing
region, which means that these supply points are associated with two possible equilibria with the plant present. We show in the next section that this leads to alternative stable states.