HAL Id: hal-02677816
https://hal.inrae.fr/hal-02677816
Submitted on 31 May 2020
HAL is a multi-disciplinary open access
archive for the deposit and dissemination of
sci-entific research documents, whether they are
pub-lished or not. The documents may come from
teaching and research institutions in France or
abroad, or from public or private research centers.
L’archive ouverte pluridisciplinaire HAL, est
destinée au dépôt et à la diffusion de documents
scientifiques de niveau recherche, publiés ou non,
émanant des établissements d’enseignement et de
recherche français ou étrangers, des laboratoires
publics ou privés.
Synteny perturbations between wheat homoeologous
chromosomes caused by locus duplications and deletions
correlate with recombination rates
E.D. Akhunov, A.R. Akhunova, A.M. Linkiewicz, J. Dubcovsky, D. Hummel,
G.R. Lazo, S. Chao, O.D. Anderson, J. David, Luyuan Qi, et al.
To cite this version:
E.D. Akhunov, A.R. Akhunova, A.M. Linkiewicz, J. Dubcovsky, D. Hummel, et al.. Synteny
perturba-tions between wheat homoeologous chromosomes caused by locus duplicaperturba-tions and deleperturba-tions correlate
with recombination rates. Proceedings of the National Academy of Sciences of the United States of
America , National Academy of Sciences, 2003, 100 (19), pp.10836-10841. �10.1073/pnas.1934431100�.
�hal-02677816�
Synteny perturbations between wheat homoeologous
chromosomes caused by locus duplications and
deletions correlate with recombination rates
Eduard D. Akhunova, Alina R. Akhunovaa, Anna M. Linkiewicza, Jorge Dubcovskya, David Hummelb,c, Gerard R. Lazob,
Shiaoman Chaob,c, Olin D. Andersonb, Jacques Davida,d, Lili Qie, Benjamin Echaliere, Bikram S. Gille, Miftahudinf,
J. Perry Gustafsong, Mauricio La Rotah, Mark E. Sorrellsh, Deshui Zhangi, Henry T. Nguyenf, Venugopal Kalavacharlaj,
Khwaja Hossainj, Shahryar F. Kianianj, Junhua Pengk, Nora L. V. Lapitank, Emily J. Wennerlindl, Vivienne Nduatil,
James A. Andersonl, Deepak Sidhum, Kulvinder S. Gillm, Patrick E. McGuirec, Calvin O. Qualsetc, and Jan Dvoraka,n aDepartment of Agronomy and Range Science andcGenetic Resources Conservation Program, University of California, Davis, CA 95616;bU.S. Department of Agriculture兾Agricultural Research Service, Western Regional Research Center, 800 Buchanan Street, Albany, CA 94710;dUnite´ Mixte de Recherche Diversity and Genome of Crop Plants, Institut National de la Recherche Agronomique, Montpellier, 34130 France;eDepartment of Plant Pathology, Throckmorton Hall, Kansas State University, Manhattan, KS 66506;fDepartment of Agronomy, University of Missouri, Columbia, MO 65211; gU.S. Department of Agriculture兾Agricultural Research Service, University of Missouri, Columbia, MO 65211;hDepartment of Plant Breeding, 252 Emerson Hall, Cornell University, Ithaca, NY 14853;iDepartment of Plant and Soil Science, Texas Tech University, Lubbock, TX 79409;jDepartment of Plant Sciences, Loftsgard Hall, North Dakota State University, Fargo, ND 58105-5051; kDepartment of Soil and Crop Sciences, Colorado State University, Fort Collins, CO 80523;lDepartment of Agronomy and Plant Genetics, University of Minnesota, 422 Borlaug Hall, St. Paul, MN 55108-6026; andmDepartment of Crop and Soil Sciences, P.O. Box 646420, Washington State University, Pullman, WA 99164-6420
Communicated by M. T. Clegg, University of California, Riverside, CA, July 15, 2003 (received for review March 25, 2003)
Loci detected by Southern blot hybridization of 3,977 expressed sequence tag unigenes were mapped into 159 chromosome bins delineated by breakpoints of a series of overlapping deletions. These data were used to assess synteny levels along homoeolo-gous chromosomes of the wheat A, B, and D genomes, in relation to both bin position on the centromere-telomere axis and the gradient of recombination rates along chromosome arms. Synteny level decreased with the distance of a chromosome region from the centromere. It also decreased with an increase in recombination rates along the average chromosome arm. There were twice as many unique loci in the B genome than in the A and D genomes, and synteny levels between the B genome chromosomes and the A and D genome homoeologues were lower than those between the A and D genome homoeologues. These differences among the wheat genomes were attributed to differences in the mating systems of wheat diploid ancestors. Synteny perturbations were characterized in 31 paralogous sets of loci with perturbed synteny. Both insertions and deletions of loci were detected and both prefer-entially occurred in high recombination regions of chromosomes.
H
exaploid wheat Triticum aestivum L. (2n ⫽ 42, genome formula AABBDD) evolved by hybridization of three dip-loid (2n ⫽ 14) species: Triticum urartu Thum ex Gand. (the source of the A genome), Aegilops speltoides Tausch or a closely related species (the source of the B genome), and Aegilopstauschii Coss. (the source of the D genome) (1–4). Each of the
21 wheat chromosomes has been allocated to one of these ancestral genomes and one of seven homoeologous groups (5). Chromosomes within each homoeologous group are related by descent from a chromosome of the ancestor of the Triticum–
Aegilops alliance.
Most wheat cytogenetic stocks, including those on which this article is based, were developed in the genetic background of cultivar Chinese Spring. Classical studies of chromosome pairing in hybrids suggested that the structure of Chinese Spring chro-mosomes closely corresponds to the structure of the chromo-somes of the three wheat ancestors (6). Analyses of C-banded meiotic pairing configurations in hybrids and comparative link-age mapping refined the understanding of Chinese Spring chromosome structure (7–11). These studies revealed that the long arms of chromosomes 4A and 5A, and the short arm of chromosome 7B, were involved in an interchange. Chromosome 4A also suffered paracentic and a pericentric inversions. A
translocation of short terminal segments involving few gene loci differentiated the short arms of chromosomes 2B and 6B. Except for these few changes, the relationships among Chinese Spring homoeologous chromosomes have not been perturbed by major translocations or inversions.
Comparative isozyme and restriction fragment length poly-morphism (RFLP) mapping and studies of homoeologous rela-tionships revealed that chromosome structure has been con-served not only among the wheat genomes but also among genomes of different genera across the tribe Triticeae, where the
Triticum–Aegilops alliance belongs. Each of the diploid tall
wheatgrass (Lophopyrum elongatum A. Lo¨ve, genomes EE) chromosomes or those of the more distantly related barley (Hordeum vulgare L., genomes HH) corresponds to a single-wheat homoeologous group (12–16).
A marked attribute of wheat genomes, and those of wheat diploid relatives in the tribe Triticeae, is the great abundance of duplicated gene loci. One quarter or more of all gene motifs present in these genomes are represented by paralogous sets of loci (16–20). The mechanism by which these duplicated loci have evolved is unknown. It appears, however, that they did not originate by polyploidy (20).
The availability of DNA sequence information for the rice (Oryza sativa L.) genome (www.ncbi.nlm.nih.gov) and deletion map position of a large number of wheat loci detected by EST unigenes (wheat.pw.usda.gov兾NSF兾progress㛭mapping.html) made it possible to obtain a detailed picture of homoeologous relationships between wheat and rice chromosomes (21). This information was used to determine, for 40 paralogous sets of wheat loci, which locus was ancestral and which was derived from it by duplication (20). Duplication-derived loci were most often located in the distal regions of wheat chromosomes, and their distribution was positively correlated with the gradient of re-combination rate along the average wheat chromosome arm that increases with the square of the distance of a chromosomal region from the centromere (20, 22).
The set of gene loci located on a wheat chromosome consti-tutes a syntenic group of that chromosome. A structural change,
Abbreviation: RFLP, restriction fragment length polymorphism.
nTo whom correspondence should be addressed. E-mail: jdvorak@ucdavis.edu.
such as a translocation, reduces the length of the syntenic group that the chromosome shares with a homoeologous chromosome. In contrast, deletions or insertions of individual loci, while not affecting the lengths of the syntenic groups shared by homoe-ologous chromosomes, affect the proportion of loci within shared syntenic groups having orthologues on both chromo-somes. This proportion will be referred to as the synteny level, or briefly synteny, between homoeologous chromosomes. It will be assumed that the lengths of syntenic groups shared by wheat homoeologous chromosomes are equivalent to the lengths of the chromosomes. The structurally altered chromosome 4A, the short arm of chromosome 7B, and the long arm of chromosome 5A, all having a shortened syntenic group, were excluded from the analyses.
An insertion of a duplicated gene changes the level of synteny of the chromosome with its homoeologues. Because the distri-bution of duplication-derived loci is positively correlated with recombination rates along wheat chromosome arms, the level of synteny between homoeologous chromosomes should decline from proximal, low-recombination regions to distal high-recombination regions. This pattern was demonstrated between rice chromosome 1 and wheat chromosome 3B, which are homoeologous. Because of the great evolutionary distance be-tween wheat and rice, comparisons of wheat and rice homoe-ologous chromosomes are intrinsically uncertain, because it cannot be excluded that the lengths of compared syntenic groups were not shortened by undetected translocations. Because these uncertainties are largely absent from comparisons among wheat homoeologous chromosomes, we elected to test this hypothesis with wheat homoeologous chromosomes. Synteny levels along chromosome arms of homoeologous chromosomes were quan-tified, and the correlation between synteny level and recombi-nation rate was assessed. To obtain a detailed insight into the causes of synteny perturbations in wheat, the following charac-teristics were determined for 31 paralogous sets with perturbed synteny: (i) whether the cause of perturbed synteny was a duplication or deletion event; (ii) whether the duplication or deletion occurred in wheat or its diploid ancestors; (iii) whether a locus showing perturbed synteny was located in a high- or low-recombination region; (iv) which locus of a paralogous set was ancestral and which was derived; and (v) whether perturbed synteny involved an ancestral or derived locus.
Materials and Methods
ESTs and Their Mapping.From 1,000 to 11,000 clones were
ran-domly selected from each of 41 cDNA libraries comprising most organs and developmental phases of the wheat plant. At the time of this analysis,⬇460 base pairs each of 80,000 cDNA clones had been sequenced and deposited in GenBank (www.ncbi.nlm.nih. gov). ESTs, their characteristics, and mapping status can be viewed at http:兾兾wheat.pw.usda.gov兾NSF兾progress㛭est.html.
A total of 101 deletion stocks, each containing one or several deletions, 24 ditelosomic stocks, and 21 nullisomic-tetrasomic stocks, all in the Chinese Spring genetic background, were used in mapping of loci detected by EST unigenes (23). The series of deletion breakpoints along chromosome arms defined physical regions called bins (23). DNA isolation from these stocks, the Southern hybridization of them, and subsequent analyses have been described (20, 23).
Recombination Rate.Recombination rates, expressed as
coeffi-cients of exchange (CEs, cM兾Mb) (24), were derived from estimates of genetic lengths of bins in centimorgans (cM) divided by estimates of bin lengths in megabases (Mb). The estimation of genetic lengths and lengths in Mb of bins has been described (20). As in ref. 20, the relative distance of deletion breakpoints along the nucleolar organizing region (NOR) bearing chromo-some arms 1BS and 6BS, as specified in http:兾兾wheat.pw.usda.
gov兾west兾binmaps, were recalculated so that the satellites were included within the arms. Individual CE estimates were likely burdened by a sizable experimental error rate due to variation in determination of deletion breakpoints and linkage. We there-fore grouped the 156 bins according to the relative physical distance of bin midpoint from the centromere into six equal intervals, and computed a mean CE for each interval. The coefficients of variation of these six means ranged from 0.5 to 1.3. Using these six mean CEs in correlation analyses reported here not only reduced the effect of variation due to measurement error but also averaged chromosome-arm specific recombination patterns, such as local recombination minima and maxima caused by recombination hotspots and crossover interference, differences in recombination rate gradients along chromosome arms because of arm lengths (22), heterochromatin (25), NOR loci (26), and other factors, across all 42 wheat chromosome arms.
Assessment of Synteny Level Between Homoeologous Chromosomes.
The wEST-SQL database of 3,977 EST unigenes (http:兾兾 wheat.pw.usda.gov兾cgi-bin兾westsql兾westsql.cgi) was queried by using a script that extracted those EST unigenes for which all restriction fragments hybridizing with an EST unigene were mapped. This query produced a total of 1,059 EST unigenes. For each of these EST unigenes, the autoradiograms (http:兾兾 wheat.pw.usda.gov兾cgi-bin兾westsql兾map㛭locus.cgi) were exam-ined to verify that no spurious artifacts and unmapped fragments were present. A total of 845 EST unigenes were retained for the assessment of synteny among the homoeologous chromosomes of the three wheat genomes. All analyses were done on a locus basis. If several restriction fragments within a bin hybridized with a single clone, it was assumed that a single locus was within the bin, because the number of loci detected by a clone within a bin could not be determined.
The deletion lines used for locus mapping were isolated in progenies of plants with a gametocidal chromosome, which introduces breaks into chromosomes (27). It is conceivable that the gametocidal chromosome could cause also small, cytologi-cally undetectable deletions that would perturb synteny among deletion lines. Restriction profiles of deletion lines were there-fore always compared with those of Chinese Spring ditelosomic and nullisomic-tetrasomic lines that were hybridized simulta-neously with the deletion lines (23). Only synteny perturbations that were monomorphic in these lines were considered in analyses reported here.
There are two possible directions in which synteny level (S) between a pair of homoeologous chromosomes can be examined. Assume that loci mapped on an A genome chromosome are used as the basis for synteny assessment. In this case, synteny SB/Ais
defined as the probability that there is a B genome orthologue for a locus on the A genome chromosome. In the opposite direction, the loci mapped on the B genome chromosome are used as the basis for synteny assessment. Synteny, SA/B, is then
defined as the probability that there is an A genome orthologue for a locus on the B genome chromosome.
The following strategy was used to estimate synteny levels along chromosome arms. Synteny SB/A will be used as an
example. The centromere-telomere axis, on which the centro-mere is at 0.00 and the telocentro-mere is at 1.00, was divided into six equal intervals, each 0.17 of the relative arm length. Bins along each A genome chromosome (the rearranged chromosome 4A was excluded) were allocated into these six intervals on the basis of the position of bin midpoint on the centromere-telomere axis. The level of synteny in the ith interval (Si,B/A) is defined as
Si,B兾A⫽Nni
i,
Akhunov et al. PNAS 兩 September 16, 2003 兩 vol. 100 兩 no. 19 兩 10837
where Niis the total number of loci in the ith interval in the A
genome, and niis the number of loci in the B genome that are
orthologous to these loci. The arithmetic mean (SB/A) of the six
Si,B/As was used as the measure of total level of synteny between
the A and B genomes. Statistical significance of differences between S values was tested by paired t test using the six paired
Sis as variables.
Relationship Between Synteny and Recombination Rate.For
statis-tical analyses, estimates in which the same genome was used as the basis of synteny level assessment; e.g., Si,B/Aand Si,D/A, were
averaged (Si,B⫹D/A). The three possible mean synteny level
estimates in the ith interval were designated Si,B⫹D/A, Si,A⫹D/B,
and Si,A⫹B/D. The Pearson correlation coefficients (r) of mean
synteny level and recombination rates along the average chro-mosome arm were computed. The probability that an r equals zero was determined from statistical tables using 4 degrees of freedom.
Characterization of 31 Paralogous Sets with Incomplete Synteny.The
population of 845 EST unigenes was used to find those that detected loci with perturbed synteny in the wheat genomes, i.e., the absence of a locus in one or two of the three wheat homoeologous chromosomes. After verification of mapping results, 31 EST unigenes were chosen for further study (for a list of these 31 clones, see Table 3, which is published as supporting information on the PNAS web site, www.pnas.org). They were hybridized with Southern blots of EcoRI-digested DNAs of 19 L.
elongatum (E genome) disomic substitution (DS) lines (12, 28,
29) and 6 disomic addition (DA) lines of Betzes barley chromo-somes (H genome) in the Chinese Spring genetic background (30), and Betzes barley. Disomic substitution lines 4E(4B) and 5E(5A) and DA1H line were not available.
Loci located on homoeologous chromosomes in wheat, L.
elongatum, or barley were assumed to be orthologous. In wheat
paralogous sets containing two or more loci, the wheat locus that had an orthologue in L. elongatum or barley was assumed to be the ancestral locus and the locus (or loci), which did not have an orthologue either in L. elongatum or barley was assumed to have been derived by duplication during the radiation of the Triticum–
Aegilops alliance. When there were three (or more) loci within
wheat genomes, and two of them were detected in the L.
elongatum and barley genomes, then it was concluded that the
latter two loci were ancestral and the third locus (and additional loci) was derived by duplication.
If a locus was detected only on one or two of the three wheat homoeologues, but was on the L. elongatum or barley homoeo-logues, a deletion that occurred during the radiation of the
Triticum–Aegilops alliance, or during polyploid wheat evolution,
was assumed to be the most likely cause of incomplete synteny of the locus in wheat. If a locus was detected only on one or two of the three wheat homoeologues, but was not detected on the
L. elongatum and barley homoeologues, a duplication that
occurred either during the radiation of the Triticum–Aegilops alliance or during polyploid wheat evolution was the most likely cause of incomplete synteny of the locus in wheat.
To determine whether synteny of loci detected by an EST unigene was perturbed at the diploid level or polyploid level, each clone was hybridized with Southern blots of DNAs of nine lines of T. urartu, nine lines of Ae. speltoides, and seven lines of
Ae. tauschii (for a description of the lines see Table 4, which is
published as supporting information on the PNAS web site) digested with EcoRI, and restriction fragments were allocated to loci. Consider first a case in which it had been assumed that incomplete synteny was caused by a deletion. If a locus absent from a wheat genome was present in the diploid ancestor of that genome, it was assumed that the deletion occurred at the polyploid level. If the locus was absent both from the wheat
genome and that of the diploid ancestor, then it was assumed that the deletion occurred at the diploid level. Consider now a case in which it had been assumed that incomplete synteny was caused by a duplication. If the duplicated locus was present in the diploid ancestor of the genome, the duplication was assumed to have occurred at the diploid level. If the duplicated locus was absent from the genome of the diploid ancestor, it was assumed that the duplication occurred at the polyploid level. This last inference assumed that the duplicated locus was not deleted from the diploid ancestor prior to the origin of polyploid wheat.
It has previously been shown that the recombination rate is low in the proximal two-thirds, and it rapidly increases in the distal one-third of the average chromosome arm (20). This division into the proximal two-thirds and distal one-third was used as an arbitrary division of the average chromosome arm into low-recombination and high-recombination regions. The ancestral loci and locus duplications and deletions were grouped according to their locations into these two intervals.
The randomness of the distribution of duplicated and deleted loci was statistically tested as follows: Akhunov et al. (20) used the distribution of restriction fragments detected by 730 EST unigenes as an estimate of gene distribution along wheat chro-mosome arms. From 2,743 restriction fragments, 51% were in the proximal two-thirds of the chromosome arms and 49% were in the distal one-third of the chromosome arms, which is a ratio of⬇1:1. The homogeneity of loci in the two intervals was tested by2test or by Fisher’s exact test, using a 1:1 ratio as the null hypothesis.
Results
Mean Synteny Levels. Mean synteny estimates based on loci
mapped in the B genome (SA/Band SD/B) were 0.91 (n⫽ 686,
n⫽ 624) and 0.92 (n ⫽ 686, n ⫽ 633), respectively (for data, see Table 5, which is published as supporting information on the PNAS web site). These two estimates were significantly lower (P values ranged from 0.008 to 0.07) than the estimates based on loci mapped in the A genome, SB/A⫽ 0.95 (n ⫽ 593, n ⫽ 564)
and SD/A⫽ 0.96 (n ⫽ 593, n ⫽ 569), or the estimates based on
loci mapped in the D genome, SA/D⫽ 0.94 (n ⫽ 746, n ⫽ 702)
and SB/D⫽ 0.96 (n ⫽ 746, n ⫽ 713). The latter four estimates did
not significantly differ from each other.
Genome-Unique Loci.Of the total numbers of 593, 686, and 746
loci mapped in the A, B, and D genomes, 13 (2.2%), 41 (6.0%), and 19 (2.5%) loci were unique to the A, B, and D genomes, respectively. In the B genome, 21 unique loci were in the proximal two-thirds (low-recombination interval) and 20 were in the distal one-third (high-recombination interval). In the A and D genomes, there were 6 and 5 unique loci in the low-recombination interval and 7 and 14 in the high-low-recombination interval, respectively.
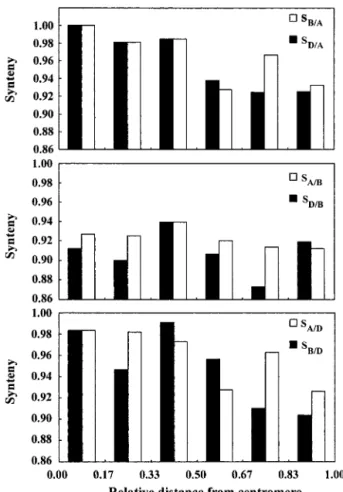
Correlation Between Synteny Levels and Recombination Rates Along Chromosome Arms. Si,B/Aand Si,D/Asynteny decreased from the
proximal to the distal interval along the six intervals of the average chromosome arm (Fig. 1A; for data see Table 5). Synteny Si,A/Dand Si,B/Dfollowed the same trend (Fig. 1C). In
contrast, Si,A/Band Si,D/Bsynteny changed little on the
centro-mere-telomere axis (Fig. 1B). All six synteny profiles along the average chromosome arm showed disproportionately high levels of synteny in the third intervals from the centromere (Fig. 1). Whether interstitial recombination minima present in some wheat chromosome arms or another cause was responsible for this variation could not be determined.
Both Si,B⫹D/Aand Si,A⫹B/Dsynteny were negatively correlated (P⫽ 0.04 and 0.01, respectively) with recombination rates along chromosome arms (Table 1). In contrast, correlation of Si,A⫹D/B synteny with recombination rate was not statistically significant,
although also being negative (Table 1). Similar relationships were observed between the level of synteny and the location of an interval on the centromere-telomere axis (Table 1).
Characterization of 31 Paralogous Sets with Perturbed Synteny.The
strategy used to infer which locus was ancestral, which was derived, and whether synteny was perturbed at the diploid level or polyploid level is illustrated in Fig. 2. Hybridization of clone WHE0825–0828㛭L16㛭L16 with Southern blots of DNAs of L.
elongatum DS lines indicated that this EST unigene detected a
single locus in the wheat B and D genomes, but detected four loci in the A genome. In the A genome, loci were detected on chromosomes 1A, 2A, 4A, and 6A. The clone detected a locus only on chromosome 1E in the L. elongatum genome. Therefore, the locus in homoeologous group 1 is the ancestral locus of this paralogous set, whereas the loci on 2A, 4A, and 6A are dupli-cation derived. The absence of any additional restriction
frag-ment in the profiles of the six barley DA lines was consistent with this conclusion, but direct evidence was not available because DA1H was missing from the set. Betzes barley showed a single restriction fragment, indicating that there was a single locus hybridizing with this clone in barley (data not shown). All six wheat loci were found in the genomes of wheat ancestors. Whereas only one locus each was present in the Ae. speltoides and
Ae. tauschii genomes, four loci were found in each line of T. urartu, suggesting that all duplicated loci originated in the T. urartu phylogenetic lineage.
By using this strategy, it was possible to determine which locus was ancestral and which was derived, for 29 of 31 investigated paralogous sets. In two sets, duplication occurred before the divergence of Triticeae, and an ancestral locus could not be identified; we therefore concluded that each of these sets had two ancestral loci. Of these 33 ancestral loci, 16 were located in the proximal two-thirds of chromosome arms (the low-recombination interval) and 17 were located in the distal one-third of chromosome arms (the high-recombination interval). The frequencies of ancestral loci in the two intervals did not significantly differ (P⫽ 0.73) from the 1:1 ratio of all loci in these two intervals.
A total of 33 loci at which synteny was perturbed were characterized (Table 2). Twenty-three were caused by duplica-tions and 10 were caused by deleduplica-tions of loci. Four of the 10 deleted loci were duplication derived, 4 were ancestral loci, and for 2 the status was unknown. All four deleted ancestral loci were located in the distal interval. Twenty-five of these events orig-inated at the diploid level and 8 (24%) origorig-inated at the polyploid level.
Of the 33 loci at which synteny was perturbed, 7 were located in the proximal two-thirds of the average chromosome arm, and 26 were located in the distal one-third of the average chromo-some arm. The frequencies of loci in these two intervals signif-icantly differed from the 1:1 distribution of loci in these intervals (P⫽ 0.001).
Of the 25 synteny perturbations that occurred during the evolution of wheat diploid ancestors, six were in the proximal two-thirds of the average chromosome arm and 19 were in the distal one-third of the average chromosome arm. Eighteen of these synteny perturbations were monomorphic among the nine lines of T. urartu or seven lines of Ae. tauschii, depending on the genome location of locus at which synteny was perturbed in Chinese Spring wheat. As illustrated in Fig. 2, sufficient numbers of T. urartu and Ae. tauschii restriction fragments were shared with profiles of Chinese Spring so that they could be allocated to loci in these species on the basis of deletion mapping in Chinese Spring. In contrast, very few Ae. speltoides restriction fragments were shared with Chinese Spring. This fact and frequent variation for number of restriction fragments present among the nine lines often precluded unequivocal allocation of restriction fragments to loci. Therefore, homogeneity of the distribution of loci at which synteny was perturbed at the diploid level was statistically tested only in T. urartu and Ae. tauschii. Of 18 loci, 2 were in the proximal two-thirds of the average chromosome arm, and 16 were in the distal one-third of the average chromosome arm, which significantly differed from the 1:1 frequency of loci in these two intervals (Fisher’s exact test,
P⫽ 0.015).
Discussion
Analyses of the presence and absence of orthologous loci detected by 845 EST unigenes in wheat homoeologous somes revealed that synteny between homoeologous chromo-somes has been perturbed by frequent insertions and deletions of loci. Although the perturbations were discovered in polyploid wheat, the characterization of 31 paralogous sets with perturbed
Fig. 1. Synteny (S) along the average chromosome arm. The distance of an interval from the centromere is expressed as a fraction of the average chro-mosome arm length. The centromere of the average chrochro-mosome arm is at 0.00, and the telomere is at 1.00.
Table 1. Correlation (r) between synteny, recombination rate, and relative distance of an interval from the centromere
Synteny r Recombination rate Relative distance from centromere Si,B⫹D兾A ⫺0.82 (0.04)* ⫺0.91 (0.01) Si,A⫹D兾B ⫺0.41 (0.42) ⫺0.38 (0.46) Si,A⫹B兾D ⫺0.93 (0.01) ⫺0.91 (0.01)
*P values are in parentheses.
Akhunov et al. PNAS 兩 September 16, 2003 兩 vol. 100 兩 no. 19 兩 10839
synteny indicated that 75% of these perturbations actually occurred during the evolution of wheat diploid ancestors.
Synteny perturbations were not equal among the three ge-nomes. Whereas 8–9% of the B genome loci defied syntenic relations, only 4–6% of the A and D genome loci defied syntenic relations. A greater differentiation of the B genome chromo-somes from their A and D genome homoeologues, than that of the A and D genome chromosomes from each other, is inversely related to the levels of chiasmate metaphase I (MI) pairing between wheat homoeologues in the absence of the Ph1 locus. MI pairing between the A and D genome homoeologues was higher than that between the A and B or D and B genome homoeologues (31). This relationship suggests an intriguing possibility that there may be a link between chromosome dif-ferentiation described here and MI chiasmate pairing between homoeologous chromosomes.
It was shown earlier that duplication-derived loci accumulated preferentially in distal, high-recombination regions of wheat chromosomes (20). Because an insertion of a duplicated gene or gene fragment creates a unique locus, it was hypothesized that the level of synteny between wheat homoeologous chromosomes should be lower in distal, high-recombination regions than in proximal, low-recombination regions. The level of synteny was found here to correlate negatively with interval distance from the centromere and recombination rate along homoeologous chromosome arms, which was consistent with this hypothesis.
However, the correlations were strong and statistically signifi-cant, only when loci mapped in the A and D genomes were used as the basis of synteny assessments (Si,B/A, Si,D/A, Si,A/D, and Si,B/D
synteny). They were weak and not significant when loci mapped in the B genome were used as the basis of synteny assessment (Si,A/Band Si,D/Bsynteny). However, it does not mean that synteny
is decaying evenly along the B genome chromosomes. Employing a longer evolutionary time scale, steep synteny gradients were observed in both chromosome arms between wheat chromosome 3B and rice chromosome 1 (20), which is homoeologous with 3B (21).
We offer the following explanation of the B genome anomaly based on a parallel between synteny levels along chromosome arms and Nei’s gene diversity measured by RFLP along chro-mosome arms. The wheat B genome was most likely contributed by Ae. speltoides or its extinct ancestor (refs. 5, 32, and 33; for review, see ref. 34). The ratio of Nei’s gene diversity in distal, high-recombination regions to that in proximal, low-recombina-tion regions (Hd兾Hp) was 1.3 in Ae. speltoides, but was 2.6 in T.
urartu and 2.2 in Ae. tauchii (35, 36). This difference was largely
caused by a disproportionately greater value for Nei’s gene diversity in the proximal, low-recombination region in Ae.
speltoides than that in T. urartu and Ae. tauschii. In parallel, the Si,A/Band Si,D/Bsynteny gradients were less steep than the Si,B/A,
Si,D/A, Si,A/D, and Si,B/Dsynteny gradients. This result was caused
by disproportionately lower Si,A/Band Si,D/Bsynteny in proximal,
Fig. 2. Southern blot hybridization of cDNA clone WHE0825– 0828㛭L16㛭L16 with EcoRI-digested genomic DNA of Chinese Spring (CS), L. elongatum (E genome) disomic substitution lines in Chinese Spring, disomic addition lines of barley (H genome) chromosomes in Chinese Spring and lines of T. urartu (lanes 1–9), Ae. tauschii (lanes 10 –16), and Ae. speltoides (lanes 17–25). In the designations of disomic substitution lines, the wheat chromosome replaced by its L. elongatum homoeologue is indicated in parentheses. The chromosomal locations of the restriction fragments are shown on the left. The four A-genome loci found in wheat were found in the T. urartu genome, whereas only one locus each was found in the genomes of Ae. tauschii and Ae. speltoides. Restriction fragments shared by Chinese Spring D and B genomes and Ae. tauschii and Ae. speltoides, respectively, are marked by arrows.
Table 2. Ploidy level and interval in which events perturbing synteny in 31 paralogous sets occurred
Event
No. assigned to a chromosome
Ploidy level Interval (diploid level)* Interval (polyploid level)* Diploid Polyploid Low recombination High recombination Low recombination High recombination
Duplication 23 19 4 6 13 1 3
Deletion 10 6 4 0 6 0 4
Total 33 25 8 6 19 1 7
*Low-recombination interval is defined as the proximal two-thirds of the average chromosome arm, and high-recombination interval is defined as the distal one-third of the average chromosome arm.
low-recombination regions than Si,B/A, Si,D/A, Si,A/D, and Si,B/D
synteny in these regions (Fig. 1). There were three to four times as many unique loci in the proximal, low-recombination interval in the B genome than in the A and D genomes.
In Aegilops and Triticum, RFLP gradients along chromosome arms are related to recombination rate gradients along chromo-some arms, possibly reflecting the strength of indirect selection along chromosome arms (35). Indirect selection (hitchhiking and background selection) reduces the effective population size in the vicinity of a selected locus (37, 38). Variation in recombination rates along a chromosome arm causes variation in the strength of indirect selection on neutral loci linked to selected loci. Hence, the levels of neutral polymorphism, such as RFLP, are more effectively reduced in low-recombination regions than in high-recombination regions. Because self-pollination reduces the magnitude of recombination per generation, in addition to reducing the effective population size, low recombination was likely also the principal cause of lower Nei’s gene diversity (H) measured by RFLP in the self-pollinating T.
urartu and Ae. tauschii, as compared with the crosspollinating Ae. speltoides (35). It is therefore likely that differences in S, and in Si
gradients along the average chromosome arm in the B genome, as compared with the A and D genomes, reflect differences in the mating system of the ancestors of these genomes, and that synteny and RFLP are related because both are affected by the same factor; i.e., the recombination rate.
The inverse relationship between the level of synteny and re-combination rate could therefore be caused by weaker indirect selection in the high-recombination regions as compared with low-recombination regions of chromosomes. Indirect selection may eliminate some of the gene insertions from low-recombination regions of chromosomes when they are in the polymorphic state. The persistence of polymorphisms for locus duplication in high-recombination regions may enhance an opportunity for the evolu-tion of genes with new funcevolu-tions that could then be fixed due to positive selection. The ultimate result of these processes would be
a faster loss of synteny in the high-recombination regions of genomes than in low-recombination regions.
Alternatively, the inverse relationship between synteny level and recombination rate could be attributed to preferential transposition of genes and gene fragments into chromosome regions with high homoeologous recombination rates. This possibility has been discussed in ref. 20, where it was pointed out that experimental observations are inconsistent with this assumption.
In a paralogous set composed of one ancestral and one duplication-derived locus, either locus can theoretically be de-leted. Deletions detected here involved equal numbers of an-cestral and duplication-derived loci; however, all deleted ances-tral loci were located in high-recombination regions of chromosomes. The colocation of duplication-derived loci and locus deletions predisposes duplication-derived loci to deletion in chromosomes with distinct recombination gradients, unless a duplicated locus is favored by natural selection. In species with steep recombination gradients along chromosome arms, partic-ularly in the lineages of self-pollinating species, this colocation of duplications and deletions in the same regions results in higher net gene turnover in distal, high-recombination regions than in proximal, low-recombination regions.
This article suggests the following genome evolution trends in the Triticum–Aegilops alliance. High-recombination regions of homoeologous chromosomes lose synteny faster than do low-recombination regions, and self-pollination magnifies this dis-parity. If everything else is equal, homoeologous chromosomes of crosspollinating species lose synteny faster than do homoe-ologous chromosomes of their self-pollinating relatives. This trend effectively causes differences in the rates of genome differentiation between closely related self- and crosspollinating lineages. We suggest that variation in recombination rates is the causal agent in these trends.
This work was supported by National Science Foundation Plant Genome Research Program Cooperative Agreement DBI-9975989.
1. Kihara, H. (1944) Agric. Hortic. 19, 13–14.
2. McFadden, E. S. & Sears, E. R. (1946) J. Hered. 37, 81–89, 107–116. 3. Sarkar, P. & Stebbins, G. L. (1956) Am. J. Bot. 43, 297–304.
4. Dvorak, J., di Terlizzi, P., Zhang, H. B. & Resta, P. (1993) Genome 36, 21–31. 5. Sears, E. R. (1966) in Chromosome Manipulations and Plant Genetics, eds.
Riley, R. & Lewis, K. R. (Oliver & Boyd, Edinburgh), pp. 29–44. 6. Kimber, G. & Riley, R. (1963) Can. J. Genet. Cytol. 5, 83–88.
7. Naranjo, T., Roca, A., Goicoechea, P. G. & Giraldez, R. (1987) Genome 29, 873–882.
8. Gale, M. D., Atkinson, M. D., Chinoy, C. N., Harcourt, R. L., Jia, J., Li, Q. Y. & Devos, K. M. (1993) in Proceedings of the 8th International Wheat Genetics Symposium, eds. Li, Z. S. & Xin, Z. Y. (China Agricultural Scientech Press, Beijing), Vol. 1, pp. 29–40.
9. Devos, K. M., Dubcovsky, J., Dvorak, J., Chinoy, C. N. & Gale, M. D. (1995) Theor. Appl. Genet. 91, 282–288.
10. Mickelson-Young, L., Endo, T. R. & Gill, B. S. (1995) Theor. Appl. Genet. 90, 1007–1011.
11. Devos, K. M., Millan, T. & Gale, M. D. (1993) Theor. Appl. Genet. 85, 784–792. 12. Dvorak, J. (1980) Can. J. Genet. Cytol. 22, 237–259.
13. Hart, G. E. & Tuleen, N. A. (1983) Genet. Res. 41, 181–202.
14. Hart, G. (1995) in Methods of Genome Analysis in Plants, ed. Jauhar, P. P. (CRC, Boca Raton, FL), pp. 195–209.
15. Dvorak, J., McGuire, P. E. & Mendlinger, S. (1986) Plant Syst. Evol. 144, 209–220. 16. Dubcovsky, J., Luo, M. C., Zhong, G. Y., Bransteitter, R., Desai, A., Kilian, A.,
Kleinhofs, A. & Dvorak, J. (1996) Genetics 143, 983–999.
17. Graner, A., Jahoor, A., Schondelmeier, J., Siedler, H., Pillen, K., Fischbeck, G., Wenzel, G. & Herrman, R. G. (1991) Theor. Appl. Genet. 83, 250–256. 18. Anderson, J. A., Ogihara, Y., Sorrells, M. E. & Tanksley, S. D. (1992) Theor.
Appl. Genet. 83, 1035–1043.
19. Kleinhofs, A., Kilian, A., Maroof, M. A. S., Biyashev, R. M., Hayes, P., Chen,
F. Q., Lapitan, N., Fenwick, A., Blake, T. K., Kanazin, V., et al. (1993) Theor. Appl. Genet. 86, 705–712.
20. Akhunov, E. D., Goodyear, J. A., Geng, S., Qi, L.-L., Echalier, B., Gill, B. S., Miftahudin, Gustafson, J. P., Lazo, G., Chao, S., et al. (2003) Genome Res. 13, 753–763.
21. Sorrells, M. E., La Rota, C. M., Bermudez-Kandianis, C. E., Greene, R. A., Kantety, R., Munkvold, J. D., Miftahudin, Mahmoud, A., Gustafson, J. P., Qi, L., et al. (2003) Genome Res. 13, 1818–1827.
22. Lukaszewski, A. J. & Curtis, C. A. (1993) Theor. Appl. Genet. 84, 121–127. 23. Qi, L., Echalier, B., Friebe, B. & Gill, B. S. (2003) Funct. Integr. Genomics 3, 39–55. 24. Lindsley, D. L. & Sandler, L. (1977) Philos. Trans. R. Soc. London B 277,
295–312.
25. John, B. & Miklos, G. L. G. (1979) Int. Rev. Cytol. 58, 1–114. 26. Luo, M. C., Yang, Z. L. & Dvorak, J. (1998) Genetics 145, 1105–1113. 27. Endo, T. R. (1988) J. Hered. 79, 366–370.
28. Dvorak, J. & Chen, K. C. (1984) Can. J. Genet. Cytol. 26, 128–132. 29. Tuleen, N. A. & Hart, G. E. (1988) Genome 30, 519–524.
30. Islam, A. K. M. R., Shepherd, K. W. & Sparrow, D. H. B. (1981) Heredity 46, 161–174.
31. Naranjo, T. (1992) Hereditas 116, 219–223.
32. Dvorak, J. & Zhang, H. B. (1990) Proc. Natl. Acad. Sci. USA 87, 9640–9644. 33. Wang, G.-Z., Miyashita, N. & Tsunewaki, K. (1997) Proc. Natl. Acad. Sci. USA
94,14570–14577.
34. Dvorak, J. (1998) in Proceedings of the 9th International Wheat Genetics Symposium, ed. Slinkard, A. E. (University Extension Press, Univ. of Saskatchewan, Saskatoon, SK, Canada), Vol. 1, pp. 8–11.
35. Dvorak, J., Luo, M.-C. & Yang, Z.-L. (1998) Genetics 148, 423–434. 36. Dvorak, J., Yang, Z.-L. & Luo, M.-C. (1999) in 7th International Plant and
Animal Genome Conference, ed. Heller, S. R. (Scherago International, San Diego), pp. P420.
37. Maynard Smith, J. & Haigh, J. (1974) Genet. Res. 23, 23–35. 38. Charlesworth, B. (1994) Genet. Res. 63, 213–227.
Akhunov et al. PNAS 兩 September 16, 2003 兩 vol. 100 兩 no. 19 兩 10841