HAL Id: inserm-00183861
https://www.hal.inserm.fr/inserm-00183861
Submitted on 30 Oct 2007HAL is a multi-disciplinary open access archive for the deposit and dissemination of sci-entific research documents, whether they are pub-lished or not. The documents may come from teaching and research institutions in France or abroad, or from public or private research centers.
L’archive ouverte pluridisciplinaire HAL, est destinée au dépôt et à la diffusion de documents scientifiques de niveau recherche, publiés ou non, émanant des établissements d’enseignement et de recherche français ou étrangers, des laboratoires publics ou privés.
Optimization of intravascular brachytherapy treatment
planning in peripheral arteries.
Zhengdong Zhou, Pascal Haigron, Huazhong Shu, Wenxue Yu, Cécile Moisan,
Jean-Pierre Manens, Antoine Lucas, Limin Luo
To cite this version:
Zhengdong Zhou, Pascal Haigron, Huazhong Shu, Wenxue Yu, Cécile Moisan, et al.. Optimization of intravascular brachytherapy treatment planning in peripheral arteries.. Computerized Medical Imag-ing and Graphics, Elsevier, 2007, 31 (6), pp.401-7. �10.1016/j.compmedimag.2007.03.001�. �inserm-00183861�
Optimization of intravascular brachytherapy treatment planning in peripheral arteries
Zhengdong Zhou 1,7, Pascal Haigron2,3, Huazhong Shu1,4, Wenxue Yu1, Cécile Moisan2,3,6, Jean-Pierre
Manens5, Antoine Lucas2,3,6, Limin Luo1,4
1LIST, Department of Computer Science and Engineering, Southeast University, 210096 Nanjing,
China;
2 INSERM, U642, Rennes, F-35000, France;
3 Université de Rennes 1, LTSI, Rennes, F-35000, France;
4 Centre de Recherche en Information Biomédicale Sino-Français, CRIBs 5CRLCC, Eugène Marquis, Rennes, F-35000, France;
6 CHU Rennes, Service de Chirurgie Vasculaire, Rennes, F-35000, France; 7 Department of Medical Physics, Nanjing University of Aeronautics and Astronautics, 210016
Nanjing, China.
Abstract. This work deals with the treatment planning optimization for intravascular brachytherapy (IVB) in peripheral arteries. The objective is both to quantitatively study the validity of different hypotheses required for a reliable application of the treatment with current techniques, and to contribute to the definition and the specification of a new optimized procedure taking into account the actual patient’s vessel geometry. The detection of vascular luminal surface was performed by an image analysis process, i.e. virtual active navigation, applied to standard CT data. Dose distribution was calculated according to the formalism proposed and recommended by the AAPM in TG43 and TG60. A method combining simulated annealing and BFGS algorithms was applied to optimize the parameters associated with the dwell points such as their number, positions, and dwell times. Dose-surface histogram (DSH) was used to evaluate the dose distribution results. Four levels of accuracy in target surface description were tested. The application of this optimization method to four different CT data sets including patient data, phantom and animal models showed that the treatment plan can be improved when the actual vessel geometry has been taken into account. 1. Introduction
Intravascular brachytherapy (IVB) constitutes a new therapeutic solution to avoid iterative redilations practiced after minimally invasive treatment of peripheral arterial stenoses. Following percutaneous transluminal angioplasty (PTA) procedure, IVB aims at preventing intimal hyperplasia / restenosis in a context which does not tolerate iatrogenic complications.
Less renarrowing of arteries as well as a reduced need for further treatment at the same site have been observed in patients with post-interventional restenosis which received radiation along with PTA. Liermann et al. (1) first described the feasibility of using IVB to actually inhibit restenosis in the femoro-popliteal setting. Wiedermann, Waksman, Mazur et al. (2-4) led their research groups respectively to study the feasibility and effectiveness of 192Ir on
vascular restenosis and showed a significantly smaller intimal proliferation and a prominent linear dose-response. Waksman et al. (3) performed endovascular beta radiation studies. The results have shown that the neo-intimal hyperplasia was decreased when radiation doses were higher than 5 Gy.
HAL author manuscript inserm-00183861, version 1
HAL author manuscript
After the above animal experiments, several clinical studies on high dose-rate (HDR) remote afterloading intravascular brachytherapy were conducted. The studies were designed to assess the safety, feasibility and effectiveness of HDR intravascular brachytherapy in preventing post-PTA restenosis in the femoral-popliteal arteries. The results of phase 1 trials were encouraging. Li et al. (5, 6) studied the effects of guide wires and stents on dose distribution, Patel et al. (7) studied the implications of high beta and electron dose from 192Ir. Although its principle is known, the understanding of physiological effects as well as the implementation of IVB remain at a preliminary stage (8). Due to the use of a high activity source (192Ir seed), specific delivery device and interventional environment are required. In
actual treatment application the source is delivered using an HDR remote afterloader with a fixed step size, typically 5 mm, using either centered or non centered catheter. Moreover, peripheral arteries present some specific features compared with coronary arteries as for their shape, geometrical features (length, diameter, curvature) and the presence of surrounding anatomical structures. The particular problems to deal with concern the centering of the source inside the lumen, the good covering of the lesion after a transluminal angioplasty, the ray penetration, which has to reach the adventicia in order to be efficient while avoiding surrounding anatomical structures. Nevertheless, in most current IVB planning procedures, the lesion path is assumed to be a straight line and the dose prescription is specified with respect to the seed and the mean diameter of the artery. Since the dose distribution closely depends on the geometry of vasculature (9, 10), recent works, on intracoronary brachytherapy notably, have shown that the morphological characteristics of the vessel should be taken into account in the planning process. Intravascular ultrasound (IVUS) data were used to detect the inner surface of the vascular structure to irradiate (9, 11, 12).
This paper deals with the optimization of the treatment plan for IVB in peripheral arteries. CT data are used to describe 3D luminal surface and to define the target surface / volume. The objective is twofold: (a) to quantitatively study the validity of different approximation hypotheses in artery luminal surface description required for the application of the treatment in clinical routine with current techniques, and (b) to contribute to the definition and the specification of a new optimized procedure. In the proposed approach, the planning process is divided into two steps: (i) description of vessel luminal surface and centerline by virtual exploration of CT data, and (ii) optimization of the seed parameters based on a combination of simulated annealing and BFGS algorithms. The first step was presented in a previous work (13). We focus here on the optimization process in which the vessel surface morphology, the number of dwell points, the position and dwell time associated with each dwell point are taken into account.
2. Method and materials
2.1. Patient data description
In endovascular procedures, precise knowledge of geometrical parameters of the arteries and lesions is required to establish a precise planning of intervention. The geometrical description of vascular inner surface, which is used to define the target surface and thus the target volume to irradiate, is based on a virtual angioscopy like process applied to CT data. In this virtual exploratory navigation framework, the virtual angioscope constructs a geometrical model of the scene observed along its path. Visual information is augmented by a geometrical representation, allowing the computation of geometrical parameters featuring the internal lumen of the vessel and its lesion. The general framework, whose basic functions have already been reported in the literature (13), is summarized in the following.
Virtual image computation was performed according to a ray casting scheme integrating image analysis functions. The geometrical model of the virtual angioscope has been extended to include a quantification plane which allows it to construct, during the navigation, a precise surface description of the vascular structure (14).
The geometrical model considered for the virtual image computation was based on a perspective projection in which the focal length f defines the field of view and the optical center is located at the current position of the virtual endoscope. In addition to the virtual image formed by associating a projection ray to each pixel, a precise surface detection was carried out in the additional quantification plane, defined by the center and the optical axis of the virtual angioscope, and using only some uniformly distributed rays (typically 24). The surface points detected in the quantification plane and structured along the successive positions of the virtual sensor trajectory were used to form a polygonal mesh delimiting the vessel lumen. For each position of the trajectory, an operator calculates the geometrical center of the lumen section described by the contour detected in the quantification plane. If the trajectory is not centered, or if its orientation affects the mesh outcome, new displacement and orientation parameters are computed until the trajectory is centered in the vessel lumen. The output of navigation is a set of points representing the luminal surface, associated with the successive positions along the centered virtual path.
A virtual active navigation system for target surface reconstruction was developed on Windows platform. The user interface is presented in Fig. 1. An example of vascular inner surface description is illustrated in Fig. 2.
Fig. 1: Virtual navigation system for description of vascular luminal surface. Given a starting point and a target point by means of the position sliders (bottom left) the system automatically constructs the centerline and the luminal surface of the vessel. Top left: three orthogonal CT slices with the position of the virtual endoscope. Top right: the virtual endoscopy image, the reconstructed vascular surface and a reformated CT slice.
Fig. 2: Example of data description.
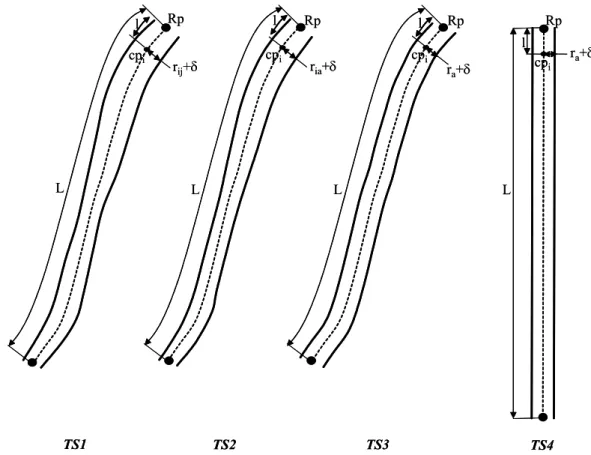
From this geometrical description of patient CT data (luminal surface and centerline of the vessel), four different types of target surface were considered for the dose prescription. They are illustrated by Fig. 3. The navigation trajectory which defines the centerline of the vessel as well as the 3D surface points belonging to the different section planes (quantification plane at different locations of the virtual sensor) were kept unchanged to constitute the set of surface points defining the most accurate target surface TS1. If rij denotes the distance of the jth surface
point Pij to the center cpi in the section plane Qi, the dose is prescribed at rij + δ, where δ is a
parameter to be defined. The target surface TS2 is defined by considering for each section
plane the points P’ij of polar coordinates (θij, ria), where ria is the average value of rij in Qi.
Concerning target surface TS3, the polar coordinates of the surface points are given by (θij, ra),
where ra is the average value of all the radius ria in the different section planes Qi. In the case
of the less accurate target surface TS4, the centerline is transformed into a straight line by
considering the reference point Rp (first point of the centerline). The surface points in each
transformed section plane, located at point cpi and orthogonal to the staight line, are given by
P’’ij(θij, ra), where ra is defined as in the case of TS3.
L L L L cpi cpi cpi cp i l l l l rij+δ ria+δ ra+δ ra+δ TS1 TS2 TS3 TS4 Rp Rp Rp Rp L L L L cpi cpi cpi cp i l l l l rij+δ ria+δ ra+δ ra+δ TS1 TS2 TS3 TS4 Rp Rp Rp Rp
Fig. 3. Target surface cases for dose presciption.
2.2. Dose calculation formalism
To determine the parameters that may influence the treatment plan, it is first necessary to choose an appropriate model for computing the dose distribution at an arbitrary point. The standard Nucletron 192Ir cylindrical seed we considered is 3.5 mm long and 0.6 mm in diameter, encapsulated in a 5.0 mm long × 1.1 mm diameter stainless steel housing (15).
The computation of dose distribution often uses the basic dosimetry data, including dose rate constants, radial dose functions, and anisotropy functions as recommended in (8). According to the formalism proposed by the AAPM in TG43 (16) and TG60 (9), the dose distribution, for a cylindrically symmetric source, can be described in terms of a polar coordinate system with its origin at the source center where r is the distance to the point of interest and θ is the angle with respect to the long axis of the source. The dose rate, D(r, θ), at point (r, θ), is defined as follows:
[
( , )/ ( , )]
( ) ( , ) ),
(rθ S 0Grθ Gr0θ0 g0 r Frθ
D = k⋅Λr r ⋅ (1)
where (r0, θ0) denotes the reference point that is chosen to lie on the transverse bisector of the
source at a distance of r0 = 1 cm for interstitial applications (TG43), and r0 = 2 mm for
intravascular applications (TG60) and θ0 = π/2; Sk is the air kerma strength of the source in
units of U; is the dose rate constant defined as the dose rate per unit air kerma strength along the transverse source bisector at the reference distance r0; G(r, θ) is the geometry factor,
is the radial dose function, and F(r, θ) is the anisotropy function.
0 r Λ ) ( 0 r gr
When the number of dwell points used in a treatment is N, the dose rate received at a point
P is the weighting sum of D(r, θ):
) , ( ) ( 1 j j N j jD r w P I
∑
θ = = (2)where wj corresponds to the dwell time of the jth position.
2.3. IVB planning optimization
In order to fit the calculated dose distribution to the dose prescribed according to the 3D surface description of the vessel wall, a quadratic, least-square objective function was used to optimize the irradiation parameters. Let X denotes the set of parameters to be optimized, we have:
∑
∑
= = − − + − = T NN i i N N i N i i T I P I P D D I P D X f 1 2 1 2 ( ( ) )( ( )) )) ( ( ) ( min α β δ (3) with ⎩ ⎨ ⎧ > = − otherwise 0 ) ( if 1 ) ) ( ( i N N i D P I D P I δwhere NT is the number of 3D surface sampled points in the lesion area; NN is the number of
3D surface sampled points distributed on the normal tissues; Tis the prescribed dose at the point Pi of the lesion surface; Nis the prescribed dose at the point Pi of the normal surface;
I(Pi) is the calculated dose at point Pi . The coefficients α and β are the degree of desirability
weighting factors for target points and normal or critical points, respectively.
D D
To solve the optimization problem (3), we first transformed the parameter wj to y2, as
proposed by Cotrutz et al. (17), to limit the dwell times to be non-negative so that the problem (3) becomes an unconstrained optimization problem. A method combining simulated annealing algorithm and BFGS algorithm was used to optimize the number of seeds, the dwell position as well as the dwell time associated with each seed.
BFGS algorithm is an extension of Netwon’s method. In each step, the objective function is approximated by a second order Taylor polynomial and the displacement leading to the
unique stationary value (minimum or maximum) of the quadratic function is calculated directly. BFGS algorithm uses the same strategy but do not require the second order partial derivatives needed for the Taylor polynomial. These values are approximated using information from previous iterations. Quadratic convergence close to the maximum is guaranteed. Nevertheless, this kind of algorithm can meet some difficulties when the seed positions are constrained to be located on the vessel centerline. In the proposed approach, simulated annealing algorithm was used to compute the optimized seed positions along the centerline, whereas BFGS was used to determine the dwell times for a given number of seeds and dwell poistions.
The range of the number of seeds depends on both the length of plan path, given here by the vessel centerline, and the seed length. Let Ls be the seed length, and Lp the plan path
length, the number of seeds is assumed to vary from Lp/(1.2*Ls) to Lp/(0.8*Ls). For each given
number of seeds, Eq. (3) was solved to determine the corresponding optimal solution regarding dwell positions and time parameters. Among all the solutions, the one fits best to the prescribed dose distribution was selected as the final result.
3. Results
In order to evaluate our methodology, we considered four data sets (Table 1) acquired from helical CT scanner: one from a phantom model showing an important narrowing (DS1), one
from patient iliac artery with no lesion (DS2) and two from post-PTA sheep iliac artery (DS3,
DS4).
Data set Nx*Ny*Nz; voxel_size (mm) Lp (cm) Lp/Ls AD (mm)
DS1 256*256*251; 0.39 2.65 7.6 6.37
DS2 128*128*182; 1.08 4.0 11.4 8.9
DS3 170*170*335; 0.39 8.05 23.0 6.85
DS4 140*140*336 ; 0.39 7.48 21.4 7.18
Table 1. Data sets used in the experiments. Nx, Ny, and Nz, the number of voxels along x, y, and z directions respectively, define the image volume size (IVS). Lp is the length of the seed
path and the ratio Lp/Ls, with the seed length Ls = 0.35 cm, gives an indication on the possible
number of seed points along the path. AD is the average diameter of the vasculare structure. The geometrical description of vascular inner surface was detected automatically by active navigation (Fig. 4). In all the following experiments, the activity of the seed was set to the maximum possible value (10 ci or 370 Gb). To date, different dose prescriptions have been considered in clinical trials of peripheral IVB. In this study we adopted the dose prescription used in Vienna 4 and 5 (18) and LIMBER (8) clinical trials. A dose of 14 Gy was specified at a distance of δ = 2 mm to each considered luminalsurface points (radius + 2 mm). The main criteria considered to quantify the results of the planning process is the dose-surface histogram (DSH) which represents the dose homogeneity over the lesion area. The DSH is a useful alternative to the DVH for the dose distribution evaluation of a hollow organ (19). In all the following results, DSHs were obtained by computing the dose distribution on the actual target surface points (case TS1 + a distance margin of δ = 2 mm).
(DS1) (DS2)
(DS3) (DS4)
Fig. 4. Representation of the surface points and the certerlines for the different data sets.
3.1. Surface sampling
To study the effect of the number of surface points and of their distribution, the spatial configuration of the dwell points (number, positions) was fixed so that only the dwell times have to be estimated in the optimization process. The number of surface points in the quantification plane, i.e. on the contour of the lumen cross-section at a given position along the centerline, was set to 24. Considering the phantom data set DS1, this leads to a distance
between surface points of about 1 mm. With a target surface description of type TS2, three
different sampling rates of the centerline were considered, respectively 1 mm, 2 mm, and 4mm, leading to three different configurations of the surface sampling. The results presented in Fig. 5 show that DSH obtained with sampling of the centerline with both 1 mm and 2 mm gave better results than that with 4 mm; the result obtained with 1 mm gave just a little improvement than that with 2 mm. Thus, taking the computation time into consideration, sampling with 2 mm is a better choice.
Fig. 5. Effect of surface sampling.
3.2. Optimization process
With a surface data composed of 24 points per each plane located along the centerline and a centerline sampling of 2 mm as mentioned in the previous subsection, this study is aimed at evaluating the best configuration of optimization parameters. The results reported below (Fig. 6) concern the above four data sets with a target surface description of type TS2. They were
obtained by considering either equidistant dwell positions (number of dwell points and dwell times are optimized) or non-equidistant dwell positions (number of dwell points, dwell positions along the centerline and dwell times are optimized).
(a) DSH of DS1 (b) DSH of DS2
(c) DSH of DS3 (d) DSH of DS4
Fig. 6. DSHs obtained for different optimization configurations.
DSHs obtained with non-equidistant dwell positions show only a slight improvement of the results compared with equidistant dwell positions. Moreover, when non-equidistant
arrangement optimization is considered, it takes much more computation time. In the case of equidistant arrangement, only dwell time needs to be optimized for each given number of seeds, which could be solved by BFGS algorithm in a few seconds (from 1.2 s to 1.6 s for the considered data sets). However for non-equidistant arrangement, both dwell positions and dwell times need to be optimized for each given number of seeds, which must be optimized by combining simulated annealing and BFGS algorithms. This procedure may take hundreds of seconds (from 415 s to 657 s for the considered data sets). Thus, considering the balance of DSH results and computation time, we prefer to adopt equidistant arrangement.
3.3. Target surface and seed trajectory
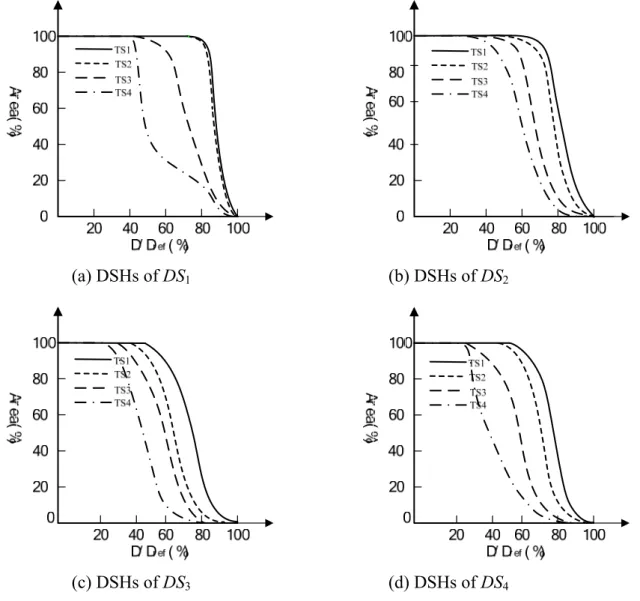
Since too many dwell points and/or non-equidistant dwell positions can only improve the results a little as pointed out previously, leading to considerable increase of the computation time, an equidistance constraint on the dwell positions is here considered for each of the four data sets. The surface sampling configuration is the same as the one described in the previous section. According to these hypotheses, experimental tests (Fig. 7) have been performed to study the validity of the different possible assumptions regarding the type of target surface and seed trajectory (TS1, TS2, TS3, TS4). The results show that optimization with TS1 gives the
best dose distribution, the dose distributions optimized with TS2 are closed to that optimized
with TS1, especially for the DS1 data set. However, the dose distributions optimized with
either TS3 or TS4 are far from those obtained with TS1.
(a) DSHs of DS1 (b) DSHs of DS2
(c) DSHs of DS3 (d) DSHs of DS4
Fig. 7. Effect of target surface and seed trajectory.
4. Discussion
Although IVB has been deemed as a preferred treatment for coronary restenosis in clinical practice, the application of IVB in peripheral arteries remains at a preliminary stage. Computer assistance, integrating image processing, data registration, reconstruction and modelling, as well as optimization capabilities should constitute a solution to the achievement of peripheral IVB in clinical practice. Hence, some important issues have still to be considered, such as: (i) protocol definition, (ii) anatomical feature based dosimetric planning, (iii) treatment plan implementation, and (iv) evaluation.
In this study we focused on treatment planning optimimization. In order to make the procedure more reliable and accurate, the geometry of the artery should be taken into consideration. The proposed approach combines luminal surface reconstruction from CT image analysis and optimization process.
Several kinds of parameters intervene in the proposed approach. They are related to (i) the surface points sampling in lesion area to treat and in critical healthy surrounding structures (e.g. ureter) which are not considered in this study, (ii) the optimization process which can include different unknown parameters such as the number of dwell points, the dwell positions and dwell times, and (iii) the type of target surface considered for dose prescription as well as the seed trajectory (from straight line assumption to actual vessel geometry).
Dose distributions for the different approximation hypotheses of the target surface have been studied systematically. Several data sets showing vessel of different morphological features (curvature, residual narrowing) have been considered. The study of the effect of the number of surface points and of their distribution shows that the best choice is to consider a regular sampling of the luminal surface, in other words, the distance between surface points in lumen cross-section has to be of the same order as the distance between the section planes. DSHs obtained on four data sets with a target surface description of type TS2 by considering
either equidistant positions (number of dwell points and dwell times are optimized) or non-equidistant positions (number of dwell points, dwell positions along the centerline and dwell times are optimized) show that non-equidistant arrangement does not lead to a significant improvement of the results. The tests of different target surface assumptions show that optimization with TS1 gives the best dose distribution. The dose distributions optimized
with TS2 are close to those optimized with TS1, especially for the DS1 data set where the
lumen cross-section is quasi-circular. However, one can note that the dose distributions optimized with either TS3 or TS4 (the less accurate surface description) are far from those
optimized with TS1 (the most accurate surface description).
5. Conclusion
This study has shown that the planning of peripheral intravascular brachytherapy should take into consideration an accurate description of vessel actual morphology, a regular sampling of the target surface as well as an equidistant arrangement of dwell positions. As pointed out in this paper and in recent works (20) several issues have still to be considered to make IVB an efficient treatment in clinical practice. In order to implement the IVB treatment with current HDR remote afterloader and to apply it according to the proposed optimized planning, the intervention protocol will have to include a CT acquisition between PTA procedure and irradiation procedure, and an accurate intra-operative localization of the seed positions should be required (21). On a clinical point of view, further works and experiments
based on the proposed approach and dealing with the issue of surrounding structures could help to better define the target volume which is not yet fully and exactly known in peripheral IVB.
References
[1] Liermann D, Bottcher HD, Kollath J. Prophylactic endovascular radiotherapy to prevent intimal hyperplasia after stent implantation in femoropopliteal arteries. Cardiovasc
Intervent Radiol 1994; 17:12-16.
[2] Wiedermann JG, Marboe C, Amols H, et al. Intracoronary irradiation markedly reduces restenosis after balloon angioplasty in a porcine model. J Am Coll Cardiol 1994; 23:1491-1498.
[3] Waksman R, Robinson KA, Crocker IR, et al. Endovascular low-dose irradiation inhibits neointima formation after coronary artery balloon injury in swine: a possible role for radiation therapy in restenosis prevention. Circulation 1995; 91:1533-1539.
[4] Mazur W, Ali NM, Dabaghi SF, et al. High dose rate intracoronary radiation suppresses neointimal proliferation in the stented and ballooned model of porcine restenosis.
Circulation 1994; 90(suppl I):I-652.
[5] Li XA, Shih R. Dose effects of guide wires for catheter-based intravascular brachytherapy. Int J Radiat Oncol Biol phys 2001; 51:1103-1110.
[6] Li XA. Dose effects of stents in intravascular brachytherapy for in-stent restenosis: a monte carlo calculation. Int J Radiat Oncol Biol phys 2003; 55:842-848.
[7] Patel NS, Chiu-Tsao ST, Ho Y, et al. High beta and electron dose from 192Ir: implications for “Gamma” intravascular brachytherapy. Int J Radiat Oncol Biol phys 2002; 54:972-980.
[8] Kirisits C, Pokrajac B, Berger D, et al. Treatment parameters for beta and gamma devices in peripheral endovascular brachytherapy. Int J Radiat Oncol Biol phys 2004; 60:1652-1659.
[9] Nath R et al. Intravascular brachytherapy physics: Report of the AAPM Radiation Therapy Committee Task Group N° 60. Med Phys 1999; 26:119-152.
[10] Wahle A, Lopez JJ, et al. Effects of vessel geometry and catheter position on dose delivery in intracoronary brachytherapy. IEEE Trans Biomed Eng, 2003; 50:1286-1295. [11] Roelandt JRTC, Mario C. di, et al. Three-dimensional reconstruction of intracoronary
ultrasound images: rationale, approaches, problems and directions. Circulation, 1994; 90:1044-1055.
[12] Wahle A, Lopez JJ, Pennington EC, et al. Estimating the actual dose delivered by intravascular coronary brachytherapy using geometrically correct 3-D modelling. Medical
Imaging 2003: Visualization, Image-Guided Procedures, and Display, SPIE Proceedings,
2003;5029:129-137.
[13] Haigron P, Bellemare ME, Acosta O, et al. Depth-map-based scene analysis for active navigation in virtual angioscopy, IEEE Trans Med Imaging, 2004;23:1380-1390.
[14] Acosta O, Göksu C, Lucas A, et al. Geometrical description of anatomical structures based on virtual exploratory navigation, Surgetica’2005, Grenoble, Sauramps Medical, 2005:437-445.
[15] Williamson JF, Li Z. Monte Carlo aided dosimetry of the microselectron pulsed and high dose-rate 192Ir sources. Med Phys 1995; 22:809-819.
[16] Nath R et al. Dosimetry of intersticial brachytherapy sources : Recommandations of the AAPM Radiation Therapy Committee Task Group N° 43. Med Phys, 1995; 22:209-234. [17] Cotrutz C, Lahanas M, Kappas C, Baltas D. A multiobjective gradient based dose
optimization algorithm for comformal radiotherapy. Phys Med Biol, 2001;46:2161-2175.
[18] Wolfram R, Pokrajac B, Ahmadi R, et al. Endovascular brachytherapy for prophylaxis against restenosis after long-segment femoropoplital stenting: Initial results. Radiology, 2001;220:724-729.
[19] Lu Y, Li S, Spelbring D, et al. Dose-surface histograms as treatment planning tool for prostate conformal therapy. Med Phys, 1995; 22:279-284.
[20] Weichert F, Müller H, Quast U, et al. Virtual 3D IVUS vessel model for intravascular brachytherapy planning. I. 3D segmentation, reconstruction, and visualization of coronary artery architecture and orientation. Med Phys, 2003; 30:2530-2536.
[21] Bellec J, Manens JP, Göksu C, Moisan C, Haigron P, A study of dosimetric evaluation and feasibility of image guided intravascular brachytherapy in peripheral arteries;
MICCAI 2004, Lecture Notes in Computer Science, Springer Verlag; 2004, 3217 :
1101-1102.