HAL Id: inserm-01815134
https://www.hal.inserm.fr/inserm-01815134
Submitted on 13 Jun 2018
HAL is a multi-disciplinary open access
archive for the deposit and dissemination of sci-entific research documents, whether they are pub-lished or not. The documents may come from teaching and research institutions in France or abroad, or from public or private research centers.
L’archive ouverte pluridisciplinaire HAL, est destinée au dépôt et à la diffusion de documents scientifiques de niveau recherche, publiés ou non, émanant des établissements d’enseignement et de recherche français ou étrangers, des laboratoires publics ou privés.
Specific IgE and IgG measured by the MeDALL
allergen-chip depend on allergen and route of exposure:
The EGEA study
Valérie Siroux, Christian Lupinek, Yvonne Resch, Mirela Curin, Jocelyne Just,
Thomas Keil, Renata Kiss, Karin Carlsen, Erik Melen, Rachel Nadif, et al.
To cite this version:
Valérie Siroux, Christian Lupinek, Yvonne Resch, Mirela Curin, Jocelyne Just, et al.. Specific IgE and IgG measured by the MeDALL allergen-chip depend on allergen and route of exposure: The EGEA study. Journal of Allergy and Clinical Immunology, Elsevier, 2017, 139 (2), pp.643 - 654. �10.1016/j.jaci.2016.05.023�. �inserm-01815134�
Specific IgE and IgG measured by the MeDALL allergen-chip depend
1
on allergen and route of exposure - the EGEA study
2 3
Valérie Siroux a,b,c, Christian Lupinekd, Yvonne Reschd, Mirela Curind, Jocelyne Just e, f ,
4
Thomas Keil g, h, Renata Kissd, Karin Lodrup Carlsen i, j , Erik Melén k,l, Rachel Nadif m, n,
5
Isabelle Pin a,b,c, Ingebjørg Skrindo j,o, Susanne Vrtalad, p, Magnus Wickmanl, m, Josep Maria
6
Anto q,r,s,t, Rudolf Valentad, Jean Bousquetm,n,u
7 8 a Univ. Grenoble Alpes. IAB. Team of Environmental Epidemiology applied to 9 Reproduction and Respiratory Health. F-38000 Grenoble. France. 10 b INSERM. IAB. Team of Environmental Epidemiology applied to Reproduction and 11 Respiratory Health. F-38000 Grenoble. France. 12 c CHU de Grenoble. IAB. Team of Environmental Epidemiology applied to Reproduction 13 and Respiratory Health. F-38000 Grenoble. France. 14 d Division of Immunopathology, Department of Pathophysiology and Allergy Research, 15 Center for Pathophysiology, Infectiology and Immunology, Medical University of Vienna, 16 Austria. 17 e Assistance Publique-Hôpitaux de Paris, Hôpital Armand-Trousseau, Allergology 18 Department, Paris, France 19 f Université Paris 6 Pierre et Marie Curie, Paris, France 20 g Institute for Social Medicine, Epidemiology and Health Economics, Charité – 21 Universitätsmedizin Berlin, Berlin, Germany 22 h Institute for Clinical Epidemiology and Biometry, University of Würzburg, Würzburg, 23 Germany 24 i Dept of Paediatrics, Oslo University Hospital, Oslo, Norway 25 j Faculty of Medicine, Institute of Clinical Medicine, University of Oslo, Oslo, Norway 26
k Institute of Environmental Medicine and the Centre for Allergy Research, Karolinska 27 Institutet, Stockholm, Sweden 28 l Sachs Children and Youth Hospital, Stockholm, Sweden 29 m INSERM U1168, VIMA (Aging and chronic diseases. Epidemiological and public health 30 approaches), 16 avenue Paul Vaillant Couturier, F-94807, Villejuif, France 31 n Univ Versailles St-Quentin-en-Yvelines, UMR-S 1168, F-78180, Montigny le Bretonneux, 32 France 33 o Department of Otorhinolaryngology, Akershus University Hospital, Norway 34 p Christian Doppler Laboratory for the Development of Allergen chips, Department of 35 Pathophysiology and Allergy Research, Center for Pathophysiology, Infectiology and 36 Immunology, Medical University of Vienna, Austria. 37 q Centre for Research in Environmental Epidemiology (CREAL) 38 r IMIM (Hospital del Mar Medical Research Institute) 39 s Universitat Pompeu Fabra (UPF) 40 t CIBER Epidemiología y Salud Pública (CIBERESP) 41 u University hospital, Montpellier, France and MeDALL (Mechanisms of the Development 42 of Allergy, FP7) 43 44 Disclosure of potential conflict of interest related to the submitted work 45 Rudolf Valenta has received research grants from Biomay AG, Vienna, Austria and 46 Thermofisher, Uppsala, Sweden. He serves as a consultant for Biomay AG, Vienna, 47 Austria, Thermofisher, Uppsala, Sweden and Fresenius Medical Care, Bad Homburg, 48 Germany. Jean Bousquet serves in scientific advisory boards from Almirall, Meda, Merck, 49 MSD, Novartis, Sanofi-Aventis, Takeda, Teva, Uriach. Magnus Wickman has recieved 50 research grants from ThermoFisher Scientific. 51 52 Corresponding author 53
Valérie Siroux 54 Institut Albert Boniot 55 Inserm/CNRS/Univ Grenoble-Alpes U 1209 56 Equipe d’épidémiologie environnementale appliquée à la reproduction et à la santé 57 respiratoire 58 Rond point de la chantourne 59 38706 La Tronche cedex 60 Tel : +33 4 76 54 95 56 61 Mail : Valerie.siroux@ujf-grenoble.fr 62 63 Sources of funding: The study was supported in part by Inserm Aviesan Itmo santé 64 publique, the Scientific committee “AGIR for chronic diseases”, grant F4605 of the 65 Austrian Science Fund (FWF) to RV and by the European Commission’s Seventh 66 Framework 29 Program MeDALL under grant agreement no. 261357. 67 68 69 Manuscript word count: 3605 70 Abstract word count: 250 71
72
Abstract
73 Background: The nature of allergens, route and dose of exposure may affect the natural 74 development of IgE and IgG responses. 75 Aim: To investigate the natural IgE and IgG responses towards a large panel of respiratory 76 and food allergens in subjects exposed to different respiratory allergen loads. 77Methods: A cross-sectional analysis was conducted in 340 adults of the EGEA cohort 78
(Epidemiological study of the Genetics and Environment of Asthma, bronchial 79
hyperresponsiveness and atopy) (170 with and 170 without asthma). IgE and IgG to 47 80
inhalant and food allergen components were analyzed in sera using the MeDALL micro-81
array technology and compared between 5 French regions according to the route of 82
allergen exposure (inhaled vs. food allergens). 83
Results: Overall 48.8% of the population had allergen-specific IgE≥0.3 ISU to at least one 84
of the 47 allergens with no significant differences across the regions. For ubiquitous 85 respiratory allergens (i.e., grass-, olive/ash pollen, house dust mites), specific IgE did not 86 show marked differences between regions and specific IgG (≥0.5 ISU) was present in most 87 subjects everywhere. For regionally occurring pollen allergens (ragweed, birch, cypress), 88 IgE sensitization was significantly associated with regional pollen exposure. For airborne 89 allergens cross-reacting with food allergens, frequent IgG recognition was observed even 90
in regions with low allergen prevalence (Bet v 1) or for allergens less frequently 91
recognized by IgE (profilins). 92
Conclusions: The variability of allergen specific IgE and IgG frequencies depends on 93 exposure, route of exposure and overall immunogenicity of the allergen. Allergen contact 94 by oral route might preferentially induce IgG responses. 95
96
Key messages
97IgE and IgG towards respiratory allergens are usually associated with inhalant allergen 98 exposures but IgG is frequent in subjects exposed to cross-reacting food allergens. Oral 99 exposure preferentially induces IgG responses. 100 101
Capsule summary
102
Inhalant and oral routes of exposure induce different patterns of sensitization. Oral route 103
may preferentially induce IgG responses whereas respiratory route is important for IgE 104 sensitization. A geographical pattern of IgE response to pollen exposure exists in France, 105 depending on regional pollen exposure. 106 107
Key words
108IgE, IgG, allergen components, respiratory allergens, food allergens, EGEA, cohort, 109 epidemiology, MeDALL, microarray 110 111
Abbreviations
112 Bet v: Betula verrucosa 113 Cyn d: Cynodon dactylon 114 EGEA: Epidemiological study of the Genetics and Environment of Asthma, bronchial 115 hyperresponsiveness and atopy 116 Fel d: Felis domesticus 117 FP7: Framework Programme 7 (European Union) 118 IgE: Immunoglobulin E 119 IgG: Immunoglobulin G 120 Mal d: Malus domestica 121 MeDALL: Mechanisms of the development of allergy 122 Phl p: Phleum pratense 123 PR-10: pathogenesis-related protein family PR-10 124
Introduction
125
Allergic patients are characterized by the production of specific immunoglobulin E (IgE) 126
antibodies against allergens 1 whereas allergen-specific IgG antibodies occur in both
127
allergic and non-allergic individuals.2 Allergen-specific IgG antibodies play a role in 128
specific clinical tolerance, either occurring naturally or induced by allergen-129
specific immunotherapy.3-7 For certain allergens IgE and IgG responses differ.8
Allergen-130
specific IgG may be associated with exposure to the respective allergen.9,10 However, 131
population data regarding the role of IgG production to a broad panel of common food 132
and inhalant allergens are not available. 133
The route and dose of exposure to allergens are highly relevant for IgE and IgG 134
sensitization. Oral route may favour an IgG response whereas inhaled exposure may 135
favour an IgE response.8,11 Investigating the IgG response to several molecule groups like
136
profilins (e.g., Bet v 2, Phl p 12), including both inhalant and food allergens, or polcalcins, 137
i.e., calcium-binding allergens (e.g., Bet v 4, Phl p 7), including only inhalant allergens, 138
could provide additional insight into the role of the route of exposure for allergic 139
sensitisation. 140
The microarray technology allows measurement of allergen-specific IgE and IgG antibody 141
responses to many allergen components. In MeDALL, the ImmunoCAP ISAC chip 142
technology was improved to increase its sensitivity and to incorporate new allergens.12-16
143
The resulting MeDALL chip has been validated 15,16 and more than 6000 sera from 7
144
European birth cohorts (e.g., BAMSE and ECA)17,18 have been tested so far.
145
The Epidemiological study of the Genetics and Environment of Asthma, bronchial 146
hyperresponsivness and atopy - EGEA 19-21 is a cohort of adults and children with and
147
without asthma recruited in five French cities (Paris, Lyon, Grenoble, Montpellier and 148
Marseille). Pollen exposure varies widely among these different places. While grass pollen 149
exposure is similar across France, exposure to pollens of birch, cypress and ragweed 150
exhibits strong geographical variability. 151
As part of the MeDALL project,15 the present study investigates the geographical
152
variability of allergen-specific IgE and IgG towards a large variety of different respiratory 153
and food allergens using the MeDALL micro-array technology in sera from the EGEA 154
cohort obtained from subjects recruited in different places in France. We addressed if 155 there are differences among the types of allergens, routes of allergen exposure and levels 156 of respiratory allergen exposure on allergen-specific IgE and IgG production.
157
158
Methods
159 Population and study setting 160 The EGEA cohort is composed of patients with asthma enrolled in chest clinics and their 161 first-degree relatives, and a group of control subjects, all recruited in the early 1990s in 5 162French cities. Protocol and characteristics have been previously published.22,23 Briefly, 163
2047 participants were enrolled at baseline (EGEA1) including 388 children (<16 years) 164
and adult patients with asthma from chest clinics, their 1244 first-degree relatives and 165
415 population-based control subjects. Subjects were recruited through self-completed 166
questionnaires and an overall matching by months at exam, age (decade), sex and centre. 167
About 11 years later, this population was invited for a follow-up (EGEA2) and 1601 168 participants (77.1% of the original cohort + 58 new family members) were subjected to a 169 complete examination, which included serum samples.21 EGEA collection is certified ISO 170 9001 and referenced in the Biobank network by the number BB-0033-00043. 171 The present analysis was conducted in 340 adult participants obtained at the follow-up 172
(i.e., EGEA2) (170 with and 170 without asthma). Participants were randomly selected 173
among all followed-up subjects with available serum and data on genetic polymorphisms 174
(to facilitate further analyses), skin prick tests, and total IgE at baseline (EGEA1) and 175
follow-up (EGEA2) visits and non-missing data for asthma status. 176
Written consent was obtained from all individuals. Ethical approval was obtained for both 177
surveys (Cochin Royal Hospital, Paris for EGEA1 and Necker-Enfants Malades Hospital, 178 Paris for EGEA2). 179 Asthma, allergic rhinitis phenotypes and Skin Prick Tests (SPT) 180 The definition of ever asthma was based on a positive answer to either ‘‘Have you ever 181
had attacks of breathlessness at rest with wheezing?’’ or ‘‘Have you ever had asthma 182
attacks?’’ or being recruited as an asthma case.23 Allergic rhinitis ever was defined by a
183
positive answer to “Have you ever had allergic rhinitis?” or “Have you ever had hay 184
fever?”. Subjects with a positive answer to “Have you had a problem with sneezing or 185
runny or blocked nose when you did not have a cold or flu in the last 12 months” have 186
been defined as active allergic rhinitis. 187
SPT was performed for 11 allergens (cat, Dermatophagoides pteronyssinus, Blattela 188
germanica, olive, birch, Parieteria judaica, timothy grass, ragweed pollen, Aspergillus, 189
Cladosporium herbarum, Alternaria tenuis). Positive SPT was defined by a mean wheal 190
diameter ≥3mm. 191
Measurement of allergen-specific IgE and IgG with the MeDALL allergen-chip 192
IgE and IgG were determined in anonymized samples with the MeDALL-chip as 193
described.15,16 It comprises 176 allergen components including aero- and food allergen
194
components. The measurement of allergen-specific IgE- and IgG reactivities was 195
performed as described.16,18,24.
196
The present study is focused on outdoor allergen sources whose distribution varied in the 197
different geographical areas (birch pollen, cypress pollen, ragweed pollen, olive/ash 198
pollen, timothy grass pollen), and on allergens from indoor allergen sources (house dust 199
mites). We studied IgG to the PR-10 group of allergens with cross-reactive food 200
allergens.18 To further address the hypothesis that allergen contact mainly by the oral
201
route induces IgG response, three common food allergens were also studied (milk, egg, 202
fish) allowing to compare the frequency of IgE and IgG recognition across respiratory and 203
food allergens. Overall, 47 representative allergen components were analysed in detail 204 (Table 2). 205 Geographical exposure to allergens 206 The geographical distribution of the studied pollens across France in 2006 was obtained 207 from the RNSA (Réseau National de Surveillance Aérobiologique), the French aerobiology 208
network in charge of the analysis of biological particles in air samples 209
(http://www.pollens.fr).25,26 Data are presented as the daily mean of grains/m3 across the 210
year 2006, a year included in the EGEA2 data collection period (2003-2007). 211
Biases 212
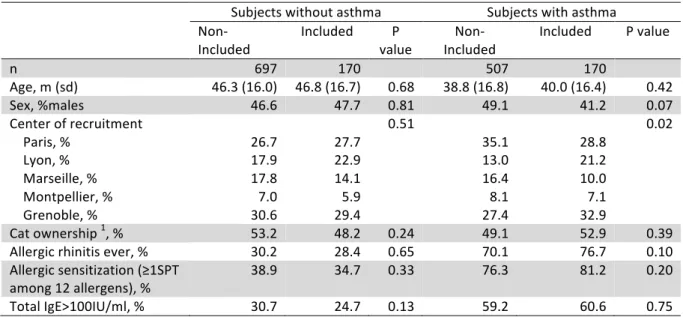
The random selection of the EGEA2 participants to the present analysis was a priori 213 unrelated to allergen exposure and allergic status, minimizing the risk for selection bias. 214 In both subjects with and without asthma, subjects included in the analysis did not differ 215 regarding allergic sensitization as defined by ≥1 positive reaction in SPT using 12 different 216
extracts, level of total IgE and allergic rhinitis phenotype as compared to non-included 217
participants (Table E1). Regarding exposure we did not observe marked differences 218
between included and non-included subjects, although included subjects with asthma 219 were more often recruited in Lyon and Grenoble (Table E1). 220 Statistical methods 221
According to previous studies, IgE and IgG positivity to allergen was defined by a 222
threshold of 0.3 ISU and 0.5 ISU, respectively16-18. Ordinal categorical variables were also
223
studied both for IgE (<0.3 <1 <3 <10 <30 and ≥ 30 ISU) and IgG (<0.5 <1.5 <5 <15 <50 and 224
≥50 ISU) because of the non-Gaussian distribution. Chi² test was computed when 225
applicable. Non-parametric Kruskal-Wallis tests were also applied to address whether the 226
IgE and IgG levels (considered as continuous outcomes) differed among centres. Odds 227
Ratios (OR) were estimated to assess the magnitude of the association between centres 228
and allergen-specific IgE (or IgG) sensitization using multinomial logistic regression 229 adjusted on age, sex, asthma and rhinitis status. 230
231
232
Results
233 Characteristics of study subjects 234 In this study, 340 sera from different centers (Paris: n=96; Lyon: n=75; Marseille: n=41; 235 Montpellier: n=22; Grenoble: n=106) were available. The demographic characteristics of 236 participants are presented in Table 1. The population included 47% men and the mean 237
age was 43 years. Fifty-two percent of participants had allergic rhinitis ever and 37.6% 238 had atopic dermatitis ever. Eighty-two participants reported to have received some form 239 of allergen immunotherapy (AIT). 240 Most frequently recognized allergens by IgE 241
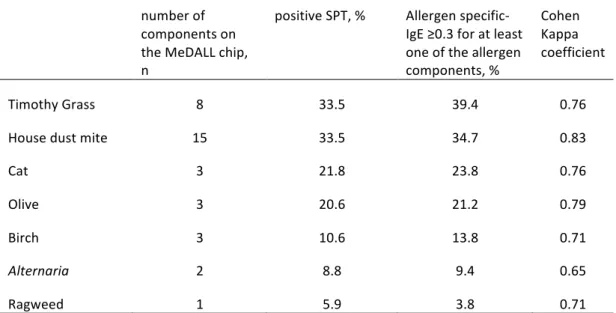
Overall, 48.8% of the population had allergen-specific IgE ≥0.3 to at least one of the 242
allergen components selected, which is in strong agreement with the prevalence of atopy 243
(defined by positive SPT to at least one of 11 aeroallergens) in this population (Cohen 244
Kappa coefficient = 0.68). The agreement between SPT and allergen-specific IgE was 245
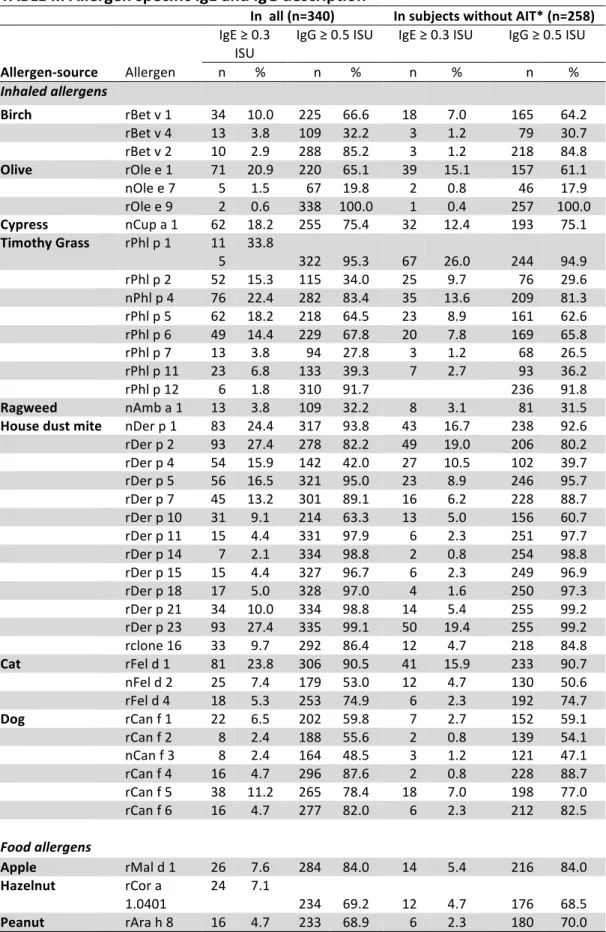
strong for each allergen (table E2). Pollen allergens most frequently recognized by IgE 246 were Phl p 1 (33.8%), Phl p 4 (22.4%), Ole e 1 (20.9%), Phl p 5 (18.2%), Cup a 1 (18.2%), 247 Phl p 2 (15.3%), Phl p 6 (14.4%) and Bet v 1 (10%) (Table 2). The indoor allergens most 248 frequently recognized by IgE were Der p 2 (27.4%), Der p 23 (27.4%), Der p 1 (24.4%), Fel 249 d 1 (23.8%), Der p 5 (16.5%), Der p 4 (15.9%), Der p 7 (13.2%), Can f 5 (11.2%), Der p 21 250
(10%) (Table 2). Regarding food allergens, the family of PR-10 proteins (i.e., Mal d 1: 251
apple; Cor a 1.0401: hazelnut; Ara h 8: peanut; Pru p 1: cherry; Gly m 4: soy) that cross-252
react with the major birch pollen allergen Bet v 1 were most frequently recognized by IgE 253
(7.6 – 2.4% patients), followed by Gal d 1 (ovomucoid, egg) and Bos d 4 (lactalbumin, 254
milk) with 0.6% and 0.3%. These patterns where consistent in the population who did not 255
receive AIT, although the prevalence of IgE recognition was lower as compared to the 256 whole study population (Table 2). 257 Similarities and discrepancies between IgE and IgG recognition 258 Distinct patterns of IgE and IgG recognition frequencies were found (Table 2). In general, 259
respiratory allergens (Ole e 1, Phl p 1, Phl p 4, Der p 1, Der p 2, Der p 23, Fel d 1) 260
frequently recognized by IgE antibodies (≥ 20% subjects) were frequently recognized by 261
IgG as well (≥ 60% subjects). Likewise, some respiratory allergens less frequently 262
recognized by IgE antibodies (≤6% subjects), were also recognized at low frequency (i.e., 263
<40%) by IgG (Phl p 7, Phl p 11, Bet v 4, Ole e 7, Amb a 1). On the other hand, other 264 respiratory allergens also less frequently recognized by IgE antibodies were recognized in 265 >80% by IgG (Phl p 12, Bet v 2, Ole e 9). Similar patterns were observed in the population 266 without AIT. 267 Geographical variation of IgE and IgG recognition 268 Although the IgE sensitisation to at least one of the analysed allergens (Table 2) did not 269
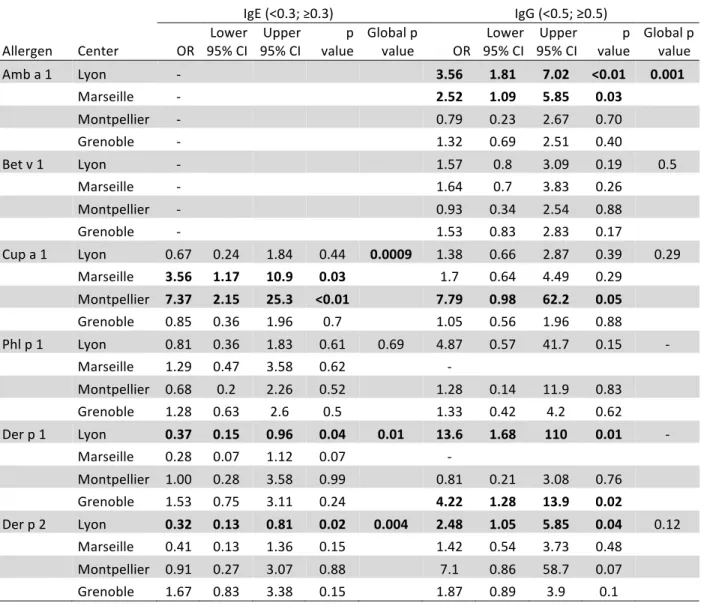
vary significantly across the geographical areas (from 39.0% to 54.7%, p=0.46), we 270
observed considerable geographical differences for some specific allergens (Fig. 1 and 271
Table 3). 272
For several major respiratory allergens the IgE and IgG frequencies in the different 273
regions followed to a large extent the exposure levels with the corresponding allergen 274
sources (e.g., ragweed exposure: Amb a 1; grass pollen exposure: Phl p 1 and exposure to 275
cypress: Cup a 1) (Fig. 1 and table 3). For example, in agreement with similar levels of 276
grass pollen exposure across France, IgE recognition frequencies for the major timothy 277 grass pollen allergen, Phl p 1, were similar across the geographical areas (the adjusted-278 ORs for each center as compared to Paris varied between 0.68 to 1.29, p >0.50; Table 3) 279 and IgG recognition of Phl p 1 was higher than 90% in each area. Inversely, IgE and IgG 280
recognition frequencies for the cypress pollen allergen Cup a 1 showed marked 281 geographical differences with adjusted OR of 7.4 (95%CI 2.1, 25.3) and 7.8 (95% CI 0.98-282 62.2) in Montpellier, the city showing the highest level of pollen exposures, as compared 283 to Paris. Similar patterns were observed in subjects with and in subjects without asthma 284
(Table E3), as well as in subjects without AIT (Table E4), although results should be 285
interpreted cautiously because of the sample size . 286
However, for Bet v 1 the geographic pattern of IgE and IgG recognition differed. IgE 287
recognition frequencies to Bet v 1 followed the exposure levels of birch pollen in the 288
different regions whereas IgG recognition was high (>60%) in all regions. This was also 289 observed for food allergens that showed immunological cross-reactivity with Bet v 1 (PR-290 10 proteins, e.g., Mal d 1 from apple, Cor a 1.0401 from hazelnut, Ara h 8 from peanut, 291 Pru p 1 from cherry, Gly m 4 from soy) (Fig. 1). 292
Regarding ubiquitously occurring allergens such a highly cross-reactive plant allergens 293 (calcium-binding allergens: Phl p 7, Bet v 4; profilins: Phl p 12, Bet v 2), house dust mite 294 allergens (e.g., Der p 1, Der p 2, Der p 23, Der p 10, Der p 11, Der p 14) and food allergens 295
whose sensitization occurs primarily by oral route (e.g., Bos d 4, Gal d 1, Gad c 1), we 296
found little geographic variation of IgE and IgG recognition frequencies (Fig. 1 and 2). 297
Nevertheless, for some of these allergen components the IgG concentration varied across 298
the regions (as indicated by the non-parametric Kruskal-Wallis test estimated on 299
the continuous variables) and IgE reactivity against major indoor allergens from house 300
dust mite (i.e., Der p 2, Der p 23, Der p 1) tended to be lower in Lyon and Marseille (Fig. 301
2). In each region, Der p 10, Der p 11 and Der p 14, for which exposure also occurs via the 302
gut (Der p 10 cross-reacts with tropomyosin from shrimp) or the skin, were rarely 303
recognized by IgE but frequently by IgG (Table 2, Fig. 2). 304
Very few subjects showed IgE reactivity to allergens of milk (Bos d 4) and egg (Gal d 1), 305
and these allergens were recognized by IgG in about 90% of the subjects with no 306
differences across the geographical areas (Fig. 3). 307
Discussion
309Microarrayed allergens are increasingly used to determine the profile of molecular IgE 310
sensitization in populations.27,28 However, to the best of our knowledge, the current study
311
is the first systematic study comparing IgE and IgG responses to a large panel of 312
respiratory and food allergens in a geographically defined population. It shows a large 313
geographical variability in the distribution of IgE and IgG antibodies in France which could 314
be summarized as following: 1) for ubiquitous allergens such as pollens of grass, olive/ash 315
and to a lesser extent allergens from house dust mites, IgE antibodies were scattered 316
around the different French regions (up to 34% of participants) and IgG was present in 317
most subjects without any geographical difference (over 85%), 2) on the other hand, for 318
regional pollen (ragweed, birch, cypress), IgE responses mirrored regional pollen 319
exposure, but IgG response varied depending on allergen sources: high for pollen 320
allergens cross-reacting with food allergens (Bet v 1 and other PR-10 allergen 321
components) and glycosylated components (e.g., Cup a 1 and Phl p 4)29, low for the other 322
pollen allergens with only respiratory exposure and no cross-reactivity with food allergens 323
(e.g., ragweed), and 3) for food allergens, IgG responses were frequent whereas IgE 324
responses were rare. These results indicate that contact with allergen by the oral route 325
may preferentially induce IgG responses whereas allergen contact by respiratory route 326 appears important for IgE sensitization. 327 Strengths and weaknesses 328 One strength lies in the solid phenotypic characterization of a large population, with a fair 329
distribution of asymptomatic subjects and subjects with asthma and/or rhinitis. As in 330
most epidemiological settings, the definition of asthma and rhinitis was based on a 331
standardized questionnaire, which might have lead to misclassification bias on the 332
disease status, but should not have biased our results on the effects of the geographical 333
area and routes of exposure in IgE and IgG recognition. As compared to the general 334
population, our study population is enriched with subjects with asthma and consequently 335
has higher percentages of IgE-sensitizations, leading to an increased statistical power to 336
address allergen-specific IgE-responses. Indeed, since the main aim of the present 337
manuscript was the parallel analysis of allergen-specific IgE and IgG responses towards a 338
comprehensive set of allergen molecules to dissect variations in geographic sensitization 339
profiles and possible routes of sensitization, a normal population would not have been 340
appropriate as the percentage of allergic subjects would have been too low and it would 341
have required a much larger sample size. This population selection should not have 342
affected our results on the geographical variability of IgE and IgG sensitisation, but does 343
not allow assessing the community-based prevalence of IgE and IgG responses. The study 344
is specific to France, but can help to understand and assess the differences between 345
ubiquitous and regional allergens in other countries as well as IgE and IgG responses to 346
allergens in general. 347
The effect of immunotherapy on specific-IgE or specific-IgG levels could not be tested 348 since only allergic patients had received this form of treatment and there will necessarily 349 be higher frequencies of IgE recognition in individuals who received AIT as compared to 350 those who did not. However, the frequency of subject who had received AIT was similar 351
across centres and even though AIT induces IgG it does not completely eliminate IgE 352 reactivity to the micro-arrayed allergens and therefore does not affect the geographic IgE 353 results. Although we do not have detailed information on AIT (as the targeted allergens) 354 we do not think that AIT might differentially influence the IgE/IgG profile according to the 355 allergen. For instance, it is unlikely that subjects in areas without birch pollen developed 356
IgG against this allergen (i.e. Bet v 1 and Bet v 1-related food allergens) due to AIT 357
because birch-pollen specific AIT was probably not prescribed in this area. Also, naturally 358
occurring IgG does not affect IgE recognition in the chip analysis because naturally 359
occurring IgG seems to react with epitopes different from those recognized by IgE 8. 360 Finally the sensitivity analysis conducted among subjects not having received AIT showed 361 strong robustness of the observed associations. 362 The exposure to allergens was not addressed at the individual level, but by study centre 363
locations. This ecological approach for exposure assessment might be a source of 364
exposure misclassification, characterized here by the Berkson error type which has been 365
shown to weaken the precision of the estimates, but as compared to the classical error 366
does not induce major bias on risk estimates 30. Also, we considered the center of
367 recruitment and did not take into account the residential history of the participants. This 368 may have lead to exposure misclassification because some individuals might have lived in 369 different areas with potentially different exposures. 370
A major strength relates to the use of the improved microarray technology, which 371
contains a larger number of important allergens than the commercial ISAC chips.15,16 The
372
MeDALL chip used in this study is as sensitive for IgE detection as the quantitative 373
ImmunoCAP assay and can be used also for the detection of allergen-specific IgG 374
responses with high specificity and sensitivity.15,16 Furthermore, the allergen repertoire
375
on the MeDALL chip covers most of the relevant allergen sources.17 Although IgG can
376 interfere with IgE binding on allergen-microarrays, we have proven that it does not affect 377 the sensitivity to pick up sensitizations. 17 Moreover, we found that IgE results were in 378 good agreement with results obtained by skin prick testing. 379 380 Interpretation of the results 381 In accordance with a recent cross-sectional analysis in the United States, IgE sensitisation 382
to at least one of the studied allergens did not vary across the French regions but 383
allergen-specific sensitisation against some allergen components exhibited geographical 384
variations.31 This may indicate that genetic susceptibility for sensitization, probably 385
similar across the country, favors an IgE immune response in the same percentage of the 386
population overall, but specificities of IgE reactions are linked to exposure. Indeed, chip 387
testing reveals that the molecular IgE sensitization profile for respiratory allergens in 388 France correlates very well with exposure data: some plants being prevalent in defined 389 areas (birch, ragweed and cypress) and some allergen sources being found across France 390 (grass, olive/ash pollen).32-34 Patients with a subclinical sensitization to birch pollen exist 391 in an area without atmospheric birch pollen exposure.35 For cypress pollen, IgE patterns 392
also reflect pollen dispersion but IgG is found in most participants because of the 393
carbohydrate nature of the allergen which makes it a pan-allergen.29 The lower IgE 394
recognition frequency of Der p 1 and Der p 2 in Lyon was a priori not expected but might 395
be related to factors like living habits. 396
Some respiratory allergens induce IgG only in few patients because they are poorly 397 immunogenic (e.g., Phl p 2) but nevertheless they often lead to IgE-sensitization.36 ,37 This 398 follows properties of the antigens themselves. We found that IgG reactivity to the highly 399 cross-reactive pollen allergens Phl p 12 and Bet v 2 (i.e., profilins) 38 and PR-10 proteins39 400 was very common in each region whereas IgE and IgG reactivity to another class of cross-401
reactive pollen allergens, the calcium-binding allergens from birch (Bet v 4) and timothy 402
grass (Phl p 7) was low in all regions. PR-10 and profilins are present in pollen and plant-403
derived foods whereas the polcalcins, i.e., calcium-binding allergen components are 404
present only in pollen. This probably explains the differences in IgG reactivity between 405
PR-10 and profillins (high) by comparison to calcium-binding components (low). This is 406 supported by a recent study suggesting that foodborne PR-10 allergens initiate an early 407 IgG-response to PR-10 molecules but no IgE-response.11 Certain house dust mite allergens 408 that are rare targets for IgE (Der p 10, Der p 11 and Der p 14, < 10% in our population) are 409
frequently recognized by IgG antibodies (>60% in our population). Interestingly, these 410
allergens are mainly present in mite bodies and therefore allergen contact occurs mainly 411
via the skin 40 or via cross-reactive food allergens (e.g., Der p 10 is cross-reactive with
412
tropomyosin from shrimps). 413
In conclusion, the results from the analysis of IgE and IgG responses against a 414
comprehensive set of respiratory and food allergens in the present study suggest that IgG 415
response is related to exposure via the respiratory tract, the gastrointestinal tract and 416
possibly via the skin whereas IgE sensitization occurs mainly when the subject is exposed 417
via the respiratory tract. However, only a fraction of these subjects develops IgE 418
antibodies.18 The results of the present study will be valuable for better understanding 419
when allergen-specific interventions like avoidance or immunotherapy should be 420 undertaken or not. 421 422 423
Acknowledgments
424 425 The authors thanks the EGEA cooperative group: 426 Coordination : V Siroux (epidemiology, PI since 2013); F Demenais (genetics); I Pin (clinical 427 aspects); R Nadif (biology); F Kauffmann (PI 1992-2012). 428 Respiratory epidemiology : Inserm U 700, Paris : M Korobaeff (Egea1), F Neukirch 429 (Egea1); Inserm U 707, Paris : I Annesi-Maesano (Egea1-2) ; Inserm CESP/U 1018, Villejuif : 430 F Kauffmann, N Le Moual, R Nadif, MP Oryszczyn (Egea1-2), R Varraso ; Inserm U 823, 431 Grenoble : V Siroux. 432 Genetics : Inserm U 393, Paris : J Feingold ; Inserm U 946, Paris : E Bouzigon, F Demenais, 433 MH Dizier ; CNG, Evry : I Gut (now CNAG, Barcelona, Spain), M Lathrop (now Univ McGill, 434 Montreal, Canada). 435 Clinical centers : Grenoble : I Pin, C Pison; Lyon : D Ecochard (Egea1), F Gormand, Y 436 Pacheco ; Marseille : D Charpin (Egea1), D Vervloet (Egea1-2) ; Montpellier : J Bousquet ; 437 Paris Cochin : A Lockhart (Egea1), R Matran (now in Lille) ; Paris Necker : E Paty (Egea1-2), 438 P Scheinmann (Egea1-2) ; Paris-Trousseau : A Grimfeld (Egea1-2), J Just. 439 Data and quality management : Inserm ex-U155 (Egea1) : J Hochez ; Inserm CESP/U 1018, 440 Villejuif : N Le Moual ; Inserm ex-U780 : C Ravault (Egea1-2) ; Inserm ex-U794 : N 441 Chateigner (Egea1-2) ; Grenoble : J Quentin-Ferran (Egea1-2). 442 The authors thank all those who participated in the setting of the study and in the various 443 aspects of the examinations involved: interviewers; technicians for lung function testing, 444 skin prick tests, and IgE determinations; coders; those involved in quality control and data 445 and sample management; and all those who supervised the study in all centers. They are 446 also grateful to the biobanks in Lille (CIC-Inserm), and Annemasse (Etablissement français 447 du sang) where biological samples are stored. They are indebted to all the individuals who 448 participated, without whom the study would not have been possible. 449The authors thanks the RNSA (Réseau National de Surveillance Aérobiologique), the 450 French aerobiology network in charge of the analysis of biological particles in air samples, 451 for providing access to the data of pollen concentrations across France. 452 The authors thank Rob Aalberse, Amsterdam, The Netherlands for thoughtful discussions. 453
The study was supported in part by Inserm Aviesan Itmo santé publique, the Scientific 454 committee “AGIR for chronic diseases”, grant F4605 of the Austrian Science Fund (FWF) 455 to RV and by the European Commission’s Seventh Framework 29 Program MeDALL under 456 grant agreement no. 261357. 457 458
References
459 1. Valenta R. The future of antigen-specific immunotherapy of allergy. Nat Rev 460 Immunol 2002;2:446-53. 461 2. Jenmalm MC, Bjorksten B. Development of immunoglobulin G subclass antibodies to 462 ovalbumin, birch and cat during the first eight years of life in atopic and non-atopic 463 children. Pediatr Allergy Immunol 1999;10:112-21. 464 3. Hofmaier S, Comberiati P, Matricardi PM. Immunoglobulin G in IgE-mediated allergy 465 and allergen-specific immunotherapy. Eur Ann Allergy Clin Immunol 2014;46:6-11. 466 4. Matsuoka T, Shamji MH, Durham SR. Allergen immunotherapy and tolerance. 467 Allergol Int 2013;62:403-13. 468 5. Akdis M, Akdis CA. Mechanisms of allergen-specific immunotherapy: multiple 469 suppressor factors at work in immune tolerance to allergens. J Allergy Clin Immunol 470 2014;133:621-31. 471 6. Larche M, Akdis CA, Valenta R. Immunological mechanisms of allergen-specific 472 immunotherapy. Nat Rev Immunol 2006;6:761-71. 473 7. Braza F, Chesne J, Castagnet S, Magnan A, Brouard S. Regulatory functions of B cells 474 in allergic diseases. Allergy 2014;69:1454-63. 475 8. Curin M, Swoboda I, Wollmann E, et al. Microarrayed dog, cat, and horse allergens 476 show weak correlation between allergen-specific IgE and IgG responses. J Allergy 477 Clin Immunol 2014;133:918-21 e6. 478 9. Lau S, Illi S, Platts-Mills TA, et al. Longitudinal study on the relationship between cat 479 allergen and endotoxin exposure, sensitization, cat-specific IgG and development of 480 asthma in childhood--report of the German Multicentre Allergy Study (MAS 90). 481 Allergy 2005;60:766-73. 482 10. Erwin EA, Woodfolk JA, James HR, Satinover SM, Platts-Mills TA. Changes in cat 483 specific IgE and IgG antibodies with decreased cat exposure. Ann Allergy Asthma 484 Immunol 2014;112:545-50 e1. 485 11. Hofmaier S, Hatzler L, Rohrbach A, et al. "Default" versus "pre-atopic" IgG responses 486 to foodborne and airborne pathogenesis-related group 10 protein molecules in 487birch-sensitized and nonatopic children. J Allergy Clin Immunol 2015;135:1367-74 488 e8. 489 12. Hiller R, Laffer S, Harwanegg C, et al. Microarrayed allergen molecules: diagnostic 490 gatekeepers for allergy treatment. FASEB J 2002;16:414-6. 491 13. Canonica GW, Ansotegui IJ, Pawankar R, et al. A WAO - ARIA - GA(2)LEN consensus 492 document on molecular-based allergy diagnostics. World Allergy Organ J 2013;6:17. 493 14. Melioli G, Bonifazi F, Bonini S, et al. The ImmunoCAP ISAC molecular allergology 494 approach in adult multi-sensitized Italian patients with respiratory symptoms. Clin 495 Biochem 2011;44:1005-11. 496 15. Bousquet J, Anto J, Auffray C, et al. MeDALL (Mechanisms of the Development of 497 ALLergy): an integrated approach from phenotypes to systems medicine. Allergy 498 2011;66:596-604. 499 16. Lupinek C, Wollmann E, Baar A, et al. Advances in allergen-microarray technology 500 for diagnosis and monitoring of allergy: the MeDALL allergen-chip. Methods 501 2014;66:106-19. 502 17. Skrindo I, Lupinek C, Valenta R, et al. The use of the MeDALL-chip to assess IgE 503 sensitization: a new diagnostic tool for allergic disease? Pediatr Allergy Immunol 504 2015;26:239-46. 505 18. Westman M, Lupinek C, Bousquet J, et al. Early childhood IgE reactivity to 506 pathogenesis-related class 10 proteins predicts allergic rhinitis in adolescence. J 507 Allergy Clin Immunol 2015;135:1199-206 e1-11. 508 19. Kauffmann F, Dizier MH, Annesi-Maesano I, et al. EGEA (Epidemiological study on 509 the Genetics and Environment of Asthma, bronchial hyperresponsiveness and 510 atopy)-- descriptive characteristics. Clin Exp Allergy 1999;29 Suppl 4:17-21. 511 20. Boudier A, Curjuric I, Basagana X, et al. Ten-year follow-up of cluster-based asthma 512 phenotypes in adults. A pooled analysis of three cohorts. Am J Respir Crit Care Med 513 2013;188:550-60. 514 21. Siroux V, Boudier A, Bousquet J, et al. Phenotypic determinants of uncontrolled 515 asthma. J Allergy Clin Immunol 2009;124:681-7. 516
22. Kauffmann F, Dizier MH. EGEA (Epidemiological study on the Genetics and 517 Environment of Asthma, bronchial hyperresponsiveness and atopy)--design issues. 518 EGEA Co-operative Group. Clin Exp Allergy 1995;25 Suppl 2:19-22. 519 23. Kauffmann F, Dizier MH, Pin I, et al. Epidemiological study of the genetics and 520 environment of asthma, bronchial hyperresponsiveness, and atopy: phenotype 521 issues. Am J Respir Crit Care Med 1997;156:S123-S9. 522 24. Wollmann E, Hamsten C, Sibanda E, et al. Natural clinical tolerance to peanut in 523 African patients is caused by poor allergenic activity of peanut IgE. Allergy 2015. 524 25. Thibaudon M. [The pollen-associated allergic risk in France]. Allerg Immunol (Paris) 525 2003;35:170-2. 526 26. Thibaudon M, Caillier J. Dévelopement temporel et géographique des allergènes 527 polliniques principaux en France: 1987-2001. Allerg Immunol (Paris) 2002;34:154-528 7. 529 27. Hatzler L, Panetta V, Lau S, et al. Molecular spreading and predictive value of 530 preclinical IgE response to Phleum pratense in children with hay fever. J Allergy Clin 531 Immunol 2012;130:894-901 e5. 532 28. Panzner P, Vachova M, Vitovcova P, Brodska P, Vlas T. A comprehensive analysis of 533 middle-European molecular sensitization profiles to pollen allergens. Int Arch 534 Allergy Immunol 2014;164:74-82. 535 29. Douladiris N, Savvatianos S, Roumpedaki I, Skevaki C, Mitsias D, Papadopoulos NG. A 536 molecular diagnostic algorithm to guide pollen immunotherapy in southern Europe: 537 towards component-resolved management of allergic diseases. Int Arch Allergy 538 Immunol 2013;162:163-72. 539 30. Armstrong BG. Effect of measurement error on epidemiological studies of 540 environmental and occupational exposures. Occup Environ Med 1998;55:651-6. 541 31. Salo PM, Arbes SJ, Jr., Jaramillo R, et al. Prevalence of allergic sensitization in the 542 United States: results from the National Health and Nutrition Examination Survey 543 (NHANES) 2005-2006. J Allergy Clin Immunol 2014;134:350-9. 544 32. Bousquet J, Guerin B, Hewitt B, Lim S, Michel FB. Allergy in the Mediterranean area. 545 III: Cross reactivity among Oleaceae pollens. Clin Allergy 1985;15:439-48. 546
33. Palomares O, Swoboda I, Villalba M, et al. The major allergen of olive pollen Ole e 1 is 547 a diagnostic marker for sensitization to Oleaceae. Int Arch Allergy Immunol 548 2006;141:110-8. 549 34. Castro L, Mas S, Barderas R, et al. Sal k 5, a member of the widespread Ole e 1-like 550 protein family, is a new allergen of Russian thistle (Salsola kali) pollen. Int Arch 551 Allergy Immunol 2014;163:142-53. 552 35. Yamagiwa M, Hattori R, Ito Y, et al. Birch-pollen sensitization in an area without 553 atmospheric birch pollens. Auris Nasus Larynx 2002;29:261-6. 554 36. Heiss S, Mahler V, Steiner R, et al. Component-resolved diagnosis (CRD) of type I 555 allergy with recombinant grass and tree pollen allergens by skin testing. J Invest 556 Dermatol 1999;113:830-7. 557 37. Vrtala S, Ball T, Spitzauer S, et al. Immunization with purified natural and 558 recombinant allergens induces mouse IgG1 antibodies that recognize similar 559 epitopes as human IgE and inhibit the human IgE-allergen interaction and allergen-560 induced basophil degranulation. J Immunol 1998;160:6137-44. 561 38. Valenta R, Duchene M, Ebner C, et al. Profilins constitute a novel family of functional 562 plant pan-allergens. J Exp Med 1992;175:377-85. 563 39. Ebner C, Hirschwehr R, Bauer L, et al. Identification of allergens in fruits and 564 vegetables: IgE cross-reactivities with the important birch pollen allergens Bet v 1 565 and Bet v 2 (birch profilin). J Allergy Clin Immunol 1995;95:962-9. 566 40. Banerjee S, Resch Y, Chen KW, et al. Der p 11 is a major allergen for house dust mite-567 allergic patients suffering from atopic dermatitis. J Invest Dermatol 2015;135:102-9. 568 569
TABLE I. Description of the study population (n=340) 570
571 n (%) / m (sd) Number of males (%) 159 (46.8 %) Mean age (±sd) 43.4 (±16.8) Status at recruitment Asthma cases, n (%) First-degree relatives of cases, n (%) Controls, n (%) 83 (24.4) 184 (54.1) 73 (21.5) Recruitment center Paris, n (%) Lyon, n (%) Marseille, n (%) Montpellier, n (%) Grenoble, n (%) 96 (28.2) 75 (22.1) 41 (12.0) 22 (6.5) 106 (31.2) Asthma ever, n (%) 170 (50 %) Asthma in the past 12 months, n (%) 138 (87.3 %) Allergic sensitization (≥1 positive SPT among the 11 allergen sources)*, n (%) 197 (57.9%) Total IgE > 100 IU/ml**, n (%) 145 (42.7 %) Allergic rhinitis ever, n (%) 176 (52.4 %) Allergic rhinitis in the past 12 months, n (%) 138 (44.8 %) Blood eosinophil counts > 250 mm3, n (%) 86 (25.4 %) Atopic dermatitis ever, n (%) 127 (37.6 %) FEV1 < 80% of predicted value, (%) 46 (13.6 %) Combined Asthma (ever) and allergic rhinitis (ever) phenotypes: No asthma and no rhinitis, n (%) No asthma but rhinitis, n (%) Asthma but no rhinitis, n (%) Asthma and rhinitis, n (%) 121 (31.0 %) 48 (14.3 %) 39 (11.6 %) 128 (38.1 %) *11 allergen sources were : cat, Dermatophagoides pteronyssinus, Blattella germanica, olive, birch, 572 Parietaria judaica, timothy grass, ragweed, Aspergillus, Cladosporium herbarum, Alternaria tenuis 573 ** The threshold of 100 IU/ml has been used as in many other studies 574
TABLE II. Allergen specific IgE and IgG description 575
In all (n=340) In subjects without AIT* (n=258)
IgE ≥ 0.3
ISU
IgG ≥ 0.5 ISU IgE ≥ 0.3 ISU IgG ≥ 0.5 ISU
Allergen-source Allergen n % n % n % n % Inhaled allergens Birch rBet v 1 34 10.0 225 66.6 18 7.0 165 64.2 rBet v 4 13 3.8 109 32.2 3 1.2 79 30.7 rBet v 2 10 2.9 288 85.2 3 1.2 218 84.8 Olive rOle e 1 71 20.9 220 65.1 39 15.1 157 61.1 nOle e 7 5 1.5 67 19.8 2 0.8 46 17.9 rOle e 9 2 0.6 338 100.0 1 0.4 257 100.0 Cypress nCup a 1 62 18.2 255 75.4 32 12.4 193 75.1 Timothy Grass rPhl p 1 11 5 33.8 322 95.3 67 26.0 244 94.9 rPhl p 2 52 15.3 115 34.0 25 9.7 76 29.6 nPhl p 4 76 22.4 282 83.4 35 13.6 209 81.3 rPhl p 5 62 18.2 218 64.5 23 8.9 161 62.6 rPhl p 6 49 14.4 229 67.8 20 7.8 169 65.8 rPhl p 7 13 3.8 94 27.8 3 1.2 68 26.5 rPhl p 11 23 6.8 133 39.3 7 2.7 93 36.2 rPhl p 12 6 1.8 310 91.7 236 91.8 Ragweed nAmb a 1 13 3.8 109 32.2 8 3.1 81 31.5 House dust mite nDer p 1 83 24.4 317 93.8 43 16.7 238 92.6 rDer p 2 93 27.4 278 82.2 49 19.0 206 80.2 rDer p 4 54 15.9 142 42.0 27 10.5 102 39.7 rDer p 5 56 16.5 321 95.0 23 8.9 246 95.7 rDer p 7 45 13.2 301 89.1 16 6.2 228 88.7 rDer p 10 31 9.1 214 63.3 13 5.0 156 60.7 rDer p 11 15 4.4 331 97.9 6 2.3 251 97.7 rDer p 14 7 2.1 334 98.8 2 0.8 254 98.8 rDer p 15 15 4.4 327 96.7 6 2.3 249 96.9 rDer p 18 17 5.0 328 97.0 4 1.6 250 97.3 rDer p 21 34 10.0 334 98.8 14 5.4 255 99.2 rDer p 23 93 27.4 335 99.1 50 19.4 255 99.2 rclone 16 33 9.7 292 86.4 12 4.7 218 84.8 Cat rFel d 1 81 23.8 306 90.5 41 15.9 233 90.7 nFel d 2 25 7.4 179 53.0 12 4.7 130 50.6 rFel d 4 18 5.3 253 74.9 6 2.3 192 74.7 Dog rCan f 1 22 6.5 202 59.8 7 2.7 152 59.1 rCan f 2 8 2.4 188 55.6 2 0.8 139 54.1 nCan f 3 8 2.4 164 48.5 3 1.2 121 47.1 rCan f 4 16 4.7 296 87.6 2 0.8 228 88.7 rCan f 5 38 11.2 265 78.4 18 7.0 198 77.0 rCan f 6 16 4.7 277 82.0 6 2.3 212 82.5 Food allergens Apple rMal d 1 26 7.6 284 84.0 14 5.4 216 84.0 Hazelnut rCor a 1.0401 24 7.1 234 69.2 12 4.7 176 68.5 Peanut rAra h 8 16 4.7 233 68.9 6 2.3 180 70.0
Peach rPru p 1 20 5.9 242 71.6 10 3.9 180 70.0 Soy rGly m 4 8 2.4 292 86.4 2 0.8 221 86.0 Milk nBos d 4 1 0.3 299 88.5 1 0.4 232 90.3 nBos d 8 0 0.0 309 91.4 234 91.1 Egg nGal d 1 2 0.6 289 85.5 217 84.4 Codfish rGad c 1 0 0.0 95 28.1 72 28.0 * Allergen Immunotherapy 576
TABLE III. Adjusted odds ratios* for different centers of recruitment for being IgE- or IgG-positive to different airborne allergens 577
578
IgE (<0.3; ≥0.3) IgG (<0.5; ≥0.5)
Allergen Center OR 95% CI Lower 95% CI Upper value p Global p value OR 95% CI Lower 95% CI Upper value p Global p value Amb a 1 Lyon - 3.56 1.81 7.02 <0.01 0.001 Marseille - 2.52 1.09 5.85 0.03 Montpellier - 0.79 0.23 2.67 0.70 Grenoble - 1.32 0.69 2.51 0.40 Bet v 1 Lyon - 1.57 0.8 3.09 0.19 0.5 Marseille - 1.64 0.7 3.83 0.26 Montpellier - 0.93 0.34 2.54 0.88 Grenoble - 1.53 0.83 2.83 0.17 Cup a 1 Lyon 0.67 0.24 1.84 0.44 0.0009 1.38 0.66 2.87 0.39 0.29 Marseille 3.56 1.17 10.9 0.03 1.7 0.64 4.49 0.29 Montpellier 7.37 2.15 25.3 <0.01 7.79 0.98 62.2 0.05 Grenoble 0.85 0.36 1.96 0.7 1.05 0.56 1.96 0.88 Phl p 1 Lyon 0.81 0.36 1.83 0.61 0.69 4.87 0.57 41.7 0.15 - Marseille 1.29 0.47 3.58 0.62 - Montpellier 0.68 0.2 2.26 0.52 1.28 0.14 11.9 0.83 Grenoble 1.28 0.63 2.6 0.5 1.33 0.42 4.2 0.62 Der p 1 Lyon 0.37 0.15 0.96 0.04 0.01 13.6 1.68 110 0.01 - Marseille 0.28 0.07 1.12 0.07 - Montpellier 1.00 0.28 3.58 0.99 0.81 0.21 3.08 0.76 Grenoble 1.53 0.75 3.11 0.24 4.22 1.28 13.9 0.02 Der p 2 Lyon 0.32 0.13 0.81 0.02 0.004 2.48 1.05 5.85 0.04 0.12 Marseille 0.41 0.13 1.36 0.15 1.42 0.54 3.73 0.48 Montpellier 0.91 0.27 3.07 0.88 7.1 0.86 58.7 0.07 Grenoble 1.67 0.83 3.38 0.15 1.87 0.89 3.9 0.1
*Odds Ratio (reference: Paris) adjusted for age, sex, asthma status and rhinitis status 579 Some ORs could not be estimated because of sample size (represented by - in the table) 580 ORs associated with a p value < 0.05 are presented in bold. 581 582
Figure legends
FIG 1. IgE and IgG recognition frequencies and intensities for genuine pollen marker allergens from (A) ragweed (Amb a 1), (B) birch (Bet v 1), (C) cypress (Cup a 1), (D) olive/ash (Ole e 1), (E) timothy grass (Phl p 1) and for cross-reactive pollen allergens (F) timothy grass polcalcin(Phl p 7), (G) birch polcalcin (Bet v 4), (H) timothy grass profilin (Phl p 12) and (I) birch profilin (Bet v 2), and for the Bet v 1-related food allergen from (J) apple (Mal d 1) in different regions of France. Shown are the percentages of subjects (y-axes) with IgE (upper panel) and IgG reactivity (middle panel) to the allergens in the different cities of France (x-axes) and the pollen counts in the different areas of France (lower panels). Antibody levels are colour-coded and shown in ISU (ISAC standardized units).
P values assessing the differences across centres were estimated from the non-parametric Kruskal-Wallis test.
FIG 2. IgE and IgG recognition frequencies and intensities for respiratory house dust mite allergens derived from mite feces, i.e., (A) Der p 1, (B) Der p 2, (C) Der p 23 and from mite bodies, i.e., (D) Der p 10, (F) Der p 11 and (F) Der p 14, respectively. Shown are the percentages of subjects (y-axes) with IgE (upper panel) and IgG reactivity (lower panel) to the allergens in the different cities of France (x-axes). Antibody levels are color-coded and shown in ISU.
P values assessing the differences across centers were estimated from the non-parametric Kruskal-Wallis test. FIG 3. IgG recognition frequencies and intensities for classical food allergens derived from (A) milk (Bos d 4), (B) egg (Gal d 1) and (C) fish (Gad c 1). Shown are the percentages of subjects (y-axes) with IgG reactivity to the allergens in the different cities of France (x-axes). Antibody levels are color-coded and shown in ISU.
P values assessing the differences across centers were estimated from the non-parametric Kruskal-Wallis test.
Online repository
Specific IgE and IgG measured by the MeDALL allergen-chip depend on
allergen and route of exposure - the EGEA study
Valérie Siroux a,b,c, Christian Lupinekd, Yvonne Reschd, Mirela Curind, Jocelyne Just e, f , Thomas Keil g, h, Renata Kissd, Karin Lodrup Carlsen i, j , Erik Melén k,l, Rachel Nadif m, n, Isabelle Pin a,b,c, Ingebjørg Skrindo j,o, Susanne Vrtalad, p, Magnus Wickmanl, m, Josep Maria
TABLE EI. Comparison of included and non-included subjects Subjects without asthma Subjects with asthma Non-Included Included P value Non-Included Included P value n 697 170 507 170 Age, m (sd) 46.3 (16.0) 46.8 (16.7) 0.68 38.8 (16.8) 40.0 (16.4) 0.42 Sex, %males 46.6 47.7 0.81 49.1 41.2 0.07 Center of recruitment Paris, % Lyon, % Marseille, % Montpellier, % Grenoble, % 26.7 17.9 17.8 7.0 30.6 27.7 22.9 14.1 5.9 29.4 0.51 35.1 13.0 16.4 8.1 27.4 28.8 21.2 10.0 7.1 32.9 0.02 Cat ownership 1, % 53.2 48.2 0.24 49.1 52.9 0.39 Allergic rhinitis ever, % 30.2 28.4 0.65 70.1 76.7 0.10 Allergic sensitization (≥1SPT among 12 allergens), % 38.9 34.7 0.33 76.3 81.2 0.20 Total IgE>100IU/ml, % 30.7 24.7 0.13 59.2 60.6 0.75 1 current cat ownership or in childhood
TABLE E2. Agreement between SPT and allergen specific-IgE for those 7 allergen sources that showed a prevalence for positive SPT > 5% in the study population. number of components on the MeDALL chip, n positive SPT, % Allergen specific-IgE ≥0.3 for at least one of the allergen components, % Cohen Kappa coefficient Timothy Grass 8 33.5 39.4 0.76 House dust mite 15 33.5 34.7 0.83 Cat 3 21.8 23.8 0.76 Olive 3 20.6 21.2 0.79 Birch 3 10.6 13.8 0.71 Alternaria 2 8.8 9.4 0.65 Ragweed 1 5.9 3.8 0.71
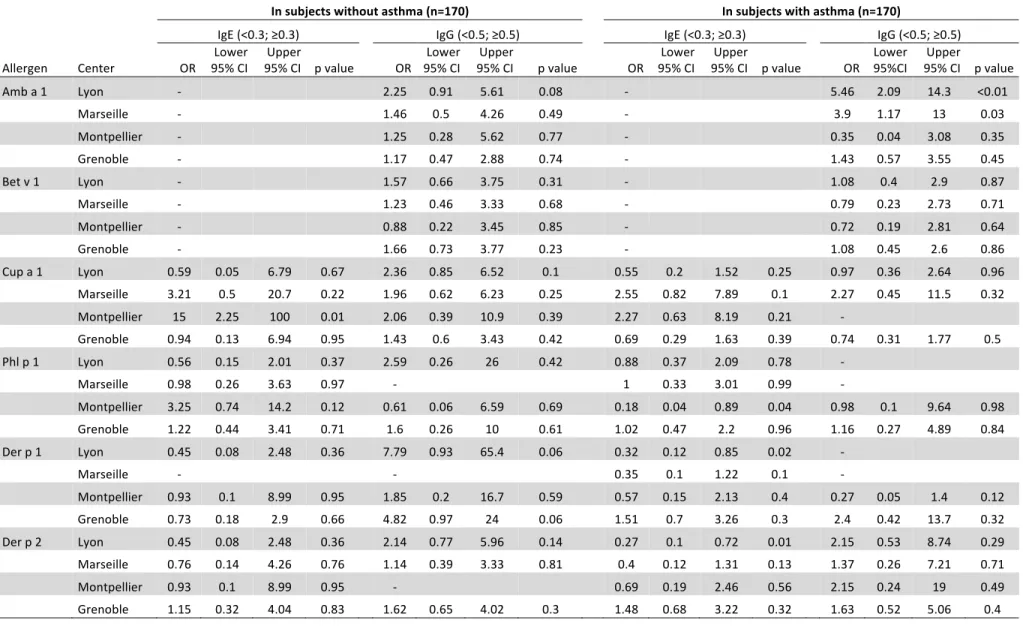
TABLE E3. Unadjusted odds ratios for different centers of recruitment for being IgE- or IgG-positive to different airborne allergens (reference: Paris), by asthma status
In subjects without asthma (n=170) In subjects with asthma (n=170)
IgE (<0.3; ≥0.3) IgG (<0.5; ≥0.5) IgE (<0.3; ≥0.3) IgG (<0.5; ≥0.5)
Allergen Center OR 95% CILower
Upper
95% CI p value OR 95% CI Lower 95% CI Upper p value OR 95% CI Lower 95% CI p value Upper OR Lower 95%CI Upper 95% CI p value
Amb a 1 Lyon - 2.25 0.91 5.61 0.08 - 5.46 2.09 14.3 <0.01 Marseille - 1.46 0.5 4.26 0.49 - 3.9 1.17 13 0.03 Montpellier - 1.25 0.28 5.62 0.77 - 0.35 0.04 3.08 0.35 Grenoble - 1.17 0.47 2.88 0.74 - 1.43 0.57 3.55 0.45 Bet v 1 Lyon - 1.57 0.66 3.75 0.31 - 1.08 0.4 2.9 0.87 Marseille - 1.23 0.46 3.33 0.68 - 0.79 0.23 2.73 0.71 Montpellier - 0.88 0.22 3.45 0.85 - 0.72 0.19 2.81 0.64 Grenoble - 1.66 0.73 3.77 0.23 - 1.08 0.45 2.6 0.86 Cup a 1 Lyon 0.59 0.05 6.79 0.67 2.36 0.85 6.52 0.1 0.55 0.2 1.52 0.25 0.97 0.36 2.64 0.96 Marseille 3.21 0.5 20.7 0.22 1.96 0.62 6.23 0.25 2.55 0.82 7.89 0.1 2.27 0.45 11.5 0.32 Montpellier 15 2.25 100 0.01 2.06 0.39 10.9 0.39 2.27 0.63 8.19 0.21 - Grenoble 0.94 0.13 6.94 0.95 1.43 0.6 3.43 0.42 0.69 0.29 1.63 0.39 0.74 0.31 1.77 0.5 Phl p 1 Lyon 0.56 0.15 2.01 0.37 2.59 0.26 26 0.42 0.88 0.37 2.09 0.78 - Marseille 0.98 0.26 3.63 0.97 - 1 0.33 3.01 0.99 - Montpellier 3.25 0.74 14.2 0.12 0.61 0.06 6.59 0.69 0.18 0.04 0.89 0.04 0.98 0.1 9.64 0.98 Grenoble 1.22 0.44 3.41 0.71 1.6 0.26 10 0.61 1.02 0.47 2.2 0.96 1.16 0.27 4.89 0.84 Der p 1 Lyon 0.45 0.08 2.48 0.36 7.79 0.93 65.4 0.06 0.32 0.12 0.85 0.02 - Marseille - - 0.35 0.1 1.22 0.1 - Montpellier 0.93 0.1 8.99 0.95 1.85 0.2 16.7 0.59 0.57 0.15 2.13 0.4 0.27 0.05 1.4 0.12 Grenoble 0.73 0.18 2.9 0.66 4.82 0.97 24 0.06 1.51 0.7 3.26 0.3 2.4 0.42 13.7 0.32 Der p 2 Lyon 0.45 0.08 2.48 0.36 2.14 0.77 5.96 0.14 0.27 0.1 0.72 0.01 2.15 0.53 8.74 0.29 Marseille 0.76 0.14 4.26 0.76 1.14 0.39 3.33 0.81 0.4 0.12 1.31 0.13 1.37 0.26 7.21 0.71 Montpellier 0.93 0.1 8.99 0.95 - 0.69 0.19 2.46 0.56 2.15 0.24 19 0.49 Grenoble 1.15 0.32 4.04 0.83 1.62 0.65 4.02 0.3 1.48 0.68 3.22 0.32 1.63 0.52 5.06 0.4
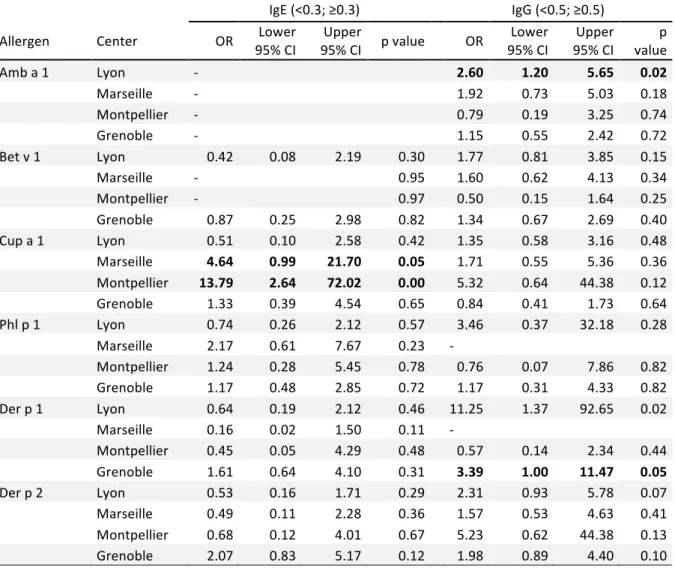
TABLE E4. Adjusted odds ratios for different centers of recruitment for being IgE- or IgG-positive to different allergens (reference: Paris) among subjects without allergen immunotherapy
IgE (<0.3; ≥0.3) IgG (<0.5; ≥0.5)
Allergen Center OR 95% CI Lower 95% CI p value Upper OR 95% CI Lower 95% CI Upper value p
Amb a 1 Lyon - 2.60 1.20 5.65 0.02 Marseille - 1.92 0.73 5.03 0.18 Montpellier - 0.79 0.19 3.25 0.74 Grenoble - 1.15 0.55 2.42 0.72 Bet v 1 Lyon 0.42 0.08 2.19 0.30 1.77 0.81 3.85 0.15 Marseille - 0.95 1.60 0.62 4.13 0.34 Montpellier - 0.97 0.50 0.15 1.64 0.25 Grenoble 0.87 0.25 2.98 0.82 1.34 0.67 2.69 0.40 Cup a 1 Lyon 0.51 0.10 2.58 0.42 1.35 0.58 3.16 0.48 Marseille 4.64 0.99 21.70 0.05 1.71 0.55 5.36 0.36 Montpellier 13.79 2.64 72.02 0.00 5.32 0.64 44.38 0.12 Grenoble 1.33 0.39 4.54 0.65 0.84 0.41 1.73 0.64 Phl p 1 Lyon 0.74 0.26 2.12 0.57 3.46 0.37 32.18 0.28 Marseille 2.17 0.61 7.67 0.23 - Montpellier 1.24 0.28 5.45 0.78 0.76 0.07 7.86 0.82 Grenoble 1.17 0.48 2.85 0.72 1.17 0.31 4.33 0.82 Der p 1 Lyon 0.64 0.19 2.12 0.46 11.25 1.37 92.65 0.02 Marseille 0.16 0.02 1.50 0.11 - Montpellier 0.45 0.05 4.29 0.48 0.57 0.14 2.34 0.44 Grenoble 1.61 0.64 4.10 0.31 3.39 1.00 11.47 0.05 Der p 2 Lyon 0.53 0.16 1.71 0.29 2.31 0.93 5.78 0.07 Marseille 0.49 0.11 2.28 0.36 1.57 0.53 4.63 0.41 Montpellier 0.68 0.12 4.01 0.67 5.23 0.62 44.38 0.13 Grenoble 2.07 0.83 5.17 0.12 1.98 0.89 4.40 0.10 *Odds Ratio (reference: Paris) adjusted for age, sex, asthma status and rhinitis status Some ORs could not be estimated because of sample size (represented by - in the table) ORs associated with a p value≤0.05 are presented in bold.
E-FIGURE Legend
FIG E1. IgE and IgG recognition frequencies and intensities in subjects not reported allergen immunotherapy for (A) ragweed (Am b a1), (B) birch (Bet v 1), (C) Cypress (cup a 1), (D) timothy grass (Phl p 1), (E) houst dust mit (Der p 1), (F) house dust mite (Der p 10) and (G) apple (Mal d 1)