HAL Id: hal-01557132
https://hal.archives-ouvertes.fr/hal-01557132
Submitted on 5 Jul 2017
HAL is a multi-disciplinary open access
archive for the deposit and dissemination of
sci-entific research documents, whether they are
pub-lished or not. The documents may come from
teaching and research institutions in France or
abroad, or from public or private research centers.
L’archive ouverte pluridisciplinaire HAL, est
destinée au dépôt et à la diffusion de documents
scientifiques de niveau recherche, publiés ou non,
émanant des établissements d’enseignement et de
recherche français ou étrangers, des laboratoires
publics ou privés.
Characterizing long-range correlations in
DNA-sequences from wavelet analysis
Alain Arneodo, Emmanuel Bacry, P. V. Graves, Jean-François Muzy
To cite this version:
Alain Arneodo, Emmanuel Bacry, P. V. Graves, Jean-François Muzy. Characterizing long-range
corre-lations in DNA-sequences from wavelet analysis. Physical Review Letters, American Physical Society,
1995, 74 (16), pp.3293-3296. �10.1103/PhysRevLett.74.3293�. �hal-01557132�
VOLUME 74,NUMBER 16
PH
YS
ICAL
REVIEW
LETTERS
17APRIL1995
Characterizing
Long-Range Correlations
in DNA
Sequences from Wavelet
Analysis
A.Arneodo, '
E.
Bacry,P.
V.
Graves, andJ.
F.
Muzy''Centre de Recherche Paul Pascal, Avenue Schweitzer, 33600Pessac, France
Universite de Paris VII, Unite Fondamentale de Recherche de Mathematiques, Tour 45-55,2 Place Jussieu,
7525l Paris Cedex 05, France
Institut de Biologic et de Genetique Cellulaire,
l
rue C. Saint Saens, 33077Bordeaux, France(Received 22 September 1994)
The fractal scaling properties ofDNA sequences are analyzed using the wavelet transform. Because the wavelet transform microscope can be made blind to the "patchiness" of genomic sequences, we demonstrate and quantify the existence of long-range correlations in genes containing introns and
noncoding regions. Moreover, the fluctuations in the patchy landscapes of DNA walks are found
tobe homogeneous with Gaussian statistics.
PACS numbers: 87.10.+e,05.40.+j,07.07.—t, 72.70.+m
1
Tp(xo,
a)
=-a x(x)t/
(
)
dx,
where xo is the space parameter and a
()
0) the scale parameter. The main advantageof
using the WT forThe possible relevance
of
scale invariance and fractalconcepts to the structural complexity
of
genomic DNA has been the subjectof
considerable recent interest.Dur-ing the past few years, there has been intense discussion about the existence and the nature
of
long-rangecorre-lations within DNA sequences [1
—
6].
But despite theefforts spent, it is still an open question whether the long-range correlation properties are different forintronless and
intron-containing coding regions. On more fundamental ground, there is still continuing debate as to whether the reported long-range correlations really mean alack
of
in-dependence at long distances orsimply refIect the "patchi-ness" (bias in nucleotide composition)of
DNA sequences[1
—
6].
Oneof
the main reasons forthis controversialsitu-ation isthat the different techniques
(e.
g.,DNA walk,cor-relation function, and power spectrum analyses) used, so far, for characterizing the presence
of
long-range correla-tions are not well adapted to study patchy sequences[6].
In that respect, there have been some attempts to elimi-nate local patchiness using ad hoc methods such as the
so-called "min-max"
[1]
and "detrended fiuctuationanaly-sis" [4(c)]
methods. The purposeof
this Letter is toadvo-cate the use
of
a new technique, the wavelet tranform[7]
(WT), which has proven to be well suited for character-izing the scaling propertiesof
fractal objects even in thepresence
of
low-frequency trends[8].
We will proceed to a statistical analysisof
DNA sequences by applyingthe wavelet transform modulus maxima (WTMM) method
[8(b)]
that has been recently proposed as a generalized multifractal formalism forfractal functions.The WT is a space-scale analysis which consists
of
ex-panding signals in termsof
wavelets that are constructed from a single function, the analyzing waveletP,
by meansof
dilations and translations[7].
The WTof
a functions(x) is defined as
analyzing the regularity
of
a function s is its ability to eliminate polynomial behavior by an appropriate choiceof
the waveletP.
Indeed,if
s has, at the point xo,a local scaling (Holder) exponent h(xo)
E
]n,n+
1[,
in the sense that, around xo, Is(x)—P„(x)I
—
Ix—
xoI"",
whereP„(x)
is some order-n polynomial, then one can easily prove[8]
that T&(xo,a)
—
a"
'"~,provided the firstn
+
1 momentsof
iver are zero[fx
ill(x)dx=
0, 0~
m
~
n] Ther.efore the WT turns out to be a very powerful tool to detect and characterize singularities, even when they are masked by a smooth behavior. This property will beof
fundamental importance to break free from the intrinsic patchinessof
DNA sequences withoutusing any ad hoc recipe. In this work, we will use
the derivatives
of
the Gaussian function as analyzing wavelets: $1~1=
d~(e'
t2)/dx~ (the first N momentsof
/~~1 are vanishing).The WTMM method
[8(b)]
is a natural generalizationof
classical box-counting techniques. Itconsistsof
inves-tigating the scaling behaviorof
some partition functions defined in termsof
wavelet coefficients,Z(q,
a)=
P
sup IT~(x, a')I—
~~a1,(2)
IEg(a)-(x,a')El
where q
E
R.
The sum is taken over the WT skeletondefined at each scale a by the local maxima
of
ITp(x, a)l considered as a functionof x,
these WTMM are disposed on connected curves called maxima lines; the set X(a) of
all maxima lines that exist at scale a indicates how to po-sition the wavelets("
generalized oscillatingboxes")
in or-der to obtain a partition at this scale. In the frameworkof
this wavelet-based multifractal formalism,r(q)
is the Legendre transformof
the singularity spectrum D(h)de-fined as the Hausdorff dimension
of
the setof
points xwhere the Holder exponent is h. Homogeneous
fractal
functions
(i.e.
,functions with a unique Holder exponent h)are characterized by a linear ~(q) spectrum (h
=
Br/Bq).
On the contrary, a nonlinearr(q)
curve is the signatureof
nonhomogeneous functions that displays multifractal prop-erties
[i.e.
,h(x) is a fiuctuating quantity that depends uponVOLUME 74, NUMBER 16
PH
YS
ICAL
REVIEW
LETTERS
17AvR&L 1995x].
For some specific valuesof
q,r(q)
has a well-known meaning. Forexample,—
r(0)
can be identified tothefrac-tal dimension (capacity)
of
the set where s is not smooth;r(1)
is related to the capacityof
the graphof
the consid-ered function; furthermore,r(2)
is related to the scaling exponentP of
the spectral density:5(
f)
=
~s(f)
~—
f
with
P
=
2+ r(2).
Thusr(2)
4
0indicates the presenceof
long-range correlations. Previous studiesof
DNA se-quences [1—6]
have mainly focused on the estimateof
thepower-law exponents
of
the rms fluctuationsof
the DNAwalk or the autocorrelation function, which are simply
re-lated to the power spectrum exponent
P
and thus tor(2).
For its ability to resolve multifractal scaling via the esti-mate
of
the entirer(q)
spectrum, the WTMM method is a definite step beyond the techniques used so far in the lit-erature. Its reliability has been tested[8(b)]
on various experimental and mathematical examples including frac-tional Brownian motions[9]
(FBM).
TheFBM's
BH(x)are Gaussian stochastic processes
of
zero mean with sta-tionary increments, which are indexed by a parameter H (0(
H(
1) that accounts for the presence (H4 -)
or1
2 the absence (H
=
z)of
correlations between increments. TheFBM's
are statistically homogeneous fractals charac-terized by a single Holder exponent h=
H and thus by ar(q)
spectrum which is a linear functionof
slopeH:
r(q)
=
qH—
1.As a first application
of
the WTMM method in abio-logical context, this study isdevoted to the statistical analy-sis
of 70
human DNA sequences, extracted from theEMBL
data bank and long enough (L~
6000nucleotides) to make the fractal analysis meaningful with respect to finite-size effects[4(b)].
We processed separately the en-tire genes, the coding (individual exons, cDNA s)and thenoncoding (individual introns, flanks) regions, provided the length
of
these subsequences exceed2000
nucleotides.To graphically portray these sequences, we followed the strategy originally proposed in
[1],
which consistsof
transforming them into random walks by defining anincremental variable that associates to the position i the value
y(i)
=
1 for purine (A,6)
or—
1 for pyrimidine(C, T) The graph
of
the D. NA walk defined by thecu-mulative variable s(x)
=
g;,
g(i)
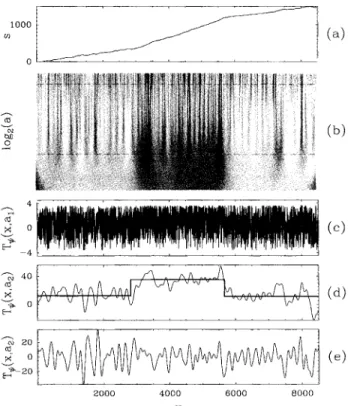
is plotted in Fig. 1(a) for the human desmoplakin I cDNA. The patchinessof
this DNA sequence ispatent; one clearly recognizes three regionsof
different strand bias. Figure1(b)
shows the WT space-scale representationof
this DNA signal when using order 1 analyzing wavelet Pl' . This WT displays a treelike structure from large to small scales, that looks qualitatively similar to the fractal branching observed in the WT representationof
Brownian or turbulent signals[8].
In Figs.1(c)
and1(d)
two horizontal cuts T&ii~(x,a)
are shown at two different scales a=
a~=
32 anda2
=
512 that are represented by the dashed lines in Fig.1(b).
When focusing the WT microscope at smallscale a
=
ai in Fig.1(c),
since P~') is orthogonal tocon-stants, one filters the local (high frequency) fluctuations
1000 0
j
40—on/br
3 nin 0 2000 4000 X 6000 BOOOFIG. 1. WTanalysis ofthe human desmoplakin I cDNA (L
=
8499). (a) DNA walk displacement s(x) (excess of purines
over pyrimidines) vs nucleotide distances x. (b) WT of s(x)
computed with the analyzing wavelet Pi' '
T~(i)(x,a) is coded,
independently at each scale a,using 32grey levels from white
[minT&~i~(x, a)]toblack [maxT&ii~(x, a)];small scales are at the
top. (c)T&~i~(x,a
=
a&)vs x for a&=
32. (d) T&ii~(x,a=
a&)vs x for a2
=
512. (e) Same analysis as in (d) but with the analyzing wavelet Pi2'.of s(x),
i.e.
, the fluctuations over a characteristic lengthof
the orderof
ai=
32nucleotides. When increasing the WT magnification in Fig.1(d),
one realizes that thesefluctuations actually occur around three successive linear trends; P~') not being blind to linear behavior, the WT
coefficients fluctuate about nonzero constant behavior
that correspond to the slopes
of
those linear trends. Even though this phenomenon is more pronounced whenprogressively increasing the scale parameter
a,
itis indeed present at all scales and drastically affects the fractal branchingof
theWT.
In Fig.1(e)
at the same coarsescale a
=
a2 as in Fig.1(d),
the fluctuationsof
the WTcoefficients are shown as computed with the order-2 wavelet /~2). The WT microscope being now orthogonal also to linear behavior, the WT coefficients fluctuate about zero and one does not see the inhuence
of
the strandbias anymore. Furthermore, by considering successively Pi3),P~"),. . .,one can hope to eliminate more complicated
nonlinear trends, with the ultimate goal
of
filtering the fractal underlying structure that might be responsiblefor the presence
of
long-range correlations in DNA sequences[10].
VOLUME 74,NUMBER 16
PH
YSICAL
REVIEW
LETTERS
17APR&r 1995InFigs. 2(a) —
2(c)
typical data are reported coming fromthe quantitative application
of
the WTMM method to the DNA walk graph corresponding to an intron-containing sequence (L=
73 326) which has been widelystud-ied in previous works
[1,
6(b),
6(c)]:
the humanbeta-globin intergenomic sequence (gene bank name HHUMHBB). First, let us mention that the patchy structure
of
this sequence is a little trickier than the oneof
the cDNA sequence in Fig. 1(a), in so far as it is not so easily amenable to ad hoc detrending methods such asthe min-max procedure
[1].
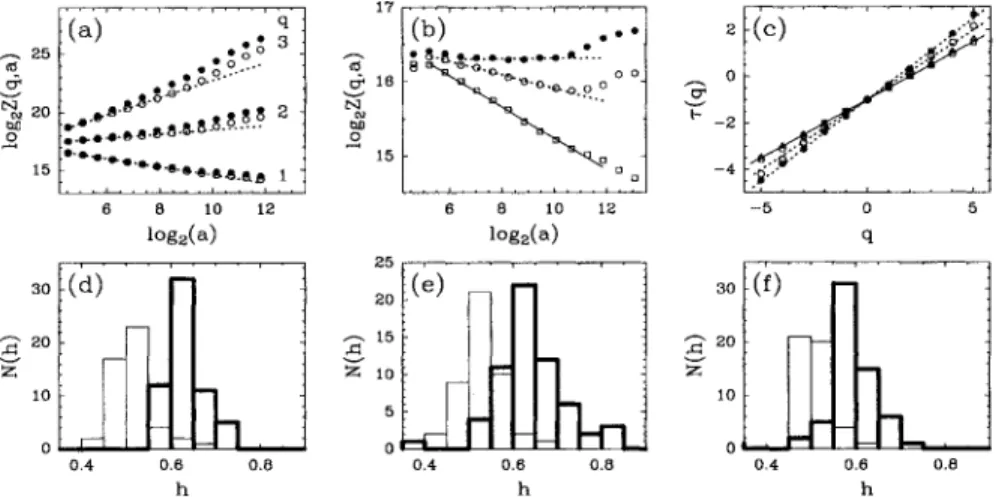
Figures 2(a) and2(b)
display plotsof
IogzZ(q,a)
vs log&a for some valuesof
q; two setsof
data are represented corresponding to computations performed with P(') (~
)
and Pl )(o),
respectively. Whilethe scaling behavior expected from Eq. (2) seems to operate over a wide range
of
scales when using P(), itdoes not show up so clearly for the data obtained with
P(')
forwhich some continuous (nonlinear) crossover phe-nomenon are observed as the signatureof
the breakingof
the scale invariance by the extent patchiness
of
the DNA walk[6(b)].
The overallr(q)
spectrum obtained with P() using a linear regression fitof
the data is comparedin Fig.
2(c)
to the corresponding spectrum(U)
derivedfor the same sequence but after randomly shuffling the nucleotides. The data for both the true and the shuffled
HHUMHBB sequences remarkably fall on straight lines which are the hallmark
of
homogeneous fractal functions. The corresponding unique Holder exponents can be estimated by fitting the slope hof
these straight lines; thevalue extracted for the original sequence h
=
0.
60~
0.
02[7(2)
=
0.
20~
0.
02] is significantly different from the expected value h=
0.
50~
0.
02[~(2)
=
0.
00~
0.
02] ob-tained for the uncorrelated random shuffled sequence (the error bars have been estimated from the fluctuationsof
h17
observed when splitting the original signals in samples
of
lengthI =
2000). We checked the reliabilityof
thismeasurement by reproducing this WTMM analysis with
higher order analyzing wavelets
(P
",
P'
').
Let us point out that the value h=
0.
60is clearly lower than previous estimates reported in the literature,e.
g., h=
0.71 in[1]
or h=
0.67 in[6(c)].
Note that ifwe had used the inap-propriate analyzing waveletP
'l, we would have obtained a similar biased estimate h=
0.
70~
0.03.
Therefore theWTMM method not only corroborates the existence
of
long-range correlations in this intron-containing sequence
[~(2)
)
0],
but it also provides a very efficient methodol-ogy to correct some systematic overestimates reported inprevious works. In Fig.
2(c)
the ~(q) spectrum computedwhen analyzing (using P( )) the coding DNA sequence portrayed in Fig. 1(a) is also shown for comparison.
The data
(6)
are almost indistinguishable from those previously obtained from the shuffled sequence; the~(q) spectrum is linear with a slope h
=
0.
49~
0.
02, as expected for homogeneous fractal fluctuations that do not display long-range correlations.Actually the linearity
of
ther(q)
spectrum turns out tobe a general result for all the DNA walks that we
con-sidered. In Figs.
2(d) —
2(f)
the resultsof
a systematicin-vestigation
of
our statistical sampleof 70
human genomic sequences are summarized under the formof
histogramsof
Holder exponent values. In order to test the robust-nessof
our results with respect to the rule used to map the DNA sequences toDNA walks, we reproduced our original analysis based on purine (A,G) vs pyrimidine(C, T)
dis-tinction [Fig.2(d)],
for the two other possible choicesof
identifying two base pairs [Figs. 2(e)and
2(f)].
Whatever the association rule, the histograms obtained forindivid-ual introns are very similar to the histograms obtained for
25 tt$ v'
~
20 hQ 0 15 q ~oo ~ 0..~ ~ O.-" ~~.D ~.0 2 ~ ga-e-&-~---. ~. ~yg-d8-~-J~ ~+-&~.e.g 1 . 6$ 16 bg 0 15 0 —4 i ~~ ~I ~ I ~ I 6 8 10 12 log (a) I 3o -(d) 6 8 10 12 iog, (a):(e)
I so -(f) 20-A 10-15 A 10 10 0 f. 0,4 0.6 0.8 ?I 0.4 0.8 0.4 0.6 h 0.8FIG. 2. WTMM analysis ofprotein coding and noncoding DNA sequences. (a) HHUMHBB: log2Z(q, a) vs log2a for different
values ofq;the data correspond to the analyzing wavelets
P"'
(~
)and P'2' (o). (b)HHUMHBB: log, Z(q, a) vs log, a for q=
1.5;the symbols (
~
)and (o) have the same meaning as in (a);the symbol (Q) corresponds to the data for the shuftled sequence (seetext) when using
P"',
the dashed and solid lines represent the corresponding least-squares fitestimates of~(q). (c)~(q) vs q for theHHUMHBB sequence when using
P'"
(~
),the HHUMHBB sequence (o),the shuftled HHUMHBB sequence (G),and the humandesmoplakin IcDNA
(4)
when usingP"'.
Histograms ofHolder exponent values extracted from the WTMM analysis (withP'")
of70human DNA sequences, ( ) cDNA's and ( )intron-containing sequences, the DNA walk graphs are constructed on theVOLUME 74,NUMBER 16
PHYSICAL REVIEW
LETTERS
17APRIL 1995the entire genes; they display a rather pronounced peak for
h
=
0.63.
Despite some slight overlap, the histogramsob-tained for individual exons and cDNA are systematically shifted towards lower h values and markedly peaked at h
=
0.50.
These results are in qualitative agreement with the conclusionsof
[1,
4,5]
and suggest that the experimentalfinding
of
long-range correlations in the human noncoding sequences is very likely to be ageneral characteristic fea-tureof
nucleotide organization in DNA.Let us stress that the
r(q)
spectra extracted from both coding and noncoding DNA walks are remarkably wellfit-ted by the theoretical spectrum for
FBM's
[r(q)
=
qH—
I].
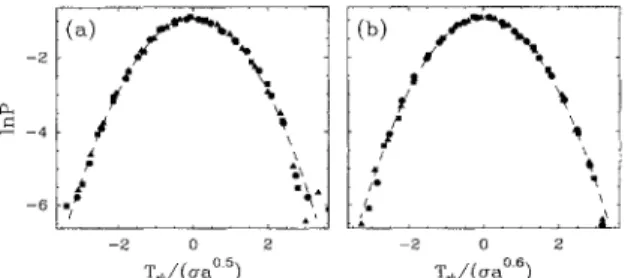
Within that prospect, we studied the probability distri-bution functionof
wavelet coefficient values P(Tpn)(.,a)),
as computed at a fixed scale a in the scaling range. The distributions obtained for both the coding DNA sequence
of
Fig. 1(a)and the largest intron (L=
33 895) containedinthe human retinoblastoma susceptibility gene are shown in Figs. 3(a) and
3(b),
respectively. When plotting lnPvs T~/o.
(a),
where cr(a) is the rms value at scalea,
all the data points computed at different scales fall on the same parabola independentlyof
the natureof
the sequence. Thus the fIuctuations in the DNA walks are likely to have Gaussian statistics. The presenceof
long-range correla-tions inthe intron sequence isinfact contained in the scaledependence
of
the rms o.(a)
—
a",
where h=
0.60~
0.
02 as compared to the uncorrelated random walk value h=
0.
50~
0.
02obtained for the coding sequence.To conclude, we have emphasized the WT as a very powerful and reliable tool to characterize the fractal scaling organization
of
DNA sequences. Our main experimentalfinding is that the fIuctuations inthe patchy DNA walks are homogeneous with Gaussian statistics. Those for
noncod-ing and intron-containing DNA sequences display long-range correlations and are well modeled by
FBM's
with1
H & 2. In contrast, those forcoding sequences cannot be distinguished from classical (uncorrelated steps)
Brown-ian motions. Actually, much more can be learned from the
WTMM analysis, especially as far asthe nature
of
theover-all superimposed patchy structure
of
the DNA sequences—2 (b) P —4 —6 —~1I' I —2 0 2 T@/(era ) 0 ~g/(~~") 2
FIG.3. Probability distribution functions of wavelet
coefh-cient values atfixed scale a
=
32 (~
), 64(4),
and 128 (~
);the analyzing wavelet is /~2~. Iog2P is plotted vs T/o. (a), whereo.(a)
=
o.a"isthe rms value. (a)Human desmoplakin I cDNA sequence: h=
0.5. (b)Largest intron in the human retinoblas-toma susceptibility gene: h=
0.6. The dashed lines in (a) and(b)are parabolas characteristic ofGaussian statistics.
3296
is concerned. For instance, very instructive information
is contained in the way the scaling range [Figs. 2(a) and
2(b)]
depends upon the shapeof
the analyzing waveletand the value
of
q, whether there exists some finite char-acteristic scale above which either the scaling is broken orsome crossover to a different scaling regime is observed. This information is likely to provide decisive tests for the
validity
of
various models proposed to account for thelong-range correlations in DNA sequences. On a more
fundamental ground, further application
of
the WTMManalysis to DNA sequences
of
different evolutionarycate-gories
[3]
looks promising for future understandingof
therole played by introns, repetitive motifs, and noncoding
in-tergenic regions in the nonequilibrium dynamical process
[1,
2] that produced nucleic acid sequences.We are very grateful to A. Henaut and A. Kuhn for helpful discussions. This work was supported by the GIP GREG (project "Motifs dans les Sequences"
).
[I]
C. K. Peng, S.V. Buldyrev, A.L. Goldberger, S.Havlin,F. Sciortino, M. Simons, and H.E. Stanley, Nature
(London) 356, 168(1992).
[2] W. Li and K. Kaneko, Europhys. Lett. 17, 655 (1992);
Nature (London) 360, 635 (1992).
[3] R. Voss, Phys. Rev. Lett. 6S, 3805 (1992); 71, 1777
(1993);Fractals 2, I (1994).
[4] (a) S.V. Buldyrev, A.L. Goldberger, S. Havlin, C. K.
Peng, M. Simons, F. Sciortino, and H.E. Stanley, Phys. Rev. Lett. 71, 1776 (1993); (b) C. K. Peng, S.V.
Buldyrev, A.L. Goldberger, S.Havlin, M. Simons, and
H.E. Stanley, Phys. Rev. E 47, 3730 (1993);(c) C. K.
Peng, S.V.Buldyrev, S.Havlin, M. Simons, H.E.Stanley,
and A.L.Goldberger, Phys. Rev. E 49, 1685(1994).
[5] V. V. Prabhu and
J.
M. Claverie, Nature (London)357, 782 (1992);P.J. Munson, R. C. Taylor, and G.S. Michaels, ibid 360,636 (1992.
).
[6] (a) S. Nee, Nature (London) 357, 450 (1992); (b) S.Karlin and V. Brendel, Science 259, 677 (1993); (c)D. Larhammar and C.A. Chatzidimitriou-Dreismann, Nucleic Acids Res.21, 5167(1993).
[7] (a) Wavelets, edited by
J.
M. Combes, A. Grossmann, and P. Tchamitchian (Springer-Verlag, Berlin, 1989); (b) Wavelets and Applications, edited by Y. Meyer (Springer-Verlag, Berlin, 1992);(c)Progress in Wavelet Analysis and Applications, edited by Y. Meyer andS.Roques (Frontieres, Gif-sur-Yvette, 1993).
[8] (a)A. Arneodo, G. Grasseau, and M. Holschneider, Phys. Rev. Lett. 61, 2281 (1988); in Wavelets (Ref. [7(a)]), p. 182;(b) J. F.Muzy, E.Bacry, and A. Arneodo, Phys.
Rev. Lett. 67, 3515
(1991);
Int.J.
Bifurcation Chaos 4, 245 (1994).[9]
B.B.
Mandelbrot andJ.
Van Ness, S.I.A.M. Rev. 10, 422(1968).
[10] Note that when using the analyzing wavelets P'~' with N
~
2, the WT does not depend, up to a globalmulti-plicative factor, upon the choice ofthe values ofthe DNA