HAL Id: hal-02987900
https://hal.archives-ouvertes.fr/hal-02987900
Submitted on 4 Nov 2020
HAL is a multi-disciplinary open access
archive for the deposit and dissemination of sci-entific research documents, whether they are pub-lished or not. The documents may come from teaching and research institutions in France or abroad, or from public or private research centers.
L’archive ouverte pluridisciplinaire HAL, est destinée au dépôt et à la diffusion de documents scientifiques de niveau recherche, publiés ou non, émanant des établissements d’enseignement et de recherche français ou étrangers, des laboratoires publics ou privés.
Jean-Loup Guyot, Naziano Filizola, Eurides de Oliveira
To cite this version:
Josyane Ronchail, David Labat, Jacques Callède, Gérard Cochonneau, Jean-Loup Guyot, et al.. Dis-charge variability within the Amazon basin. Regional Hydrological Impacts of Climatic Change-Hydroclimatological Variability (Proceedings of symposium S6 held during the Seventh IAHS Scientific Assembly at Foz do Iguaçu, Brazil), 2005. �hal-02987900�
Regional Hydrological Impacts of Climatic Change—Hydroclimatological Variability
(Proceedings of symposium S6 held during the Seventh IAHS Scientific Assembly at Foz do Iguaçu, Brazil, April 2005). IAHS Publ. 296, 2005.
21
Discharge variability within the Amazon basin
J. RONCHAIL1, D. LABAT2, J. CALLEDE3, G. COCHONNEAU4,
J. L. GUYOT5, N. FILIZOLA6 & E. DE OLIVEIRA6
1 Institut de Recherche pour le Développement (IRD)-Hydrologie et Géodynamique du Bassin
Amazonien (HyBAM)/LMTG-UR154 / LODYC-IPSL, Case 100, 4 place Jussieu, F-75252 Paris Cedex 05, France
2 Laboratoire de Mécanisme de Transfert en Géologie-LMTG-UMR 5563, CNRS-OMP
Université Paul-Sabatier, Paris, France
3 retired from IRD, QE15, conj. S, casa 51, GUARA II, CEP 71050-191 Brasília (DF), Brazil 4 IRD-HyBAM / LMTG-UR 154 / Maison de la Télédétection, 500 rue J-F Breton,
F-34093 Montpellier Cedex 5, France
5 IRD-HyBAM / LMTG-UR 154-Lima (Peru), Casilla 18, 1209-Lima 18, Peru 6 Agência Nacional de Águas (ANA), Setor Policial, Area 5, Quadra 3, Bloco L,
CEP 70610-200 Brasília (DF), Brazil
Abstract The discharge data of 80 stations (1981–2002) located in the Amazon
basin are analysed in relation to the SST in the tropical Pacific and Atlantic oceans, using composite analysis. A wavelet analysis is performed on the 100-year discharge series at Obidos (downstream Amazon). Discharge is lower than normal during El Niño except in the western rivers (Solimões, upper Negro, and Japura) and in the southernmost regions (upper Madeira, Tapajós and Xingu basins). During La Niña, discharge is higher than normal in the north-eastern basin and, in contrast, lower than normal in the Madeira basin. However, the ENSO signal is not stationary at Obidos during the 20th century, when considering high flow and mean discharge. High discharges in a vast central region of the Amazon basin are associated with cold SST over the Northern Tropical Atlantic (NATL) during the low-flow season. Furthermore, a common, though not permanent, near-decadal signal is observed in Obidos low flow and NATL SST. The discharge of the southernmost Amazonian rivers is related to the south Atlantic SST; however, these signals are space and time dependent.
Key words Amazon Basin; Atlantic; discharge; ENSO; interannual variability;
pluri-decadal variability; sea-surface temperatures (SST)
INTRODUCTION
The aim of this paper is to analyse the space–time variability of the relationships between the discharge within the Amazon basin and Atlantic and Pacific climatic indicators. Former studies realized by Molion & Moraes (1987), Richey et al. (1989), Marengo (1992, 1995), Amarasekera et al. (1997), Marengo & Tomasella (1998), Guyot et al. (1998), Uvo et al. (2000), Foley et al. (2002), using small data sets, generally coincide in finding lower (higher) discharge during El Niño (La Niña) in particular in the northern Amazon basin. Marengo (1992), Molinier et al. (2004), and Labat et al. (2004) also identified positive discharge anomalies when the Northern Tropical Atlantic is colder than usual. Recently, relationships between SST, discharge and inundations in the Mamoré basin and in the Madeira, Tapajós and Xingu basins
were described by Ronchail et al. (2003, 2004). The climatic signals in the southern tributaries of the Amazon basin are found to be time and space dependent.
Here we propose a new comprehensive analysis of the discharge–sea surface temp-erature (SST) relationships in the Amazon basin using the HyBAM (Hydrology and Geodynamics of the Amazonian basin) programme discharge data set, that is to say the daily discharge data of 80 stations (1981–2002) and the 100 years Óbidos rebuilt series (Callède et al., 2002). Both classic statistical methods and wavelet analysis are introduced.
DATA AND METHODS
During the last two decades, within the framework of PHICAB (Climatological and Hydrological Program of the Bolivian Amazonian basin) and HyBAM (Hydrology and Geodynamics of the Amazonian basin) programmes coordinated by the IRD, a part-nership was signed between this Institute and the SENAMHI (National Service of Meteorology and Hydrology, Bolivia), the SEMENA (Service for the Improvement of Amazonian Navigation, Bolivia) and the ANA (National Agency for Water, Brazil) in order to complement the hydrological networks. The daily water level data were corrected when necessary, eventually complemented using their correlation with data of upstream or downstream stations. The rating curves have been determined using the stream gauging measures (recently with ADCP) and have been used to convert the water levels series in discharge data.
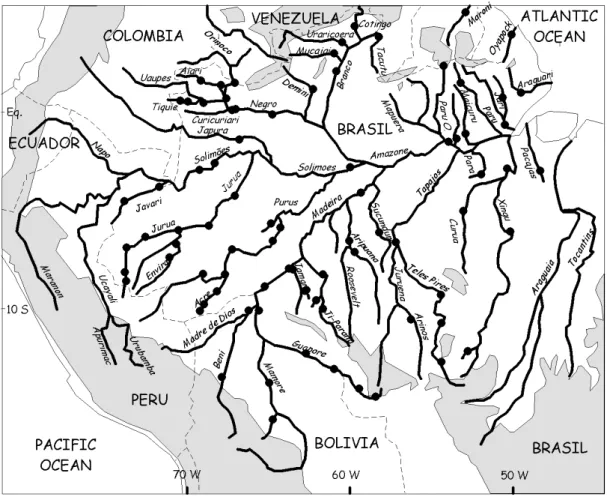
The data of 80 stations was compiled (Fig. 1). The daily discharge data permitted the calculation of various hydrological variables during the 1981–2002 period:
(a) The mean annual discharge computed for various hydrological years as various hydro-logical regimes are observed within the basin (Molinier et al., 1996): October– September for the southern basins (Madeira, Tapajós, Xingu, Purus, Juruà, and Solimões), April–March for the Negro, the Branco and the Juruena basins and January–December for the northeastern tributaries.
(b) The annual high flow (maximum) and low flow (minimum) discharge are also computed for the hydrological year. The minimum annual discharge that is retained follows the annual maximum, even though it occurs after the end of the hydrological year.
The sea surface temperature (SST) data set is from the Climatic Prediction Centre-NOAA. Monthly SST (1950–2002) were collected for Niño 1-2 (0°–10°S; 90–80°W), Niño 3 (5°S–5°N; 150–90°W), Niño 3-4 (5°S–5°N; 170–120°W), Niño 4 (5°S–5°N; 160°E–150°W), the Northern Tropical Atlantic-NATL (5–20°N; 60–30°W) and the Southern Tropical Atlantic-SATL (0–20°S; 30°W–10°E).
The Southern Oscillation Index (SOI), standardized difference of pressure between Tahiti and Darwin, and the Multivariate ENSO index (MEI—Wolter 1987) that synth-esizes atmospheric and oceanic data in the equatorial Pacific are from the CDC-NOAA. The global SST data are from the NCEP-NCAR Reanalysis (Kalnay et al., 1996). They are used to construct SST indices in various latitude-longitude boxes in the southwestern subtropical Atlantic. The results presented in this work are those with the averaged SSTs in a 20–30° south, 30–50° west box.
Discharge variability within the Amazon basin 23
Fig. 1 Location of the gauging stations. Grey shading indicates regions above 500 m.
Composites and correlation analysis are used to measure the relationships between SSTs and discharge. Correlations are taken into account when they are significant at the 95% level. Discharge anomalies are taken into account when they are significant at the 0.90% level for a two-tailed test of the null hypothesis of no difference from the 1981–2002 mean.
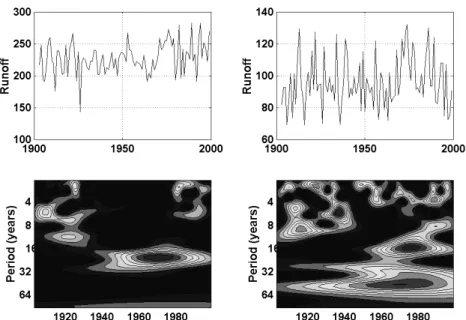
A visual inspection of high or low flow annual Óbidos series (Fig. 2) shows a highly intermittent signal, which justifies the preference of wavelet analysis over classical Fourier analysis (Labat et al., 2000, 2001). The coefficients of the wavelet transform of a continuous-time signal x(t) are defined by the linear integral operator (Grossman & Morlet, 1984):
∫
−+∞∞ ∗ = x t t t a Cx( ,τ) ( )ψ a,τ( )d with −τ ψ = ψ τ a t a t a 1 ) ( , (1)where * corresponds to the conjugated complex. The wavelet spectrum WX (a,τ) of a continuous-time signal x(t) is defined as the modulus of its wavelet coefficients (Liu, 1994): 2 ) , ( ) , ( ) , ( ) , (a τ =C a τ C∗ a τ = C a τ WX X X X (2)
Fig. 2 Temporal fluctuations and corresponding Morlet wavelet analysis of the main hydrological series available on the Amazon basin at Óbidos over the period 1900– 2000. Left: annual high flow (103 m3 s-1); right: annual low flow (103 m3 s-1) (adapted
from Labat et al., 2004).
RESULTS
El Niño–Southern Oscillation
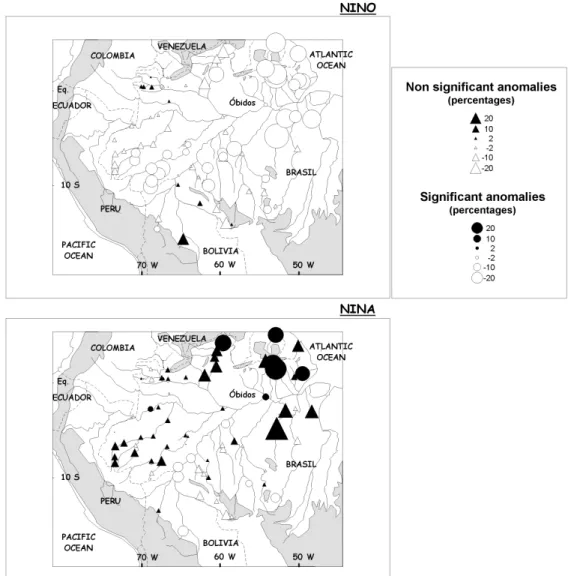
During the 1981–2002 period, an El Niño/low discharge signal is observed in most Amazonian rivers when considering mean (Fig. 3), maximum and minimum annual discharge. The major negative anomalies are depicted in the northeastern small tributaries of the Amazon River, where the discharge is diminished by 50% during El Niño years, and also at Altamira (downstream Xingu). Significant anomalies are also observed along the Purus River and some right-hand tributaries of the Madeira River (Ji-Parana, Aripuana, and Sucunduri); the discharge in these rivers is reduced by 25% during El Niño. Elsewhere, negative anomalies during El Niño are seldom significant (Beni, Tapajós, Juruà, Branco). Along the Solimões and Negro Rivers, the main Amazon contributors, the signal is very weak. Information is still missing about the Ecuadorian and Peruvian tributaries of the Solimões River. It is noticeable that though being insignificant, there is an inverse tendency (El Niño/high discharge) in the upper Negro River (Tiquie, Uaupes) and in the Japura River, in the northwesternmost regions, especially when considering the low-flow discharge (not shown), and, on another hand, in the upper Madeira basin (Mamoré River).
The La Niña/high discharge signal is not the symmetric of the El Niño/low discharge signal; it is mainly observed in the northeastern rivers and along the Branco River, though not being always significant, and it becomes weak and insignificant along the Negro, the Solimões, the Juruà the Purus and the Beni rivers. An inverse signal with low discharge during La Niña is noteworthy in a great part of the southern Amazon basins and especially along the Mamoré and Madeira rivers0 until Fazenda Vista Alegre. This signal is very similar to that observed in the Parana River during La Niña. The same signal is also observed on low-flow waters in the upper Negro basin (not shown).
Discharge variability within the Amazon basin 25
Fig. 3 Composite mean annual discharge anomalies, significant at the 90% level (circles) or not significant (triangles), during El Niño and La Niña events in the equatorial Pacific (1981–2002).
The correlation between mean discharges in the Amazon basin and ENSO indicators (SOI or SST in various regions of the equatorial Pacific) reveals that 55% of the discharge variability is explained by ENSO in the northeastern rivers; the percentage is still higher than 30% in the Branco and the downstream Negro basins, in the right hand tributaries of the Madeira and along the Purus River.
At Óbidos, on the main Amazon stem, the mean annual discharge is weak but significantly smaller (greater) during El Niño (La Niña) events during the 1981–2002 period. Consistently, the wavelet analysis of the 1903–2001 discharge series at Óbidos shows that they are characterized by 3–7 year interannual oscillations that are typical of ENSO variability (Fig. 2). Regarding low-flow discharge, the signal is nearly permanent over the 1903–2001 interval (Fig. 2, right); in contrast, the 3–7 year interannual oscillations are temporally localized in the 1900–1930 and 1980–2000 intervals when considering mean discharge (not shown) and high flow discharge (Fig. 2, left) (Labat et al., 2004).
Fig. 4 Composite low flow discharge anomalies, significant at the 90% level (circles) or not significant (triangles) during cold events in the North Tropical Atlantic (period: 1981–2002, events: 1984–1985, 1985–1986 and 1993–1994).
The Northern Tropical Atlantic (NATL)
In a large portion of the Amazon basin, from the main Solimões-Amazon stem to 10°S, higher than normal low flow (Fig. 4) and mean (not shown) discharge are observed when the SST in the Northern Tropical Atlantic (NATL) is colder than usual. Depending on the stations the low-flow discharge increases by 20–40% during the cold events. An inverse relationship is highlighted along the Branco River and to a lesser extent along the Negro. Warm events in NATL (not shown) are characterized by weaker than usual discharges.
As a result the SST in NATL region explains 25–40% of the low flow discharge in the northeastern basins, in the right-hand tributaries of the Madeira River, in the Purus and downstream Juruà rivers.
At near decadal time scale (15.5 years) the wavelet analysis of the Óbidos time series also highlights variability common to low-flow discharge (Fig. 2, right) and to SST in NATL (not shown; see Labat et al., 2004). This feature is particularly strong at the beginning of the 1970s when an abrupt increase in low flow discharge at Óbidos coincides with a decrease in NATL SST (Fig. 5).
-1,0 -0,5 0,0 0,5 1,0 1956 1959 1962 1965 1968 1971 1974 1977 1980 1983 1986 1989 1992 1995 1998 S tan d a rd iz ed d a ta
Low Flow NATL SST
Fig. 5 Low flow discharge at Óbidos and annual SST in the Northern Tropical Atlantic (5–20°N; 60–30°W). Data are standardized and an 11-year running mean is computed.
Discharge variability within the Amazon basin 27
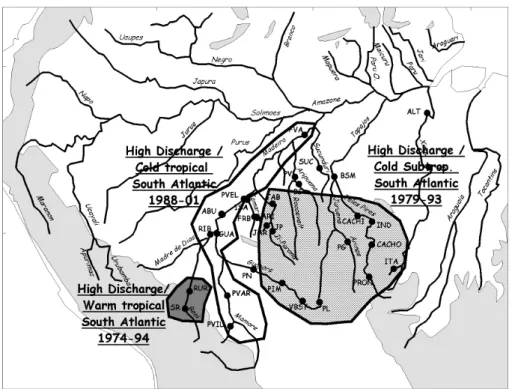
Fig. 6 Relationships between discharge and SST in the South Atlantic, tropical (0–20°S; 30°W–10°E) and subtropical (20–30°S; 30–50°W). White (dark) shading indicates negative (positive) relationships between discharge in the Mamoré-Madeira (Beni) basin and the South Tropical Atlantic. Dotted shading (Upper Xingu, Tapajós and Guaporé) indicates a negative relationship between discharge and sub tropical SST (adapted from Ronchail et al., 2004).
The South Atlantic (SATL)
In the southernmost regions of the Amazon basin, Ronchail et al. (2004) identified relationships between discharge and the South Atlantic (SATL) SST that are summarized in Fig. 6. They are generally time dependent.
In the Guaporé, upper Xingu and Tapajós, until the end of the 1980s or the early 1990s, high discharge is related to a colder than usual subtropical southern Atlantic; during the same period, in the Beni basin, high discharge is associated with a warmer than usual South Tropical Atlantic. The opposite signal is observed along the Mamoré-Madeira during the 1990s and it propagates until Fazenda Vista Alegre on the downstream Madeira.
The bi-decadal variability that is observed in high flow (Fig. 2, left) and mean discharge at Óbidos around 1970 recalls the bi-decadal variability observed in the South Atlantic (Wainer & Venegas, 2002).
CONCLUSION
A comprehensive set of data allows a detailed analysis of the relationships between dis-charge in the Amazon basin and SST in the tropical Pacific and Atlantic during the 1981–2002 period. Additional information is proposed to the well-known El Niño/low
discharge and La Niña/high discharge signals: the spatial extension of these signals are defined and regions with opposite El Niño/high discharge, La Niña/high discharge are identified, as well as regions without any signal. The extension of the north tropical Atlantic signal is also emphasized; in addition, it is found that this signal is significant when considering low-flow discharge values. The complexity of the relationships be-tween discharge in the southern Amazon region and SST in the southern Atlantic were fully detailed in Ronchail et al. (2004).
Additional information results from the wavelet analysis of the 100-year discharge series at Óbidos, on the main Amazon stem. It is particularly important to underline the non-stationarity of the ENSO signal during the 20th century (strong at the beginning and the end of the century and weak in between) and the major changes that occurred around 1970 (Callède et al., 2004), at decadal and bi-decadal time scales, possibly in connection with SST in the Atlantic.
These results are consistent with others concerning rainfall–SST relationships (Hastenrath & Heller, 1977; Aceituno, 1988; Marengo, 1992; Moron et al., 1995; Liebmann & Marengo, 2001; Molinier et al., 2004; Ronchail et al., 2002).
REFERENCES
Aceituno, P. (1988) On the functioning of the Southern Oscillation in the South American sector: surface climate. Monthly
Weather Rev. 116, 505–524.
Amarasekera, K. N., Lee, R. F., Williams, E. R. & Eltahir, E. A. B. (1997) ENSO and the natural variability in the flow of tropical rivers. J. Hydrol. 200, 24–39.
Callède, J., Guyot, J. L., Ronchail, J., Molinier, M. & de Oliveira, E. (2002) L’Amazone à Obidos (Brésil): étude statistique des débits et bilan hydrologique. Hydrol. Sci. J. 47, 321–334.
Callède J., Guyot, J. L., Ronchail, J., L’Hôte, Y., Niel, H. & de Oliveira, E. (2004) Evolution du débit de l’Amazone à Obidos de 1902 à 1999. Hydrol. Sci. J. 49(1), 85–97.
Foley, J. A., Botta, A. & Coe, M. T. (2002) El Niño-Southern Oscillation and the climate, ecosystems and rivers of Amazonia. Global Biogeochemical Cycles 16 (4) 1132–1143.
Grosmann, A. & Morlet, J. (1984) Decomposition of Hardy functions into square integrable wavelets of constant shape.
SIAM J. Math. Analysis 15, 723–736.
Guyot, J. L., Callède, J., Molinier, M., Guimarães, W. & De Oliveira, E. (1998) La variabilité hydrologique actuelle dans le bassin amazonien. Bull. Inst. Fr. études andines 27, 779–788.
Hastenrath, S. & Heller, L. (1977) Dynamics of climatic hazards in northeast Brazil. Quatern. J. Roy. Met. Soc. 110, 77–92. Kalnay, E. et al. (1996) The NCEP/NCAR 40-Years Reanalyses Project. Bull. Am. Met. Soc. 77, 437–471.
Labat, D., Ababou, R. & Mangin, A (2000) Rainfall–runoff relations for karstic springs.Part II: Continuous wavelet and discrete orthogonal multiresolution analyses. J. Hydrol. 238, 149–178.
Labat, D., Ababou, R. & Mangin, A. (2001) Introduction of wavelet analyses to rainfall/runoff relationships for a karstic basin: the case of Licq-Atherey karstic system (France). Ground Water 39, 605–615.
Labat, D., Ronchail, J., Callède, J., Guyot, J. L., De Oliveira, E. & Guimarães, W. (2004) Wavelet analysis of Amazon hydrological regime variability. Geophys. Res. Lett. 31, L02501.
Liebmann, B. & Marengo, J. A. (2001) Interannual variability of the rainy season and rainfall in the Brazilian Amazon basin. J. Climate 14, 4308–4317.
Liu, P. C. (1994) Wavelet spectrum analysis and ocean wind waves. In: Wavelets in Geophysics (ed. by E. Foufoula-Georgiou & P. Kumar), 151–166. Academic Press, New York, USA.
Marengo, J. (1992) Interannual variability of surface climate in the Amazon basin. Int. J. Climatol. 12, 853–863. Marengo, J. (1995) Variations and change in South American streamflow. Climate Change 31, 99–117.
Marengo, J. & Tomasella, J. (1998) Trends in streamflow and rainfall in tropical south America: Amazonia, eastern Brazil and northwestern Peru. J. Geophys. Res. 103, 1775–1783.
Molinier, M., Ronchail, J., Guyot, J. L., Cochonneau, G., Guimarães, W. & de Oliveira, E. (2004) Hydrological variability in the Amazon drainage basin and African tropical basins. Hydrol. Processes (accepted).
Molinier, M., Guyot, J. L., de Oliveira, E. & Guimarães, W. (1996) Les régimes hydrologiques de l’Amazone et de ses affluents. In: Hydrologie tropicale: géoscience et outil pour le développement (Tropical Hydrology: a geoscience
and a tool for sustainability) (ed. by P. Chevalier & B. Pouyaud), 209–222. IAHS Publ. 238. IAHS Press,
Discharge variability within the Amazon basin 29
Molion, L. C. B. & de Moraes, J. C. (1987). Oscilação Sul e descarga de rios na America do Sul Tropical. Revista Brasileira
de Engenaria, Caderno Hydrologico 5, 53–63.
Moron, V., Bigot, S. & Roucou, P. (1995) Rainfall variability in subequatorial America and Africa and relationships with the main sea-surface temperature modes (1951–1990). Int. J. Climatol. 15, 1297–1322.
Richey, J. E., Nobre, C. & Deser, C. (1989) Amazon river discharge and climate variability. Science 246, 101–103. Ronchail, J., Cochonneau, G., Molinier, M., Guyot, J. L., Goretti de Miranda Chaves, A., Guimarães, W. & de Oliveira, E.
(2002a) Rainfall variability in the Amazon Basin and SSTs in the tropical Pacific and Atlantic oceans. Int. J. Climatol.
22, 1663–1686.
Ronchail, J., Bourrel, L., Cochonneau, G., Vauchel, P., Phillips, L., Castro, A., Guyot, J. L. & de Oliveira, E. (2003) Climate and inundations in the Mamoré basin (south-western Amazon-Bolivia). J. Hydrol. (accepted).
Ronchail, J., Cochonneau, G., Bourrel, L., Maurice-Bourgoin, L., Filizola, N., Vauchel, P., Guyot, J. L., de Oliveira, E. & Guimarães, W. (2004) Space-time variability of the SST-discharge relationships in the southern Amazon basin (Madeira-Tapajós-Xingu). Hydrol. Processes (submitted).
Uvo, C. B., Tölle, U. & Berndtsson, R. (2000) Forecasting discharge in Amazonia using artificial neural networks. Int. J.
Climatol. 20, 1495–1507.
Wainer, I. & Venegas, S. A. (2002) South Atlantic multi-decadal variability in the Climate System Model. J. Climate 12, 1408–1420.
Wolter, K. (1987) The Southern Oscillation in surface circulation & climate over the tropical Atlantic, Eastern Pacific, & Indian Oceans as captured by cluster analysis. J. Clim. Appl. Met. 26, 540–558.