1 Supplementary Information
4-Hydroxy-1-naphthaldehydes: proton transfer or deprotonation. Y. Manolova, V. Kurteva and L. Antonov
Institute of Organic Chemistry with Centre of Phytochemistry, Bulgarian Academy of Sciences, Acad. G.Bonchev str., bldg. 9, Sofia 1113, Bulgaria
H.Marciniak and S. Lochbrunner
Institut für Physik, Universität Rostock, Universitätsplatz 3, 18051 Rostock, Germany A. Crochet and K.M. Fromm
Department of Chemistry, University of Fribourg, Chemin du Musée 9, 1700 Fribourg, Switzerland F.S. Kamounah and P.E. Hansen
Department of Science, Systems and Models, Roskilde University, Universitetsvej 1, P.O.Box 260, DK-4000 Roskilde, Denmark
2 1 Solid state analysis of 3.
The question arises where the acid function arises from, especially at this relative amount of 40%. Obviously, there is oxidation of the aldehyde by oxygen from air. To verify this, two analyses were carried out. The IR spectrum of the solid of compound 3 evolves over time when the powder is kept in air, and new bands at 2750, 1700, 1640 and 1180 cm-1 appear (Figure S6). This may well correspond to further H-bonding, C=O and C-O stretching vibrations due to presence of acid. Analysis of the evolution of the X-ray single crystal data over 3 days shows an increase of the relative amount of the acid with respect to the aldehyde in the solid state. This let us to the conclusion that the presence of the acid can be explained by the slow oxidation of the aldehyde in the solid state.
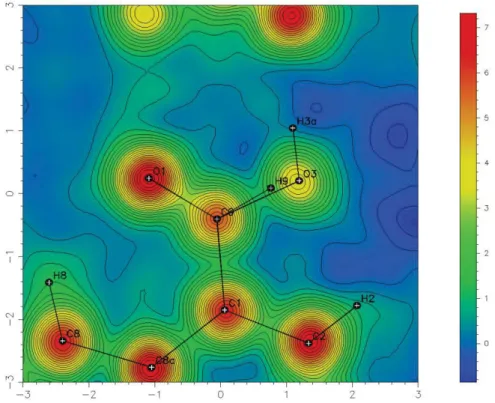
3 Figure S2. Calculated Fourier map with aldehyde and acid functions.
Figure S3. Residue (observed, Figure 1, minus calculated, Figure S1) Fourier map with aldehyde and acid functions.
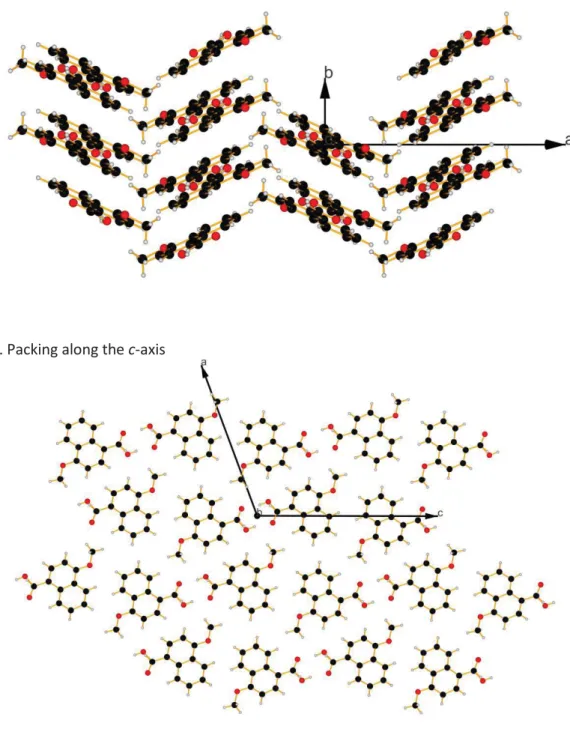
4 Figure S4. Packing along the c-axis
5 Figure S6. Solid state IR spectra of 3 as it is (blue line) and after 3 days x-ray irradiation (red line).
6 2 Isomers of 1, 2 and 4.
The isomers of 1, 2 and 4 were studied theoretically in respect of the orientation of the C=O group and in respect of the position of the piperidine units in the case of 2. As seen the effect of the solvent as PCM model is negligible in both relative stability of the isomers and barriers of rotation. The preference of the form of 2 with intramolecular hydrogen bonding was proven by NMR spectroscopy.
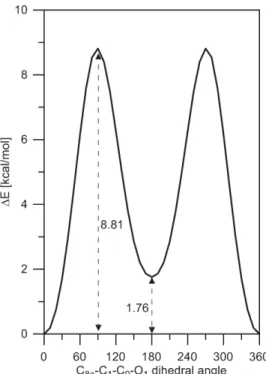
Figure S7. Rotation of the carbonyl group in 1 in gas phase from syn (with respect of the second aromatic ring, the dihedral angle is 0o) to anti isomer (the dihedral angle is 180o). More details are given in Table S1.
Table S1. Energetics (in kcal/mol units) of the rotation of the carbonyl group in 1 defined as the difference between anti and syn.
Solvent (PCM model) 'E 'E+ZPE 'G barrier Gas phase 1.76 1.62 1.37 8.81 Toluene 1.60 1.47 1.26 8.75 Acetonitrile 1.57 1.43 1.23 8.66 Methanol 1.56 1.42 1.23 8.66
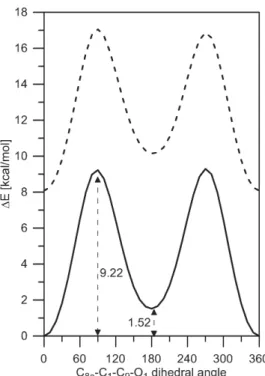
7 Figure S8. Rotation of the carbonyl group in 2 in gas phase from syn (with respect of the second aromatic ring, the dihedral angle is 0o) to anti isomer (the dihedral angle is 180o). The lines correspond to the availability of intramolecular hydrogen bonding: solid line - with intramolecular hydrogen bonding (a, the nitrogen atom faces the OH group, from Figure 8); dashes - without intramolecular hydrogen bonding (c-like structure, the nitrogen atom faces the carbonyl group). The curves are shifted by the difference between with and without isomers of 2 (8.08 kcal/mol). More details are given in Table S2 and the discussion about NMR results below.
Table S2. Energetics (in kcal/mol units) of the rotation of the carbonyl group in 2 defined as the difference between anti and syn. The energetic difference between isomers with and
without hydrogen bonding is as follows ('E, 'E+ZPE, 'G): 8.08, 7.73, 7.23.
Solvent (PCM model)
C4-C3-C10-N1 angle = -39.4o
with intramolecular hydrogen bonding
C4-C3-C10-N1 angle = 158.8o
without intramolecular hydrogen bonding 'E 'E+ZPE 'G barriera barrierb 'E 'E+ZPE 'G barriera barrierb Gas phase 1.52 1.34 1.10 9.22 9.30 2.07 1.82 1.64 8.97 8.78 Toluene 1.45 9.24 9.29 1.93 8.92 8.79 Acetonitrile 1.54 9.23 9.23 1.68 8.73 8.72 Methanol 1.54 1.34 1.10 9.23 9.23 1.68 1.53 1.35 8.72 8.72 a C8a-C1-C9-O1 angle = 90o; b C8a-C1-C9-O1 angle = 270o.
8 Figure S9. Partial 1H-1H NOESY spectrum of 2 in CDCl3.
The steric preferences of the ligand 2 were additionally studied by NOESY NMR experiment (Figure S9). From one side, clean interactions between the singlet for CH-2 and spacer CH2 (C10) were
detected, while no interactions with CH2–N groups of piperidine were observed (Scheme S2). The
latter can be an indication for fixed by H-bonding conformation with piperidine ring on the hydroxyl side. However, it has to be mentioned that piperidine methylene groups appear as broad signals, which can result in absence of interactions in a reasonable time-scale. From the other side, the interactions of aldehyde proton with CH-2 and CH-8 indicate that the rotation barrier of C-CHO bond is very low.
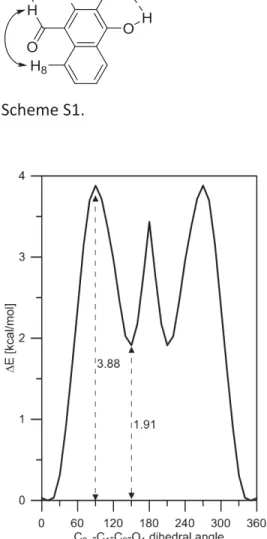
9 Scheme S1.
Figure S10. Rotation of the carbonyl group in 4 in gas phase from syn (with respect of the second aromatic ring, the dihedral angle is 13.3o) to anti isomer (the dihedral angle is 147.9o).
10 3 Deprotonation of 4.
Figure S11. Deprotonation of 4 in gas phase (lines), interacting with acetonitrile in acetonitrile environment (dashes) and methanol molecule in methanol environment (points).
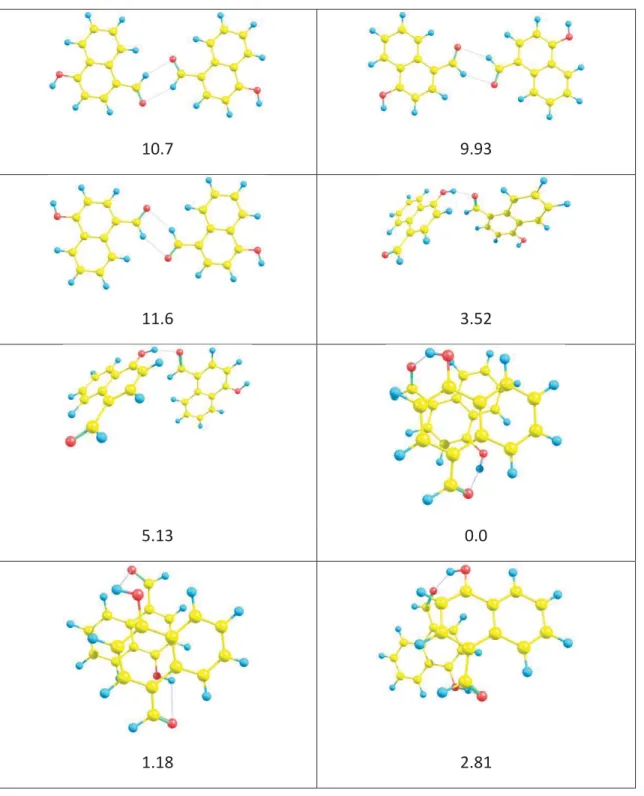
11 4. Dimerization of 1.
Table S3. Stable dimer structures of 1 and relative energies (in kcal/mol units) in gas phase.
10.7 9.93
11.6 3.52
5.13 0.0
12
5.32 4.44
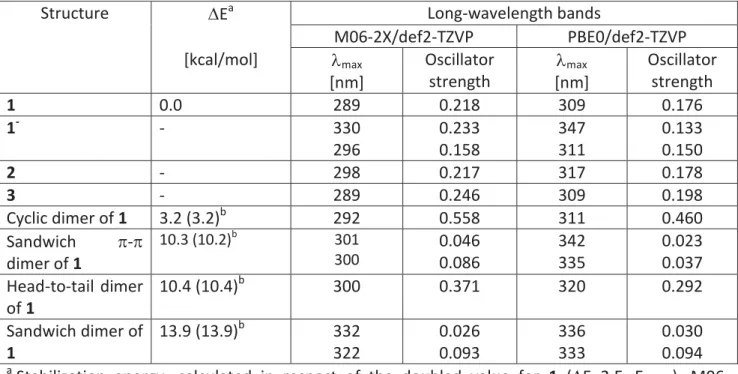
13 5. Theoretical prediction of the long-wavelength bands in the absorption spectra of the investigated species.
Table S4. Stabilization energies of the dimers of 1 and predicted long-wavelength bands in gas phase using the optimized M06-2X/def2-TZVP geometry.
Structure 'Ea Long-wavelength bands
M06-2X/def2-TZVP PBE0/def2-TZVP [kcal/mol] Omax [nm] Oscillator strength Omax [nm] Oscillator strength 1 0.0 289 0.218 309 0.176 1- - 330 296 0.233 0.158 347 311 0.133 0.150 2 - 298 0.217 317 0.178 3 - 289 0.246 309 0.198 Cyclic dimer of 1 3.2 (3.2)b 292 0.558 311 0.460 Sandwich S-S dimer of 1 10.3 (10.2)b 301 300 0.046 0.086 342 335 0.023 0.037 Head-to-tail dimer of 1 10.4 (10.4)b 300 0.371 320 0.292 Sandwich dimer of 1 13.9 (13.9)b 332 322 0.026 0.093 336 333 0.030 0.094 a
Stabilization energy, calculated in respect of the doubled value for 1 ('E=2.E1-Edimer),
M06-2X/def2-TZVP. Positive value indicates stabilization in respect of the monomer; b Using BSSE correction.