WORKING
PAPERS
SES
N. 468
IV.2016
FacultédesscienceséconomiquesetsocialesWirtschaFts- undsozialWissenschaFtliche Fakultät
Screening for Bid-rigging –
Does it Work?
David Imhof,
Yavuz Karagök and
Samuel Rutz
Screening for Bid-rigging – Does it Work?
DAVID IMHOF*, YAVUZ KARAGÖK**, SAMUEL RUTZ***
December 2015
Abstract: This paper proposes a method to detect bid-rigging by applying mutually
reinforcing screens to a road construction procurement data set from Switzerland in which no prior information about collusion was available. The screening method is particularly suited to deal with the problem of partial collusion, i.e. collusion which does not involve all firms and/or all contracts in a specific data set, implying that many of the classical markers discussed in the corresponding literature will fail to identify bid-rigging. In addition to presenting a new screen for collusion, it is shown how benchmarks and the combination of different screens may be used to identify subsets of suspicious contracts and firms in a data set. The discussed screening method succeeds in isolating a group of “suspicious” firms exhibiting the characteristics of a local bid-rigging cartel operating with cover bids and a – more or less pronounced – bid rotation scheme. Based on these findings the Swiss Competition Commission (ComCo) decided to open an investigation.
Keywords: bid-rigging, screening method, variance screen, cover bidding screen, bid
rotation test, partial collusion
JEL-Classification: C00, C40, D22, D40, K40, L40, L41
Acknowledgements: The authors would like to thank Christian At, Marc Blatter, Rafael
Corazza, Thierry Madiès, Daniel Marszalec, Hiroshi Ohashi, Dan Sasaki, Frank Stüssi and Niklaus Walliman for support and helpful comments.
Disclaimer: All views contained in this paper are solely those of the authors and cannot be
attributed to the Swiss Competition Commission or its Secretariat.
* Economist, Secretariat of the Swiss Competition Commission. Email: [email protected]. Affiliated to the University of Fribourg (Switzerland), the University of Franche-Comté (France) and Unidistance (Formation universitaire à distance, Switzerland).
**Senior Economist, Secretariat of the Swiss Competition Commission. Email: [email protected].
1
Screening for Bid-rigging – Does it Work?
1 Introduction
Bid-rigging involves groups of firms conspiring to raise prices or lower the quality of goods or services offered in public tenders. Although illegal, this anti-competitive practice costs governments and taxpayers vast sums of money every year.1 It is therefore not surprising that the fight against bid-rigging is currently a top priority in many countries and also a much-debated issue internationally.2 In Switzerland it was acknowledged a few years ago that the fight against bid-rigging in the procurement sector should be a priority, not least because several bid-rigging cartels were uncovered by the Swiss Competition Commission (ComCo) in the recent past.3
To detect bid-rigging (and other competition law infringements) national competition authorities heavily rely on leniency programs (OECD 2014) today. Switzerland is no exception: whistle-blowers or leniency applicants are the common denominator of recently prosecuted cases and contributed significantly to the uncovering of bid-rigging cartels. To mitigate the dependency on these external sources and actively reinforce the fight against bid-rigging, ComCo decided to initiate a long-term project in 2008. One of the goals of this project was to develop a statistical screening tool with the following properties:
1. Modest data requirements: Screening exercises will often have to rely on limited available public data, e.g. data collected by a procurement agency or a statistical
1 On average, procurement amounts to 29% of the government expenditure in OECD countries and to 13% of
GDP. For Switzerland, procurement accounts for 23% of the government expenditure and represents 8% of the Swiss GDP. See OCED rapport Government at a Glance, published in 2013:
http://www.oecd.org/gov/ethics/Government%20at%20a%20Glance%202013_Procurement%20Data%20GOV_ PGC_ETH_2013_2.pdf.
2
In 2009, the OECD adopted the Guidelines for Fighting Bid-rigging in Public Procurement. These guidelines were followed by the adoption of a Recommendation on Fighting Bid-rigging in Public Procurement in 2012, which calls for governments to assess their public procurement laws and practices at all levels of government in order to promote more effective procurement and reduce the risk of bid-rigging in public tenders. The two documents mentioned and many other documents related to bid-rigging are available at the OECD homepage (http://www.oecd.org/daf/competition/fightingbidrigginginpublicprocurement.htm).
3 See Strassenbeläge Tessin (LPC 2008/1, pp. 85-112), Elektroinstallationsbetriebe Bern
(LPC 2009/2, pp. 196-222), Wettbewerbsabreden im Strassen- und Tiefbau im Kanton Aargau (LPC 2012/2, pp. 270-425),
Wettbewerbsabreden im Strassen- und Tiefbau im Kanton Zürich (LPC 2013/4, pp. 524-652) and Tunnelreinigung (LPC 2015/2, pp. 193-245). Furthermore, ComCo regularly institutes proceedings concerning
2
office. Gathering detailed information from private firms will hardly ever be an option since this would immediately raise the suspicion of potential cartel members and lead to the destruction of any proof of collusion.
2. Simplicity: The screening method should be simple to apply.
3. Reliable results: Of course, no screening method will ever produce hard evidence for the existence of a cartel. It should, however, be able to produce evidence sufficiently reliable to convince a competition authority to open an investigation.
The following procedure was chosen to build a detection method meeting these requirements: Starting from the existing screening literature, two screens – also called markers – were applied to a procurement data set in which no prior information about (potential) collusion was available. Both of these screens assume that collusive behavior, e.g. in the form of explicit coordination or an exchange of information, modifies the distribution of the bids. Both screens, however, did not produce unambiguous evidence as to whether collusion is likely to exist or not. A possible reason for this result is that the statistical methods suggested in the literature are not particularly well suited to detect partial collusion, i.e. collusion that does not involve all firms and/or all contracts in a dataset. Therefore, we designed an approach that allows testing for partial collusion. In general, our approach amounts to a collection of mutually reinforcing tests to identify potential collusion between subsets of firms. With the help of these tests it was possible to isolate a group of “suspicious” firms in our sample that exhibits the characteristics of a local bid-rigging cartel operating with cover bids and a – more or less pronounced – bid rotation scheme. Based on these results ComCo decided to open an investigation.
In this article we present our detection method in detail. It is organized as follows: Section 2 presents the literature on screening methods. Section 3 then explains the setup of our data set and provides some descriptive statistics. In section 4 two simple screens are applied to our data set. Given the ambiguous results in section 4, section 5 combines these two screens and shows how this may help to detect partial collusion. Furthermore, several tests serving to reinforce suspicions of partial collusion are discussed in section 5. Another test, the bid rotation test, is then discussed separately in section 6. Section 7 concludes.
3
2 Screening methods
There is a growing literature on cartel detection which can roughly be divided into two strands: Some literature discusses structural methods for the empirical identification of markets prone to collusion. Such structural methods try to analyze the market structure in different industries, aiming at the identification of factors which are known to enhance respectively sustain collusion.4 In general, this approach uses relatively aggregated data on an industry level and can therefore often only crudely indicate whether collusion is more or less likely to occur in certain industries. In contrast, the so-called behavioral methods analyze the concrete behavior of firms in specific markets. To this purpose a multitude of more or less complex statistical tests may be employed.
Harrington (2008) summarizes the literature on behavioral methods and discusses a number of
statistical markers that may help to distinguish competitive from collusive behavior. Some of
these markers rely on theoretical considerations from literature on collusion, while others are based on empirical observations from uncovered cartels (see also OECD 2014). In general,
price- and quantity-related markers may be distinguished. Conceptually, in the case of
tenders, the price-related markers use the information contained in the structure of the winning and losing bids to identify suspect bidding behavior. In contrast, the quantity-related markers attempt to identify collusive behavior from developments in the market shares that are prima vista not compatible with competitive markets.
The most comprehensively tested price-related marker is the so called variance screen: Several empirical papers provide evidence for the fact that in the case of collusion prices are often less responsive to effective costs than in a competitive environment, i.e., price variability is lower in a collusive environment. Feinstein and Brock (1985) apply the variance screen to highway construction cartels in North Carolina and find that the coefficient of variation is lower when bidders collude. They also find that collusion is characterized by frequent and repeated interaction of the same group of bidders. More recently, Abrantes-Metz et al. (2006) examine a US bid-rigging cartel for frozen fish. They show that prices for frozen perch fell – on average – by 16% after the collapse of the cartel and the standard deviation of bids increased by more than 250%. Esposito and Ferrero (2006) show that the use of the variance screen would have been successful in detecting two cartels – one in the fuel market
4
and another one in the market for baby food products sold in pharmacies – investigated by the Italian Competition Authority (AGCM).
Bolotova et al. (2008) provide mixed evidence for the lysine and the citric acid cartels: In the lysine cartel, the standard deviation of bids was indeed significantly lower during the cartel period. However, these results could not be confirmed for the citric acid cartel. Abrantes-Metz et al. (2012) use – inter alia – a variance screen to show that daily bank quotes for the Dollar Libor behaved abnormally compared to other short-term borrowing rates. Another application of the variance screen is provided by Jiménez und Perdiguero (2012): They use the screen to examine price variability in the fuel market in the Spanish Canary Islands. Although they do not find (clear) evidence for collusion, they confirm that lower competition in markets tends to lower price variability.
The variance screen has also been applied by competition authorities. Ragazzo (2012), for example, describes a method developed by the Brazilian Competition Policy System (BCPS) to screen regional gasoline markets for collusive behavior. Also, the Mexican competition agency used price screens to identify bid-rigging for different types of drugs: Mena-Labarthe (2012) as well as Estrada and Vazquez (2013) report the typical pattern of low price variance during collusive periods and a significant increase of price variance after the cartel collapsed. So far, economic theory has not provided a wholly convincing explanation for the link between collusion and price variability. There are two theoretical contributions in the literature attempting to explain why price variability may be lower in a collusive environment. Athey et al. (2004) consider an infinitely repeated Bertrand game in which each firm’s cost is private information and varies over time. In each period messages concerning the firm’s costs are exchanged and then prices are chosen. The basic problem colluding firms face is to induce truthful revelation of costs. Assuming an inelastic demand, Athey et al. (2004) show that – if firms are sufficiently patient – optimal collusion is characterized by price rigidity. Harrington and Chen (2006) choose a different approach: They start out from the idea that cartels try to avoid detection by buyers, who become suspicious whenever they perceive anomalous changes in the history of prices. Assuming that a cartel is aware of how its price choice affects the beliefs of buyers, Harrington and Chen show that prices are less responsive to cost shocks than in a non-collusive environment, i.e., there is a certain degree of price rigidity.
While price- and quantity-related markers, such as the discussed variance screen, are relatively simple to apply and may be implemented with a limited amount of information, there is also some literature dealing with more complex, econometric detection methods for
5
bid-rigging cartels. However, such methods often require firm-specific data, e.g. cost estimates for concrete contracts, information about cost structure and capacity utilization of respective firms, or the distance between the location of a firm and the project site. Additionally, these methods usually require the modeling of a (competitive) auction process serving as counterfactual for a situation without collusion. The contributions by Porter and Zona (1993, 1999), Pesendorfer (1999) or Bajari and Ye (2003) can be cited as examples of such detection methods.Typically, these authors use data from bid-rigging cartels uncovered earlier and condemned by a competition authority. They then model counterfactuals fitting the specific circumstances of the examined cartels. Such methods may be very useful for a competition authority in order to show the anti-competitive effects of a specific bid-rigging cartel within a particular investigation. Furthermore, one may learn important lessons concerning the behavior of collusive firms. Yet, it is questionable whether complex, econometric methods are indeed suited for a wider, preventive screening activity. The sparsely documented attempts to use such methods for ex ante screening are – so far – not very encouraging (see Aryal and Gabrielli 2013).
3
Sample Construction and Descriptive Statistics
The starting point for the construction of our sample were the annual submission statistics of a Swiss canton5, listing all awarded contracts, grouped by the categories services, deliveries and
construction. These statistics contain the name of the winner of each tender, details on the
price granted, and a very short description of the tendered project. There is, however, no information on the losing bids. It was decided to focus on the category construction for two reasons: Firstly, in this sector several bid-rigging cartels have been uncovered and investigated by ComCo in the recent past. It thus seems to be a sector prone to collusion. Secondly, due to the relatively high number of annual tenders in this sector, the setup of a meaningful sample seemed realistic. All contracts not relating to “classical” construction work were eliminated from the sample. These were e.g. contracts for road surveillance equipment or protection equipment against rock fall. Furthermore, tenders for tunnel construction were eliminated since such contracts are only executed by a handful of specialized firms. After this process of elimination roughly 400 contracts connected to road construction in the canton X remained.
5 Due to confidentiality requirements, we refer to that Swiss canton as canton X in the following. With respect to
6
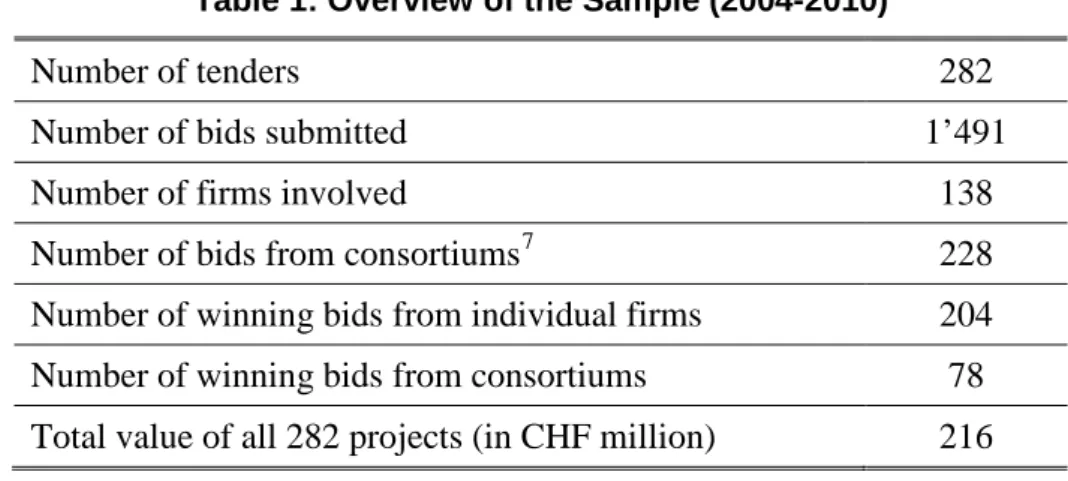
Information concerning the losing bids was gathered from the records of the tender opening, which contain the name of the bidders and their final bids. For 282 of the 400 contracts in the road construction sector, canton X was able to provide records of the tender opening. They cover the time period between 2004 and 2010. Table 1 summarizes some key data of the tenders in our sample. All in all, 138 firms submitted roughly 1’500 bids for the 282 tenders. Consortiums submitted 228 bids and won the tender in 78 cases. Consequently, 204 tenders were won by an individual firm.6 Overall, the total value of the 282 tenders – measured by the sum of all winning bids – amounts to roughly CHF 216 million.
Table 1: Overview of the Sample (2004-2010)
Number of tenders 282
Number of bids submitted 1’491
Number of firms involved 138
Number of bids from consortiums7 228 Number of winning bids from individual firms 204 Number of winning bids from consortiums 78 Total value of all 282 projects (in CHF million) 216
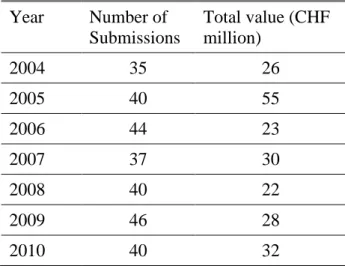
Furthermore, Table 2 shows the distribution of the tenders over the time period considered and the corresponding annual total value of the contracts. The annual number and the total value of the conducted tenders are quite evenly distributed over the years.8 Note, however, that the year 2005 is an exception since an especially large contract of CHF 25 million was tendered. The value of the majority of the contracts in the sample is between CHF 100’000 and CHF 600’000. The median value of the contracts amounts to roughly CHF 400’000 and the average contract value is around CHF 770’000. The considerable difference between the average and the median indicates a skewed distribution. This asymmetry is due to a few very large contracts in the sample. The average number of bids per tender amounts to 7 while the median (6) is only marginally lower.
6 This does not exclude the possibility that in some of these cases other firms were involved as sub-contractors.
7
A consortium is a business combination in which two or more firms submit a common bid for a specific tender.
8 Although the sample includes only ca. 60% of the initially identified 400 tenders, these 282 tenders reflect – on
a value basis – roughly 95% of all the tenders in the road construction sector tendered by canton X. Thus, the sample does not include all contracts but prima vista all the important ones.
7
The tenders differ furthermore with regard to the tender procedure (invitation vs. open procedure). In an invitation procedure, the procurement agency invites firms directly to submit a bid, i.e., there is no public tender and the number of submitters is limited. In general, public procurement agencies are legally obliged to solicit at least three bids. The invitation procedure may be used for contracts with a value of up to CHF 500’000. For contracts with a value of more than CHF 500’000, public procurement agencies in Switzerland must institute an open procedure, in which, all interested firms – without any constraints – may submit a bid. Thus, the contract is publicly tendered.
Table 2: Number and Value of Annual Tenders
Year Number of Submissions Total value (CHF million) 2004 35 26 2005 40 55 2006 44 23 2007 37 30 2008 40 22 2009 46 28 2010 40 32
Our sample contains 135 tenders which were tendered publicly (open procedure) and 147 tenders which were tendered by an invitation procedure. The average and the median of the contract values largely coincide (ca. CHF 250’000) in the invitation procedures. In contrast, there is a notable difference between the average (ca. CHF 1.3 million) and the median (ca. CHF 816’00) for the open procedures which can be explained by the existence of a certain number of very large contracts in the sample. The value of the 135 contracts tendered publicly amounts to roughly CHF 185 million, i.e., roughly 85% of the total value of all contracts in the sample. There is also a significant difference between the invitation and the open procedures with respect to the number of submitted bids: While procurement bodies usually invite 4 or 5 firms to submit a bid in an invitation procedure, more than 20 firms bid for certain large contracts in the open procedure.
8
4 Two Simple Statistical Markers
Our data set is not well-suited to test for all the statistical markers suggested in the literature. The quantity-related markers9 are in particular not likely to produce meaningful results for two reasons: Firstly, the contracts in our sample most likely only represent a part of the firms’ construction activities, i.e., the firms in our sample may also be active in sectors other than road construction (e.g. construction of buildings). Furthermore, the sample is restricted to road construction contracts tendered by the procurement body of canton X and does not account for tenders by local procurement bodies or private stakeholders. Consequently, there is no reliable information concerning firm-specific market shares in our sample. Secondly, annual demand for road construction (i.e. the number and the size of the tendered contracts) may fluctuate. This notion is supported by strongly fluctuating market shares (measured by the annual total value of realized contracts) of the firms in our sample. It is thus rather unlikely that an agreement on market shares can be realized short term. Yet, a focus on long-term market shares largely eliminates the intertemporal structure in the data imposed by (possible) collusion.
We therefore decided to primarily focus on price-related markers. Again, due to different reasons, it was not possible to test for the whole set of the price-related markers suggested in the literature. For example, to test whether there is a high degree of uniformity across firms in dimensions such as prices for ancillary services, one needs information not available in the records of the tender opening. Given the information available in our data set, it seemed most promising to focus on markers analyzing the structure among firms’ bids. In what follows, we apply two such markers to our data set.
4.1 Variance Screen
As discussed in section 2, the variance screen is the most comprehensively tested statistical marker to detect collusion. It seems therefore natural to start the analysis of our data set with this particular marker. In the context of bid-rigging, the coefficient of variation is normally used to implement the variance screen since the measure is scale-invariant and thus allows for
9 Harrington (2008) suggests three quantity-related markers: (1) highly stable market shares over time, (2)
subsets of firms for which each firm’s share of total supply is highly stable over time and (3) firms market shares negatively correlating with each other in time.
9
the comparison of bidding behavior for contracts with significantly differing values.10 In general, the coefficient of variation (CVj) is defined as the standard deviation (Stdj) divided by
the arithmetic mean (µj) of all bids submitted for tender j:
𝐶𝐶𝐶𝐶𝑗𝑗 =𝑆𝑆𝑆𝑆𝑆𝑆𝜇𝜇 𝑗𝑗 𝑗𝑗
The empirical literature assumes that low values of the coefficient of variation indicate price rigidity, i.e., suspicious bidding behavior. More precisely, significant non-temporary decreases in the coefficient of variation are taken as indication for periods of collusion and
vice versa.
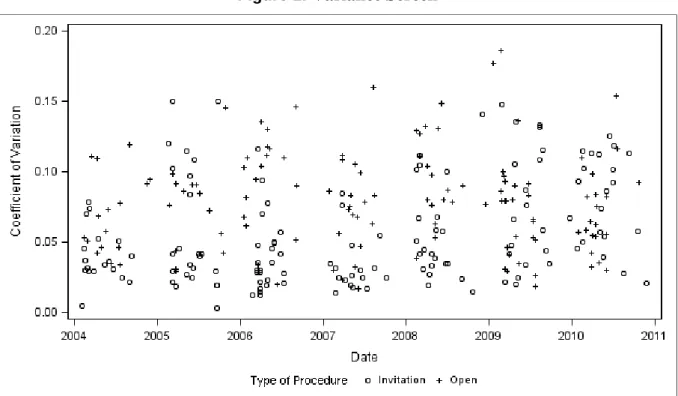
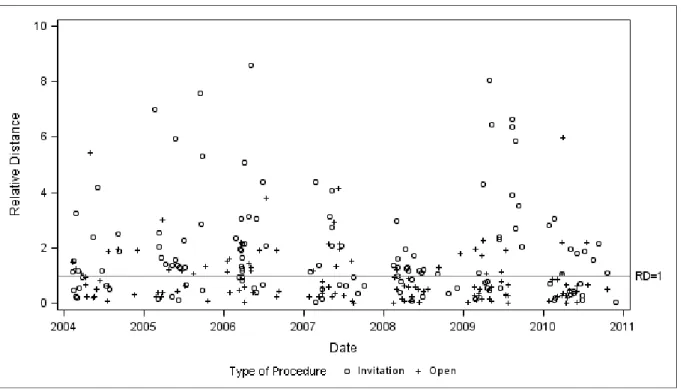
Figure 1: Variance Screen
Figure 1 shows the coefficient of variation of the bids submitted in both types of procedures for the – chronologically organized – 282 tenders in our sample. As can be observed, there is no peculiar evolution of the coefficient of variation over time, i.e., there are prima vista no time periods where the coefficient of variation systematically differs from other time periods. There is, however, a notable difference between invitation and open procedures: On average,
10 See e.g. Feinstein and Brock (1985), Abrantes-Metz et al. (2012), Jiminez and Perdriguo (2012) or Ragazzo
10
the coefficient of variation of the open procedures amounts to 0.081 while the corresponding value for the invitation procedures amounts to 0.058. Statistical tests confirm that the difference between the two types of tender procedures is significant.11 This finding may be interpreted as a (weak) indication that invitation procedures are more prone to bid-rigging than open procedures.
4.2 Cover Bidding Screen
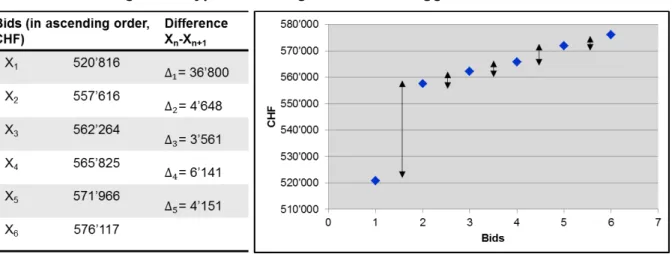
In the past few years, ComCo has uncovered several bid-rigging cartels in Switzerland.12 In many of these bid-rigging cases, it was striking that the difference between the loosing bids was systematically smaller than the difference between the winning bid and the second best bid. Figure 2 illustrates this finding:
Figure 2: Typical Bidding Behavior in Rigged Tenders13
Intuitively, such bidding behavior may be explained by the presence of cover bidding: Bidders not intending to win a contract offer distinctly higher prices than the agreed winner. This practice ensures that the designated winner gets the contract and that the winning bid
11 Note that the coefficient of variation in our sample is not distributed normally: The Kolmogorov-Smirnov test
for normality rejects the null hypothesis at the 5% significance level. Other normality diagnostic tests –Shapiro-Wilk, Cramer-Von Mises and Anderson-Darling – also reject the null hypothesis (at the 1% significance level). The difference between the two types of tender procedures is confirmed by the Mann-Whitney test, which rejects the null hypothesis of no difference between the two distributions with a z-statistic of 5.58 (p-value: < 0.0001). Also, the Kolmogorov-Smirnov test rejects the null-hypothesis of no difference between the distribution of the coefficient of variation for both procedures with an asymptotic Kolmogorov-Smirnov statistic of 3.27 (p-value: < 0.0001).
12 See footnote 3.
13
11
appears to be competitive. There are three reasons why such bidding behavior is realistic in practice: Firstly, in many contracts the price is not the only criterion procurement authorities take into consideration. Other criteria, such as the offered technical solution, quality or environmental aspects, may be taken into account when deciding on the winner of a contract. Such non-monetary criteria may influence the award of a contract and undermine intended bid-rigging especially when bids are close to each other. Secondly, witnesses in bid-rigging cases have reported that members of bid-rigging cartels usually make sure that the designated winning bid is 3-5% lower than the second best bid.14 Thirdly, losing bids may be close to each other because no bidder wants to risk being perceived as overly expensive in the eyes of the procurement agency.
Based on the described bidding behavior, it is possible to construct an alternative price-related marker by considering the difference between loosing bids and the difference between the two best bids for a specific contract.15 To test whether cover bidding might be present, we calculate the ratio between the difference of the two lowest bids (∆j,1) and the standard
deviation of the loosing bids (σj,lb). This yields the following formula for the measure of
relative distance (RD):
𝑅𝑅𝑅𝑅𝑗𝑗 =𝜎𝜎∆𝑗𝑗,𝑙𝑙 𝑗𝑗,𝑙𝑙𝑙𝑙
Note that the standard deviation should only be calculated for the loosing bids since the difference between the two best bids is anomalously high when collusion is present. Without this correction, the standard deviation would be distorted up.16 The relative distance measure has to be interpreted as follows: A RD of approximately 1 indicates that there is no difference in the bidding behavior of the winner and the rest of the bidders (see the reference line in figure 3), i.e. there is no suspicious bidding behavior. A RD (much) larger than 1 indicates,
14
See e.g. Strassenbeläge Tessin (LPC 2008/1, pp. 85-112, in particular recital 60) or Wettbewerbsabreden im
Strassen- und Tiefbau im Kanton Zürich (LPC 2013/4, pp. 524-652, in particular p. 561, recital 182 and p. 573,
recital 309 and 314).
15
The general idea to consider the differences between winning and losing bids to identify bid-rigging was already proposed in the seventies (see OECD 1976). Yet, a concrete statistical marker has – to the best of our knowledge – not yet been suggested in the literature.
16
It is of course possible to define the measure for relative distance differently. For instance, one may calculate the difference between the two best bids and divide it by the mean of the differences between losing bids instead of the standard deviation. We also performed the cover bidding test in this alternative way: results qualitatively remain, however, the same.
12
however, that cover bidding may have taken place. Figure 3 depicts the relative distance measure for all tenders in our sample, in chronological order and by procedures.
Figure 3: Cover Bidding Screen
From Figure 3 conclusions similar to the case of the variance screen can be drawn. On the one hand, there are no peculiar developments of the RD observable over time, i.e., time periods where the RD systematically differ from other time periods cannot be identified. On the other hand, with an average of 1.92 the cover bidding test again suggests that collusion is more likely to be present in invitation procedures. In contrast, the average of the relative distance measure for open procedures only amounts to 1.2.17
17 As in the case of the coefficient of variation, the Kolmogorov-Smirnov test (at the 5% significance level) – as
well as the Shapiro-Wilk, Cramer-Von Mises and Anderson-Darling tests (at the 1% significance level) – rejects the normality hypothesis. The Mann-Whitney test confirms that there is a significant difference between the two types of tender procedures (z-statistic: 5.58; p-value: < 0.0001), a result also corroborated by the Kolmogorov-Smirnov test (asymptotic Kolmogorov-Kolmogorov-Smirnov statistic: 3.27; p-value: < 0.0001).
13
5 Screening for Partial Collusion
Our analysis so far indicates that firms in canton X do not seem to be involved in a systematic market-embracing collusive scheme. Furthermore, the two applied markers suggest that collusion – if present at all – is more likely to occur in invitation procedures. Both of these results are not surprising. ComCo’s investigations concerning bid-rigging have revealed that cartels in construction markets often are partial, i.e., they only involve a subset of colluding firms or collusion is targeted at specific contracts. Thus, excluding the presence of bid-rigging from the results derived above would be premature. In the remainder of this section we will show how partial collusion may be detected.
5.1 Multistep Procedure to Detect Partial Collusion
A crucial prerequisite to detect partial collusion with a statistical marker is a sufficient degree of regular interaction between stable groups or sub-groups of firms. Irregular and selective bid-rigging agreements between firms loosely connected (e.g. for special types of projects) are, however, extremely hard – if not impossible – to identify with a screen. The approach we present in the following amounts to a collection of mutually reinforcing tests which allow conclusions as to whether collusion is likely to exist between subgroups of firms. All of the suggested tests may be extended, refined and adapted to the specific features of other cases in which bid-rigging is suspected.
Our procedure consists of four steps. In the first step we isolate contracts and firms exhibiting a specific (suspicious) bidding pattern from our data set. To this purpose, we combine the variance and the cover bidding test, and screen for contracts which simultaneously exhibit a low coefficient of variation and a high relative distance measure. The reason for combining the two screens is simply that we want to produce a conservative sample of suspicious contracts and firms. Given that results pointing to the existence of bid-rigging may in practice trigger the opening of an antitrust investigation – most likely accompanied by drastic investigative measures such as surprise inspections (“dawn raids”) –, it seems to be a reasonable strategy to minimize the probability of type I errors right from the start.18
18 Statistically, a type I error occurs when the null hypothesis is incorrectly rejected. In our case, a type I error
would imply a contract is wrongly labeled as collusive. By combining the screens, we attempt to reduce the risk of erroneously flagging a contract as collusive since two different criteria must be satisfied simultaneously.
14
Since a certain degree of repeated interaction is a basic ingredient of most bid-rigging cartels (see e.g. Feinstein and Brock 1985), we analyze in a second step whether there are groups of firms regularly submitting bids for the same conspicuous contracts. There is no obvious “automatic” process which could be used to identify possible groups of colluding firms. Statistical methods potentially suited for such a purpose, e.g. cluster analysis, are explorative processes. In other words, there is no given algorithm which could be applied to our sample – rather, the goal is to find an appropriate algorithm. Based on a simple iterative process we identify conspicuous groups of firms and analyze the interaction between firms within such groups.
In a third step, we analyze geographical bidding behavior. More precisely, we want to know whether the identified conspicuous groups of firms are active in the entire territory of canton
X or whether possible collusion is restricted to certain regions. Delineating the area where a
potential bid-rigging cartel is active then allows to analyze local competitive forces, i.e., how many firms regularly submit bids in a certain region, whether these are mainly “suspect” firms or if there are other firms active in this region etc. Overall, such an analysis provides important conclusions as to whether (suspected) collusion is likely to be stable. Furthermore, an affirmative result reinforces and substantiates the group formation process.
In the absence of side payments, bid-rigging agreements usually involve a rotation element to sustain collusion (see e.g. Pesendorfer 2000). In other words, a rational firm will only renounce to submit a truly competitive bid for a contract if other cartel members reward it for this behavior in the future. Typically, the reward for such cover bidding or bid suppression is the assignment of future contracts. In a fourth step – presented separately in section 6 – we develop a graphical method designed to visualize bid rotation within a group of firms.
5.2 Empirical Implementation of the Multistep Procedure
5.2.1 Identification of Conspicuous Contracts and Firms
In the first step of the multistep procedure, we want to isolate conspicuous contracts and firms from our sample by simultaneously applying the variance and the cover bidding test. Two issues need to be discussed in this context: First, although the variance and the cover bidding test capture conceptually different aspects of the price setting behavior of colluding firms, it cannot be excluded that the results of the two tests correlate in practice. In this case,
15
combining the two screens would be of limited value. The correlation between the CV and the
RD amounts to -0.15 (p-value: 0.0811) for open procedures and -0.16 (p-value: 0.0623) for
invitation procedures.19 In other words, for both types of procedures, there is no significant correlation between the two markers.
The second issue to discuss is the following: To separate conspicuous from inconspicuous tenders, a threshold for the CV and the RD has to be defined. In the case of the RD this is relatively straightforward: A RD larger than 1 points to a conspicuous tender (see section 4.2). For the CV the determination of a reasonable threshold is, however, less obvious – there is no theoretical argument for a specific level of the CV separating conspicuous from inconspicuous contracts. Yet, practical experience with bid-rigging cartels in the road construction sector may be a viable way to determine a threshold for the CV. Calculations made by ComCo have, for example, revealed that in the case of the road construction cartel in the canton of Ticino the CV amounted to 0.03 on average during the cartel phase. Additionally, there were almost no tenders with CV values higher than 0.05. After the breakdown of the cartel, the CV – on average – increased to 0.098.20 Given that this cartel was very well organized (the members of the cartel e.g. held weekly cartel meetings) and basically involved all firms located in the canton of Ticino, a value of 0.03 of the CV may be interpreted as a conservative benchmark for rigged tenders. In contrast, the road construction cartel in the canton of Aargau may serve as an example of a much more loosely organized cartel.21 The cartel was characterized by partial collusion between 17 construction firms and collusion was not targeted at all road construction contracts in the canton. The average CV for the roughly 100 rigged contracts that were investigated by ComCo amounted to 0.06. Thus, for an initial screen, one may arrive at the hypothesis that tenders with a CV above 0.06 and a RD below 1 are inconspicuous and
vice versa.
Applying this initial screen to our data set (scenario 1 in Table 3) results in the identification of 80 conspicuous contracts, i.e., in this scenario, bid-rigging cannot be excluded for more than 25% of all contracts in our sample. Given our results in section 4, it is also not surprising
19 We use the Spearman correlation test because the CV and the RD are not normally distributed (see section 4).
In section 4, we highlighted a significant difference between the two types of tender procedures: the coefficient of variation is lower and the relative distance measure larger for the invitation procedure as compared to the open procedure. Given these differences it seems appropriate to apply the correlation test separately to each procedure type.
20 See Strassenbeläge Tessin (LPC 2008/1, pp. 85-112), especially p. 103.
16
to find that the majority of these contracts (approx. 80%) were tendered by invitation procedure. Still, a non-negligible fraction of the contracts identified in scenario 1 is tendered by open procedure. Scenario 1 is a relatively rigorous screen. We therefore tested two more conservative scenarios (scenario 2 and 3 in Table 3). Even in the most conservative scenario (CV ≤ 0.03 and RD > 1.30) we identify 38 contracts deemed conspicuous.
Table 3: Identification of Conspicuous Contracts – 3 Scenarios
Scenario CV RD Number of Contracts % of Total Sample Invitation Procedure Open Procedure 1 ≤ 0.06 > 1.00 80 28.4% 63 17 2 ≤ 0.05 > 1.15 65 23.1% 53 12 3 ≤ 0.03 > 1.30 38 13.5% 30 8
Having isolated different sets of conspicuous contracts, we proceed by identifying all firms bidding for the corresponding contracts. More precisely, we identify the firms which have submitted a bid for at least 10% of all conspicuous contracts for each scenario in Table 3 (e.g., for scenario 1, we consider only firms which submitted a bid for at least eight conspicuous contracts). The purpose of this threshold is to eliminate “fringe bidders”, i.e. firms which do not regularly submit bids for conspicuous contracts. Such firms are unlikely to be part of a stable collusive scheme.
Interestingly, the list of firms turns out to be independent of the chosen thresholds: in all three scenarios the same 17 firms submitted a bid for at least 10% of the conspicuous contracts. The only difference between the scenarios is the ranking of the firms as pertaining to the absolute number of bids submitted for conspicuous contracts. Thus, the observed suspect bidding behavior can be exclusively attributed to 17 firms. Accounting for the fact that overall 138 firms have at least once submitted a bid in our sample, this result suggests that if bid-rigging occurred in canton X, these 17 firms were most likely involved.22
22 Of course, this does not permit the reverse conclusion that all other firms in our sample were not involved in
collusion. One can only draw the conclusion that these firms do not exhibit a bidding behavior the applied screen identifies as conspicuous.
17
5.2.2 Analysis of Firm Interaction
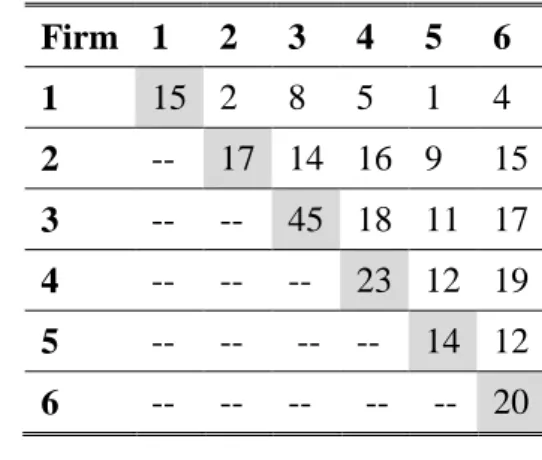
To analyze the interaction between the 17 suspect firms, we started with a simple matrix quantifying how many times a firm had participated in a conspicuous tender at the same time as another firm. In order to arrive at the most comprehensive result possible, we decided to continue the analysis with the 80 conspicuous contracts identified in scenario 1. Our results show that some firms often and regularly submitted bids for the same conspicuous contracts while others either never interacted with other suspect firms or only on a very limited basis. Since it is natural to assume that a bid-rigging cartel involves a certain degree of (regular) interaction between firms this finding is indicative of the non-existence of a collusive agreement between all 17 firms. Based on this argument, the matrix was reduced to sub-matrices of firms that interacted (more or less) regularly with each other. By iterating the process, two potentially interesting groups of firms were condensed. For illustrative purposes we will only focus on one of these groups in what follows.23
As can be observed from Table 4, firms 2, 4, 5 and 6 seem to interact often and regularly. Consider firm 2, for example: Overall, firm 2 submitted 17 bids for conspicuous projects. For 16 of these projects (94%) firm 4 also submitted a bid. Furthermore, for 9 (53%), respectively 15 (88%) of these 17 projects firms 5 and 6 likewise submitted a bid. A similar pattern can be found when analyzing the bidding behavior of firms 4, 5 and 6. Additionally, all these firms submitted a comparable number of bids for conspicuous projects. Thus, the high degree and symmetry of interaction between these firms may serve as an indication for a group of colluding firms.
Table 4: Interaction between Firms in Conspicuous Contracts
Firm 1 2 3 4 5 6 1 15 2 8 5 1 4 2 -- 17 14 16 9 15 3 -- -- 45 18 11 17 4 -- -- -- 23 12 19 5 -- -- -- -- 14 12 6 -- -- -- -- -- 20 23
All analyses discussed in the following were also conducted for the group of firms identified in the second sub-matrix. Overall, results for this second group of firms are somewhat less indicative. In particular, the degree of interaction between these firms is lower and bidding behavior for conspicuous contracts is less symmetric. In other words, in case there is collusion between the firms in this second group it is not as pronounced as the suspected collusion in the first group.
18
Consider next that firm 3 is a much larger construction company than the other four firms (2,
4, 5 and 6). This is reflected in the fact that this firm submitted altogether 45 bids for
conspicuous contracts. Besides this fact, the bidding behavior of firm 3 is however more or less comparable to the other four firms which suggests that firm 3 may also be a member of the identified group of possibly colluding firms. Lastly, the somewhat special case of firm 1 needs to be discussed. Firm 1 is a relatively large construction company, too, which, – following a merger – exited the market in 2006. This explains the lower interaction between firm 1 and the rest of the firms in Table 4. Still, until 2006, firm 1 seems to have interacted regularly with the other firms. It is therefore not unlikely that firm 1 has also been a member of a collusive group of firms until 2006.
5.2.3 Geographical Analysis
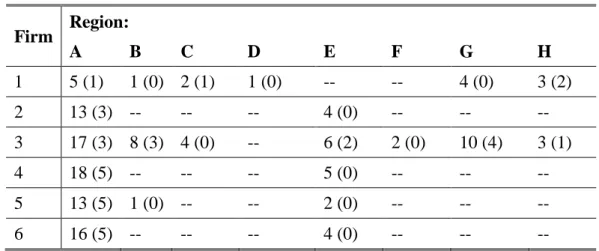
The analysis of the bidding interaction conducted above allowed the identification of a group of six firms which were possibly involved in a collusive scheme. By means of the records of the bid opening of canton X, it is further possible to allocate each contract to a specific region. Table 5 shows the number of submitted bids for conspicuous contracts for the six suspect firms, sorted by the eight regions of canton X. The numbers in the brackets refer to the number of contracts actually won by the respective firm.
Table 5: Regional Bidding for Conspicuous Contracts
Firm Region: A B C D E F G H 1 5 (1) 1 (0) 2 (1) 1 (0) -- -- 4 (0) 3 (2) 2 13 (3) -- -- -- 4 (0) -- -- -- 3 17 (3) 8 (3) 4 (0) -- 6 (2) 2 (0) 10 (4) 3 (1) 4 18 (5) -- -- -- 5 (0) -- -- -- 5 13 (5) 1 (0) -- -- 2 (0) -- -- -- 6 16 (5) -- -- -- 4 (0) -- -- --
As can easily be observed from Table 5, it is in particular region A and E where the suspect firms are jointly active. These are in fact neighboring regions. Participation in conspicuous contracts in region E is, however, substantially lower than in region A and – with the exception of firm 3 – no firm ever won a conspicuous contract in this region. In fact, firms 2,
19
4, 5 and 6 only won conspicuous contracts in region A, which suggests that the analysis
should focus on this region. Overall, 21 conspicuous contracts were identified in region A whereby firms 2, 4, 5 and 6 won 19 of these tenders, either alone or as members of a consortium.24 Only two conspicuous contracts were not won by a member of the suspect group of firms. It is further interesting to note that (with the exception of firm 1 which exited the market in 2006) all firms submitted bids for at least 13 conspicuous contracts and won between three and five contracts.
As mentioned above, firm 3 is much larger than the other firms, which is also confirmed by its wider geographic activity. Although firm 3 submitted the highest number of bids for conspicuous contracts in region A, it cannot be excluded that this firm is involved in other (regional) collusive schemes, e.g. in regions B and G. Keeping in mind that firm 1 is also a large construction company and exited the market in 2006, the same can be said for this firm: in absolute numbers, firm 1 submitted the majority of its bids for conspicuous contracts in region A. However, it also won conspicuous contracts in regions C and H and could therefore have been involved in bid-rigging activities in these regions.
To sum up, the geographical analysis largely validates the results of the group formation process and raises suspicions concerning a local bid-rigging cartel operating in region A.25 In this context it is further interesting to note that the potential for competition from non-members of the identified suspicious group of firms in region A is limited: According to the 2008 firm census of the Swiss Federal Statistical Office there are only 6 construction firms located in region A which identified road construction as their principal business activity. Thus, this characteristic of region A certainly may create an environment where collusion could potentially be sustained and stabilized.
24 Note that the numbers in the brackets for the contracts won in region A sum up to 22 and not to 19. This is due
to the fact that a consortium of two firms won a contract in three cases.
25 Our observations are also supported by a Chi test: There is a statistical significant relationship between regions
20
6 Screening for Bid Rotation
In a final step, we focus on the practice of bid rotation in order to further substantiate the group formation process and to produce a better understanding of the organization and operation of a possible bid-rigging cartel.
6.1 The Connection between Bid Rotation and Cover Bids
The practice of bid rotation typically involves submitting cover bids for contracts. Bid rotation is therefore likely to produce a distinct bidding pattern: whenever the designated winner submits a “low” bid, all other firms will submit a deliberately “high” bid. To test whether the members of our potential bid-rigging cartel systematically behave in a way consistent with bid rotation, we start by normalizing bids. This is necessary since the value of the contracts in our sample varies considerably, i.e. it is not possible to directly compare individual bids from different tenders. A well-known standard transformation to normalize bids in a tender j is the following:
where denotes the bid of firm i and ( ) the lowest (highest) bid in tender j. This transformation assigns a value between 0 and 1 to every bid in our sample and therefore allows for a comparison of different-valued bids. Note that value 0 is always assigned to the lowest bid, while the highest bid gets assigned value 1.
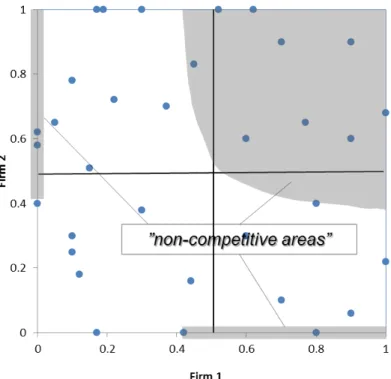
With the help of these normalized bids it is now possible to analyze the bidding behavior of the suspect firms pairwise. The basic idea of this analysis is illustrated in Figure 4: For all conspicuous contracts in which two suspect firms simultaneously submitted a bid, the corresponding normalized values are shown in the x/y-space. A point on the ordinate or the abscissa implies that one of the two firms actually won the contract, i.e. submitted the lowest bid in a distinctive tender.26 For all other points, none of the two firms considered in the diagram were assigned the contract.
26 All of the 21 conspicuous contracts analyzed in section 5 and 6 were awarded to the lowest bidder.
[ ]
0,1 min , max , min , , , − ∈ − = j j j i j norm i j b b b b b i j b , bj,min bj,max21
In a competitive environment – i.e., when firms calculate bids independently – one would expect the combinations of bids to be distributed (more or less) randomly in the x/y-space.27 The most competitive combinations of bids are to be found in the bottom left quadrant close to the origin. Furthermore, combinations of bids where only one of the considered firms bids aggressively are to be found close to the ordinate respectively the abscissa. In general, when firms bid independently (i.e., in a situation without collusion) one would expect to find a certain mass of points in the bottom left, the top left and the bottom right quadrant of Figure 4.
Figure 4: Competitive vs. Non-Competitive Bids
In contrast, if bids are systematically calculated to ensure that a designated firm wins a tender – i.e., cover bidding is present – one would expect to find the following graphical pattern: First, there should be a tendency to find cover bids submitted for the other considered firm either on the ordinate in the top left quadrant or on the abscissa in the bottom right quadrant. Second, if the considered firms jointly and repeatedly cover other cartel firms, this will lead to a certain mass of points in the top right quadrant. The shaded areas of Figure 6 show where cover bids are likely to be found.28
27
This intuition is confirmed by an analysis of the bidding behavior of non-suspicious firms and contracts in our sample: bids are not accumulated in particular regions of the x/y-space, i.e., they are – more or less – evenly distributed all over the x/y-space.
28 Note that it is not possible to precisely determine the boundaries of the areas where cover bids are likely to be
22
6.2 Empirical Implementation
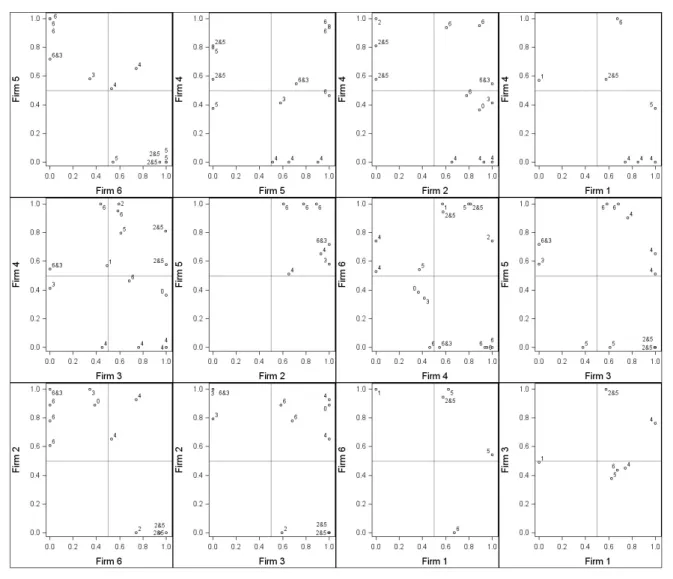
Figure 5 shows the pairwise bidding behavior of the six suspect firms for the conspicuous contracts in region A.29 Each contract is assigned a number indicating the firm which actually won the respective contract. Note that there is one contract not won by the group of the six suspect firms. This contract is marked with a zero. Furthermore, when a consortium wins the tender, the number of both firms is indicated. As can easily be observed, the individual diagrams do not point in the direction of much competitive interaction between the suspect firms. Rather, the depicted bidding behavior seems compatible with cover bidding: there are hardly any points in the area where competitive bids would be expected. The bottom left quadrant is in all cases empty or near empty. Furthermore, there are no loosing bids notably lower than 0.4, which suggests that there are substantial price differences between the winning and the losing bids in all respective tenders.
This first result does not come as a complete surprise since all considered tenders showed a certain conspicuousness as pertaining to the cover bidding test, i.e., these contracts are inter
alia characterized by the fact that the difference between loosing bids is systematically
smaller than between the winning and the second best bid. The diagrams contain, however, much more information. In particular, they visualize the connection between cover bids and bid rotation: From Figure 5 it can be observed that all suspect firms submit bids for conspicuous contracts with pronounced regularity.30 Each of the suspect firms has on average and simultaneously with another suspect firm submitted bids for roughly 10 conspicuous contracts. An additional analysis shows that suspect firms exclusively submitted bids for 14 contracts, and that 91% of all considered submitted bids came from the suspect group of firms. These results and figures point in the direction of a high degree of entanglement between the suspect firms.
29 We renounce to show three graphs in Figure 5 since they are characterized by very few interactions between
the two bidders and are therefore not illustrative. All three suppressed graphs involve firm 1 which exited the market in 2006.
30 It should not be assumed that all suspect firms submit a bid for every rigged tender. Factors, such as the
specialization of firms, distance to the construction site, capacity utilization etc., decide which firms of a cartel will submit a bid for a distinct contract. Furthermore, the possibility of bid suppression has to be kept in mind.
23
Figure 5: Pairwise Bidding Behavior for Suspect Firms in Region A
There is another interesting observation derived from Figure 5. Considering the winning bids on the ordinates and abscissas, we observe a certain symmetry: The number of winning and (possible) cover bids between the individual firms is largely equal.31 This may be taken as an indication for the fact that “scores” between the firms exist and get settled. In summary, the identified group-internal bidding behavior may well be compatible with a bid-rigging cartel operating with cover bids and a – more or less pronounced – rotation scheme.
31 Since the distinct contracts vary with respect to contract values, there is no reason to belief that the number of
winning and (possible) cover bids between two firms must necessarily be equal. A cover bid for a large contract may e.g. be worth two cover bids for smaller contracts.
24
7 Conclusions
A successful fight against bid-rigging today still largely depends on whistle-blowers or leniency applicants. Screening tools may therefore constitute important instruments to mitigate the dependency on these external sources and actively reinforce the fight against bid-rigging. Besides the benefit of identifying concrete bid-rigging cartels, the successful implementation of cartel detection instruments is furthermore likely to have a strong deterrence effect. In this paper we presented a detection method characterized by the following three properties: Its data requirements is relatively modest, it is simple to apply, and it has produced evidence considered sufficient enough to open an antitrust investigation. In our view, all of these properties are crucial for preventive screening activities of any competition or procurement authority.
The presented approach to detect bid-rigging contributes to the screening literature in several ways. First, we present a new statistical marker to detect cover bidding. Second, we call attention to the possibility of partial collusion in a data set, which implies that the classical markers discussed in the literature will fail, and propose a way to deal with this problem. In particular, we show how benchmarks and the combination of (uncorrelated) screens may be used to identify subsets of conspicuous contracts and firms. To substantiate and validate suspicions of collusive behavior we further discuss a collection of mutually reinforcing tests providing conclusions as to whether a bid-rigging cartel is likely to exist.
Although the application of the suggested method to previously uncovered bid-rigging cases in Swiss road construction delivers coherent results, our method is, of course, as all other methods discussed in the literature, to a certain degree case-specific and data driven. Some of the suggested tests may be inapplicable depending on the specific features of the industry in which bid-rigging is suspected. Others may have to be extended, refined and adapted. Given that collusion may take a multitude of forms in the real world and data availability may differ from case to case, the flexibility of our “toolbox-approach”, however, seems to be more of an advantage than a disadvantage.
25
References
Abrantes-Metz R., L. Froeb, J. Geweke and C. Taylor (2006) A Variance Screen for Collusion, International Journal of Industrial Organization, Vol. 24, pp. 467-486.
Abrantes-Metz R., M. Kraten, A. D. Metz and G. Seow (2012) Libor Manipulation?, Journal
of Banking and Finance, Vol. 36, pp. 136-150.
Aryal G. and M.F. Gabrielli (2013) Testing for collusion in asymmetric first-price auctions,
International Journal of Industrial Organization, Vol 31, pp. 26-35.
Athey, S., K. Bagwell and C. Sanchirico (2004) Collusion and Price Rigidity, Review of
Economic Studies, Vol. 71, pp. 317-349.
Bajari, P. and L. Ye (2003) Deciding Between Competition and Collusion, The Review of
Economic and Statistics, Vol. 85, Nr. 4, pp. 971-989.
Bolotova, Y., J.M. Connor and D.J. Miller (2008) The Impact of Collusion on Price Behavior: Empirical Results from Two Recent Cases, International Journal of Industrial
Organization, Vol. 26, pp. 1290-1307.
Connor, J. and R. Lande (2006), The Size of Cartel Overcharges, Antitrust Bulletin, 51, pp. 983-1022.
Grout, P.A and S. Sonderegger (2005) Predicting Cartels, Office of Fair Trading Discussion
Paper (OFT 773), London: Office of Fair Trading.
Esposito and Ferrero (2006), Variance Screens for Detecting Collusion: An Application to Two Cartel Cases in Italy, Working Paper.
Estrada and Vasquez (2013), Bid Rigging In Public Procurement Of Generic Drugs In Mexico, Competition Policy International, July.
Harrington J.E. and J. Chen (2006) Cartel Pricing Dynamics with Cost Variability and Endogenous Buyer Detection, International Journal of Industrial Economics, Vol. 24, pp. 1185-1212.
Harrington, J.E. (2007) Behavioral Screening and the Detection of Cartels. In: Ehlermann C.-D. and I. Atanasiu (eds) European Competition Law Annual 2006: Enforcement of the Prohibition of Cartels, Oxford: Hart.
Harrington, J.E. (2008) Detecting Cartels. In: Buccirossi P (ed) Handbook of Antitrust Economics, MIT Press.
Ishii, R. (2009) Favor exchange in collusion: Empirical study of repeated procurement auctions in Japan, International Journal of Industrial Organization, Vol. 27(2), pp. 137-144.
26
Jiménez, J.L. and J. Perdiguero (2012) Does Rigidity of Prices Hide Collusion?, Review of
Industrial Organization, Vol. 41(3), pp. 223-248.
Mena-Labarthe (2012), Mexican Experience in Screens for Bid-Rigging, Competition Policy
International Antitrust Chronicle.
Pesendorfer, M (2000) A Study of Collusion in First-Price Auctions, Review of Economic
Studies, Vol. 67, Nr. 3, pp. 381-411.
Porter, R.H. and J.D. Zona (1993) Detection of Bid Rigging in Procurement Auctions,
Journal of Political Economy, Vol. 101, Nr. 3, pp. 518-538.
Porter, R.H. and J.D. Zona (1999) Ohio School Milk Markets: An Analysis of Bidding, Rand
Journal of Economics, Vol. 30, Nr. 2, pp. 263-288.
OECD (2014), Roundtable on ex officio Cartel Investigations and the use of screens to detect cartels, Background Note by the Secretariat.
OECD (1976), Soumissions concertées, Paris.
Ragazzo (2012), Screens in the Gas Retail Market: The Brazilian Experience, CPI Antitrust
Authors
David IMHOF
Economist, Secretariat of the Swiss Competition Commission. Email: [email protected]. Affiliated to the University of Fribourg (Switzerland), the University of Franche-Comté (France) and Unidistance (Formation universitaire à distance, Switzerland).
Yavuz KARAGÖK
Senior Economist, Secretariat of the Swiss Competition Commission. Email: [email protected] Samuel RUTZ
Project Manager, Avenir Suisse. Email: [email protected]
Bd de Pérolles 90, CH-1700 Fribourg Tél.: +41 (0) 26 300 82 00
[email protected] www.unifr.ch/ses Université de Fribourg, Suisse, Faculté des sciences économiques et sociales
Universität Freiburg, Schweiz, Wirtschafts- und sozialwissenschaftliche Fakultät University of Fribourg, Switzerland, Faculty of Economics and Social Sciences
Working Papers SES collection
Abstract
This paper proposes a method to detect bid-rigging by applying mutually reinforcing screens to a road construction procurement data set from Switzerland in which no prior information about collusion was available. The screening method is particularly suited to deal with the problem of partial collusion, i.e. collusion which does not involve all firms and/or all contracts in a specific data set, implying that many of the classical markers discussed in the corresponding literature will fail to identify bid-rigging. In addition to presenting a new screen for collusion, it is shown how benchmarks and the combination of different screens may be used to identify subsets of suspicious contracts and firms in a data set. The discussed screening method succeeds in isolating a group of “suspicious” firms exhibiting the characteristics of a local bid-rigging cartel operating with cover bids and a – more or less pronounced – bid rotation scheme. Based on these findings the Swiss Competition Commission (ComCo) decided to open an investigation
Citation proposal
Imhof David, Karagök Yavuz, Rutz Samuel. 2016. «Screening for Bid-rigging – Does it Work?». Working Papers SES 468, Faculty of Economics and Social Sciences, University of Fribourg (Switzerland)
Jel Classification
C00, C40, D22, D40, K40, L40, L41
Keywords
bid-rigging, screening method, variance screen, cover bidding screen, bid rotation test, partial collusion
Last published
462 Denisova-Schmidt E., Huber M., Prytula Y.: An Experimental Evaluation of an Anti-Corruption Intervention among Ukrainian University Students; 2015
463 Böhm S.: Regional Economic Integration and Factor Mobility in Unified Germany; 2015 464 Grossmann V., Strulik H.: Optimal Social Insurance and Health Inequality; 2015
465 Baguet M., Dumas C.: Birth weight and long-term outcomes in a developing country; 2015
466 Bodory H., Camponovo L., Huber M., Lechner M.: The finite sample performance of inference methods for propensity score matching and weighting estimators; 2016
467 Denisova-Schmidt E., Huber M., Leontyeva E.: On the Development of Students’ Attitudes towards Corruption and Cheating in Russian Universities; 2016
Catalogue and download links
http://www.unifr.ch/ses/wp
http://doc.rero.ch/collection/WORKING_PAPERS_SES
Publisher