HAL Id: hal-03030558
https://hal.archives-ouvertes.fr/hal-03030558
Submitted on 30 Nov 2020HAL is a multi-disciplinary open access archive for the deposit and dissemination of sci-entific research documents, whether they are pub-lished or not. The documents may come from teaching and research institutions in France or abroad, or from public or private research centers.
L’archive ouverte pluridisciplinaire HAL, est destinée au dépôt et à la diffusion de documents scientifiques de niveau recherche, publiés ou non, émanant des établissements d’enseignement et de recherche français ou étrangers, des laboratoires publics ou privés.
pyroclastic rocks of Trindade Island, South Atlantic
Ana Carolina Campos Mateus, Angélica Fortes Drummond Chicarino
Varajão, Fábio Soares De Oliveira, Sabine Petit, Carlos Ernesto Gonçalves
Reynaud Schaefer
To cite this version:
Ana Carolina Campos Mateus, Angélica Fortes Drummond Chicarino Varajão, Fábio Soares De Oliveira, Sabine Petit, Carlos Ernesto Gonçalves Reynaud Schaefer. Geochemical evolution of soils developed from pyroclastic rocks of Trindade Island, South Atlantic. Brazilian journal of geology, In press, 51, �10.1590/2317-4889202120200073�. �hal-03030558�
Abstract
The geochemical behavior of the major, minor, trace and rare earths elements (REEs) in soil profiles from ultramafic volcanoclastic rocks of the Vulcão do Paredão and Morro Vermelho Formation from Trindade Island (TI) was analyzed in this study. Losses and gains of chemical elements were calculated through the mass balance for two profiles along the slope: one located at higher altitude (460 m) and the other at lower altitude (258 m). In all profiles, Al, Fe and Ti accumulate due to their low mobility, whereas Ca, Na, K and Mg are the most intensely leached. Soils located at lower altitude show higher K and Mg values in the surface due to the contribution of saline sprays. Leaching of the REEs from higher to the lower slope led to the enrichment of these elements, especially the light REEs, in the soil at the lowest altitude (258 m). The high altitude profile showed Ce positive anomaly due to longer exposure to weathering. The geochemical balance shows a rela-tive enrichment of Ti, Mn, Fe, Co, Cr, Ni, V, Zr, S related to the loss of mobile elements during the soil formation process, despite the youthful nature of these volcanic rocks.
KEYWORDS: Geochemical balance, REEs, Inductively coupled plasma atomic emission spectroscopy (ICP-AES).
https://doi.org/10.1590/2317-4889202120200073
ORIGINAL ARTICLE
INTRODUCTION
The distribution and migration of the chemical elements, and the chemical reactions during weathering and soil for-mation processes are essential in pedogeochemical studies (Carvalho 1995). The meteoric water reacts with most rock minerals, and new stable mineral phases are formed under new physicochemical conditions (Carvalho 1995, Putnis 2009). In this process, some chemical elements are leached out, while others are concentrated.
The chemical reactions occurring during the soil forma-tion determine the mobilizaforma-tion and redistribuforma-tion of ele-ments within the soil profile, and a significant correlation can be recorded between the total concentration of elements in soils and parent material (Roca et al. 2008). To study
the dis-tribution and migration of chemical elements along the soil profile, the chemical mass balance between the parent mate-rial and the alteration products is used, an isovolumetric
change (Millot and Bonifas 1955, Gardner 1980, Cramer and Nesbitt 1983).
In the Brazilian territory, there are few studies on the geo-chemistry of soils from volcanic oceanic islands, specifically on the latest pyroclasts. Of the existing studies, few report the geochemical evolution of soil formation. Among them, there are the studies of Oliveira et al. (2014) that showed the soil
phosphatization process of Rata Island (Fernando de Noronha Archipelago) due to the interaction of bird excrement with olivine nephelinites (ankaratritic lavas), and of Oliveira et al.
(2009) that report high contents of Cu, Pb, Zn, As, U, and Sr in besides soils of this island due to the interaction of guano with mafic rocks, and anomalous concentrations of Ba, Nb, Ta, Cr, Hf, V and Zr due to the geochemical inheritance of local basalts. In the Fernando de Noronha Island, Oliveira
et al. (2011b) showed that soils developed from mafic rocks
(nepheline basalts) presented higher contents of Fe, Co, Ni and Cr, and Oliveira et al. (2011a) showed that soils from these
rocks concentrate rare earth elements (REEs), preferably the heavy REEs (HREEs).
In reddened topsoil developed on mafic lapilli from Fogo island (Cape Verde), the upper level shows a significant gain of Na, Cr, P, Si, and particularly As, and the hematite may explain the significant retention of Cr, P, As and light REEs (LREE) in the topsoil (Marques et al. 2014).
In soils of basaltic rocks of Cameroon, the organic matter may account for low mobility of Cu and Pb, and the Mn-Al system may control Zn retardation at low elevations (Manga
et al. 2016).
In basaltic pyroclasts from Azores, there are studies on the behavior of REEs (Freitas and Pacheco 2010, Vieira et al.
Geochemical evolution of soils developed from
pyroclastic rocks of Trindade Island, South Atlantic
Ana Carolina Campos Mateus1* , Angélica Fortes Drummond Chicarino Varajão1 ,
Fábio Soares de Oliveira2 , Sabine Petit3 , Carlos Ernesto Gonçalves Reynaud Schaefer4
Brazilian Journal of Geology
SO
DESDE 1946
B J G E O
© 2020 The authors. This is an open access article distributed under the terms of the Creative Commons license. 1Geology Department, Universidade Federal de Ouro Preto – Ouro Preto
(MG), Brazil. E-mails: anacamposeg@hotmail.com, angelica@degeo.ufop.br
2Geoscinces Institute, Geography Department, Universidade Federal de
Minas Gerais – Belo Horizonte (MG), Brazil. E-mail: fabiosolos@gmail.com
3Institut de Chimie des Mileux et Materiaux de Poitiers, Université de
Poitiers – Poitiers, France. E-mail: sabine.petit@univ-poitiers.fr
4Soil Science Department, Universidade Federal de Viçosa – Viçosa
(MG), Brazil. E-mail: carlos.schaefer@ufv.br *Corresponding author.
2004), showing a predominance in LREEs and positive Ce and Er negative anomalies. In soils developed on phonolitic pyroclasts in Cape Verde also occur positive Ce anomalies (Marques et al. 2018).
In Trindade Island, despite studies by Clemente et al.
(2012) have shown the availability of trace elements in soils from different eruptive materials, there are deficiencies in stud-ies showing the behavior of chemical elements in these soils, including REEs and the chemical mass balance. To fill this gap, the present study aims to bring more information about the geochemical evolution from the pyroclasts to the soil and to evaluate the distribution and quantification of losses and gains of major, minor, trace and REEs.
METHODOLOGY
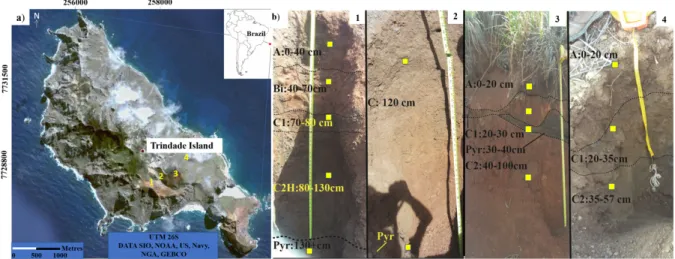
The sampling was carried out along four alteration pro-files covering the pedological horizons and semi-altered ultra-mafic pyroclastic rocks of the Vulcão do Paredão and Morro Vermelho Formation, located at different altitudes of Trindade Island (Fig. 1). The Trindade island has a tropical oceanic climate with average annual rainfall between 926 mm and a marked dry season between January and March. The annual mean temperature is 25°C, being March the warmest month of the year and June the coolest (Fund 2014).
The undeformed soil samples were collected by using a vol-umetric ring, maintaining the original structure of the material to determine the apparent density.
Chemical analyzes
For the chemical analyzes, the samples of weathered rocks and soils were air-dried and then manually sprayed in agate mortar and sieved to 150# (granulometry less than 0.105 mm), individualizing aliquots of about 50 g.
The chemical analyzes of the major (Al, Fe, K, Mg, Na, Ca, P), minor (Ti, Mn) and trace elements (Ba, Co, Cr, Cu, Li, Ni, Sr, Th, V, Zn, Be, Zr, S, Sc, Ga, Y, Cd, In, Cs, Tl, Pb, Bi, U) were obtained by inductively coupled plasma optical emis-sion spectrometry (ICP-OES) Agilent Technologies 725 while the REEs by inductively coupled plasma mass spectrometry
(ICP-MS) Agilent Technologies 7700 at the LGqa Laboratory of Geology Department at Universidade Federal de Ouro Preto (DEGEO/UFOP). For total digestion of 0.1g of each sample, 1 mL of hydrogen peroxide as added for the removal of organic matter. After total removal of organic matter, they were added 3 mL of HCl per 10 mol L-1 and 6 mL of HNO
3 per 10 mol L-1,
20 mL of HNO3 per 2 mol L-1 for digestion of carbonates and
oxidesand 4 mL of HF concentrate for digestionof silicates. The percentage of SiO2 was calculated in a relative way by the difference to 100% in the sum of the main elements and loss on ignition (LOI). The standard used as reference to rocks was the basalt certified (Cotta et al. 2008).
Apparent bulk density, absolute contents
and geochemical balance
For this analysis, the most complete profiles 1 and 3 were chosen, including, at the base, the presence of pyroclasts and, at the top, the A horizon.
The determination of bulk density was made for the weath-ered rocks by paraffin clod method and for the soils by volu-metric ring method (Teixeira et al. 2017).
The density values were incorporated in the calculation of losses and gains of the elements from the altered rock to the soil, so that the volume variation could be fixed. The abso-lute contents of each chemical component of profiles 1 and 3 were then calculated using the contents of the elements obtained by chemical analysis and the density measurement of the respective samples. For the quantitative evaluation of the losses and gains of chemical elements during the pedo-genetic processes, the chemical mass balance calculations were performed using the Millot and Bonifas (1955) pre-cepts. The Equation 1 was used:
{ [ (Ea * Da) – (Epy * Dpy) ] / (Epy * Dpy) } * 100 (1) In which:
Ea = the concentration of the element in horizon “a”; Da = the bulk density of horizon “a”;
Epy = the concentration of the element in pyroclasts ; Dpy = the bulk density of pyroclast.
Source: modified of Mateus et al. (2018).
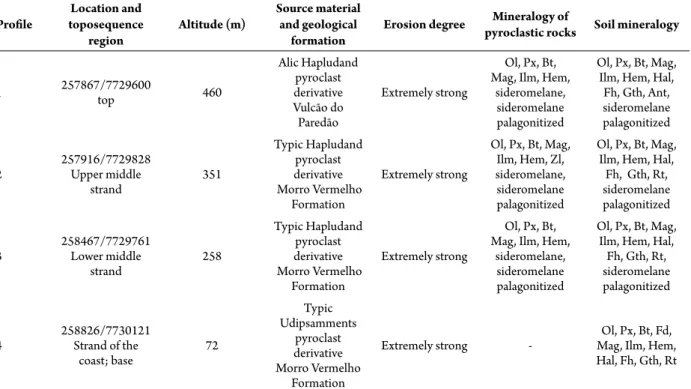
Physical characteristics and mineralogy
Table 1 summarizes the main physical and mineralogical characteristics of the four soil profiles according Mateus et al.
(2020a) and Mateus et al. (2018).
RESULTS
Geochemistry
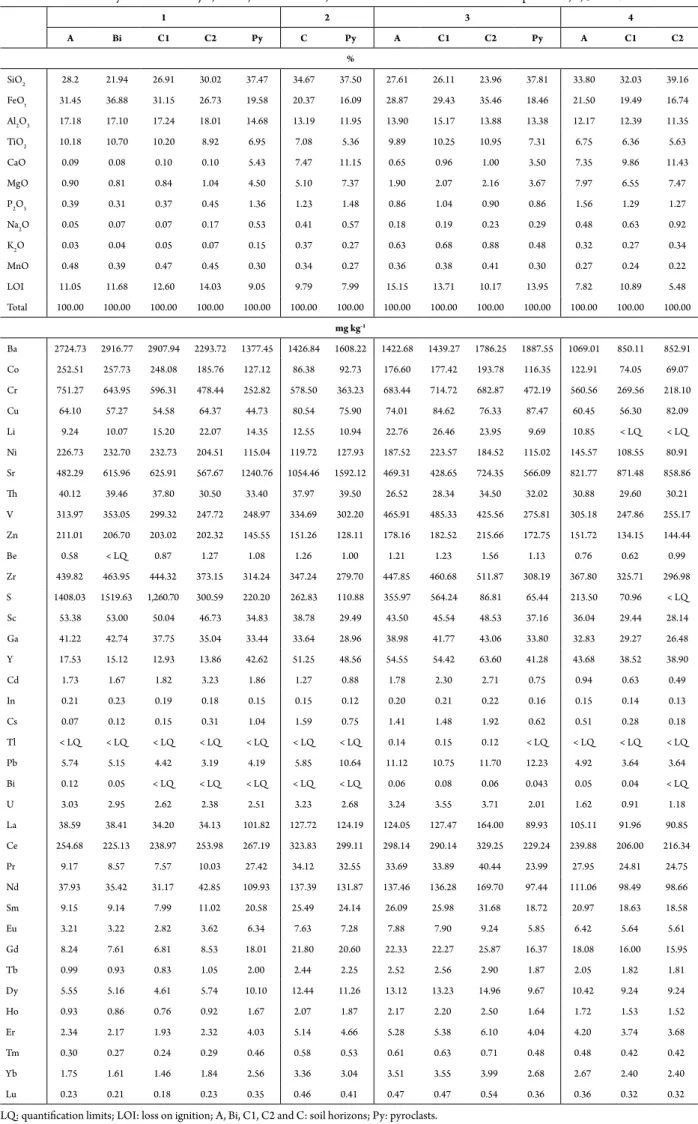
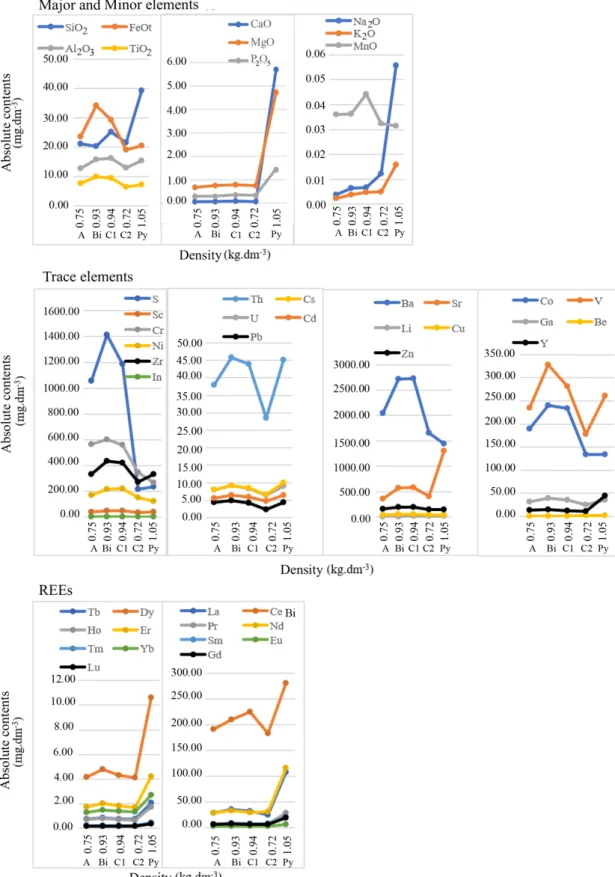
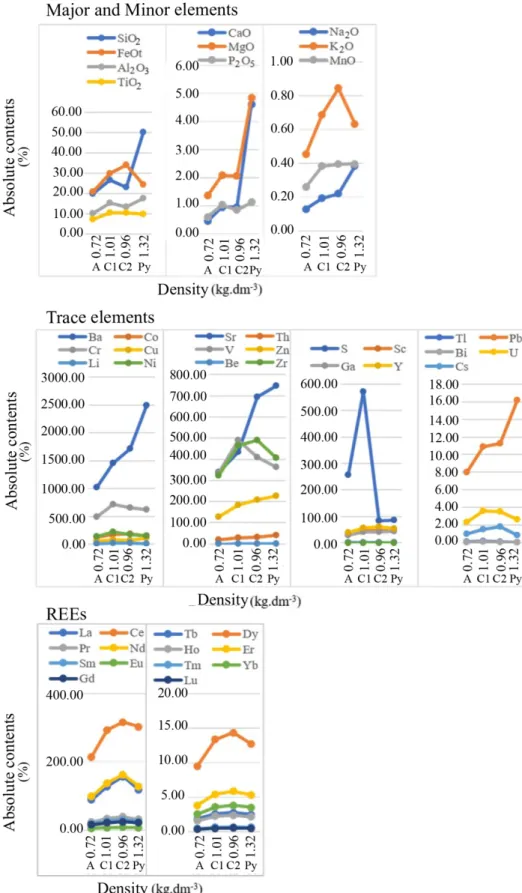
Pyroclasts show the predominance of SiO2, FeOt, Al2O3,
TiO2, CaO, MgO and P2O5 among the major and minor ele-ments (Tab. 2), due to the presence of forsterite, clinopyroxenes (augite and diopiside), Ti-biotite, Ti-magnetite, ilmenite and sideromelane (Tab. 1). In particular, CaO value in the profile 2 is high due to the presence of calcium zeolites (Ca-chabazite and Ca-heulandite) added to the presence of clinopyroxenes. K2O, Na2O and MnO occur in small quantities and are mainly related to volcanic glass (sideromelane), which constitutes approximately 50% of the rock. The quantification of vol-canic glass was obtained by description of rocks previously impregnated in a Zeiss microscope fitted with a digital camera (Mateus et al. 2020a, 2020b). The pyroclasts from profile 3
con-tain K2O values greater than Na2O due to the higher amounts of Ti-biotite. The high LOI values are due to the presence of sideromelane and palagonite that contain water in their com-position. Among the trace and REEs, Ba, Cr, Sr, V, Zr and Ce are those that show similar contents in all pyroclasts.
In all soil horizons occur the predominance of SiO2, Al2O3,
FeOt, TiO2 (Tab. 2). The high amounts of FeOt is mainly attributed the presence of semi-altered primary mineral such as Ti-magnetites and secondary minerals such as hematite, goethite and ferrihydrites (Tab. 1). TiO2 is the fourth most
abundant element in the profiles 1, 2 and 3, and its presence is related to the presence of rutile, anatase, biotite, magnetite and ilmenite.
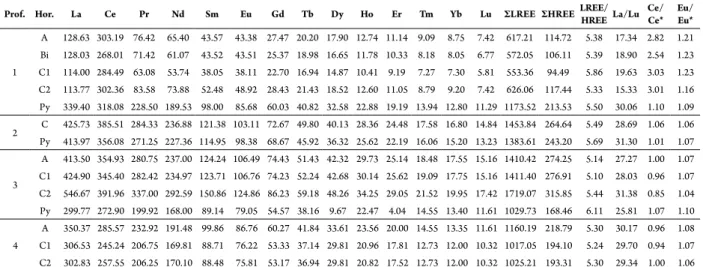
The normalization of the REEs’ concentrations to chon-drite data show higher concentrations of LREEs in all profiles. The profile 1 have positive anomalies of Ce higher than other profiles (2, 3 and 4) (Tab. 3, Fig. 2).
Absolute contents and geochemical
balance from profiles 1 and 3
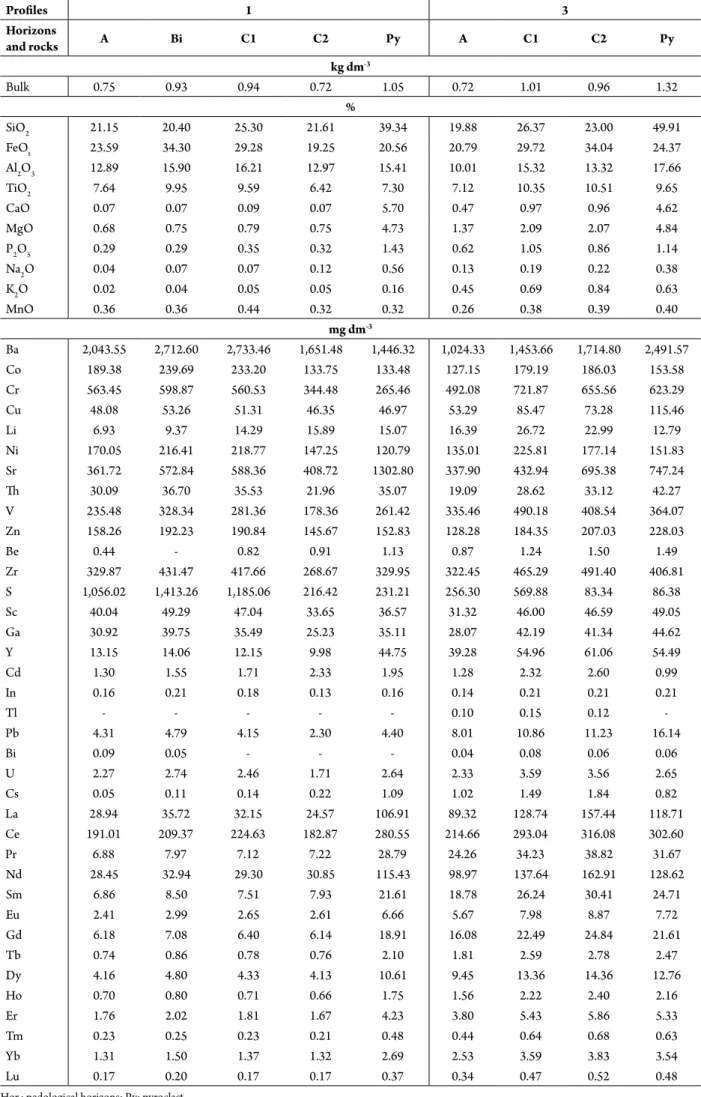
Distribution diagrams (Figs. 3 and 4) were obtained by the relation of the absolute contents (Tab. 4) with the density values. This relationship with the geochemical balance results (Tab. 5) allows us to make the following inferences.
Profile 1
Among the major and minor elements, Si, Al, Fe and Ti show similar behavior. There is a pronounced decrease in absolute contents towards C2 horizon followed by a relative increase to the top of profile. Gains are higher in the Bi horizon with 66.83% Fe and 36.36% Ti, and in the C1 horizon with 40.25% Mn. Na, K, Ca, Mg and P also show similar comport-ment with a pronounced decrease to the top of the profile, but no peaks of increase. For Mg there is an increase peak in the C1 horizon with stabilization in the A and Bi horizons. Losses are higher in Ca and Na with values around 90% com-pared to the altered pyroclast.
Among the trace elements, the absolute contents of Ba, Co, Cr and Ni increase significantly towards the top, with moder-ate gain in the A horizon, reaching 87.55, 19.57, 125.57 and 79.16%, respectively, in the Bi horizon. For Cu, Th, V, Zn, Zr, S, Pb, Ca, Ga and U, there is a decrease from the rock to C2
Table 1. Physical and mineralogical characteristics of the profiles (Mateus et al. 2020a, 2020b) and Mateus et al. (2018). Profile toposequence Location and
region Altitude (m)
Source material and geological
formation Erosion degree
Mineralogy of
pyroclastic rocks Soil mineralogy
1 257867/7729600 top 460 Alic Hapludand pyroclast derivative Vulcão do Paredão Extremely strong Ol, Px, Bt, Mag, Ilm, Hem,
sideromelane, sideromelane palagonitized
Ol, Px, Bt, Mag, Ilm, Hem, Hal,
Fh, Gth, Ant, sideromelane palagonitized 2 257916/7729828Upper middle strand 351 Typic Hapludand pyroclast derivative Morro Vermelho Formation Extremely strong Ol, Px, Bt, Mag, Ilm, Hem, Zl, sideromelane, sideromelane palagonitized Ol, Px, Bt, Mag, Ilm, Hem, Hal,
Fh, Gth, Rt, sideromelane palagonitized 3 258467/7729761Lower middle strand 258 Typic Hapludand pyroclast derivative Morro Vermelho Formation Extremely strong Ol, Px, Bt, Mag, Ilm, Hem,
sideromelane, sideromelane palagonitized
Ol, Px, Bt, Mag, Ilm, Hem, Hal,
Fh, Gth, Rt, sideromelane palagonitized 4 258826/7730121Strand of the coast; base 72 Typic Udipsamments pyroclast derivative Morro Vermelho Formation
Extremely strong - Mag, Ilm, Hem, Ol, Px, Bt, Fd, Hal, Fh, Gth, Rt
Bt: Ti-biotite; Ol: olivine (forsterite); Ilm: ilmenite; Px: pyroxenes (augite, diopside); Mag: magnetite; Fp: feldspars (anorthoclase, oligoclase); Zl: zeolite (chabazite, heulandite); Hem: hematite; Gth: goethite; Ant: anatase; Rt: rutile; Hall: halloysite; Fh: Ferryhidrite.
1 2 3 4 A Bi C1 C2 Py C Py A C1 C2 Py A C1 C2 % SiO2 28.2 21.94 26.91 30.02 37.47 34.67 37.50 27.61 26.11 23.96 37.81 33.80 32.03 39.16 FeOt 31.45 36.88 31.15 26.73 19.58 20.37 16.09 28.87 29.43 35.46 18.46 21.50 19.49 16.74 Al2O3 17.18 17.10 17.24 18.01 14.68 13.19 11.95 13.90 15.17 13.88 13.38 12.17 12.39 11.35 TiO2 10.18 10.70 10.20 8.92 6.95 7.08 5.36 9.89 10.25 10.95 7.31 6.75 6.36 5.63 CaO 0.09 0.08 0.10 0.10 5.43 7.47 11.15 0.65 0.96 1.00 3.50 7.35 9.86 11.43 MgO 0.90 0.81 0.84 1.04 4.50 5.10 7.37 1.90 2.07 2.16 3.67 7.97 6.55 7.47 P2O5 0.39 0.31 0.37 0.45 1.36 1.23 1.48 0.86 1.04 0.90 0.86 1.56 1.29 1.27 Na2O 0.05 0.07 0.07 0.17 0.53 0.41 0.57 0.18 0.19 0.23 0.29 0.48 0.63 0.92 K2O 0.03 0.04 0.05 0.07 0.15 0.37 0.27 0.63 0.68 0.88 0.48 0.32 0.27 0.34 MnO 0.48 0.39 0.47 0.45 0.30 0.34 0.27 0.36 0.38 0.41 0.30 0.27 0.24 0.22 LOI 11.05 11.68 12.60 14.03 9.05 9.79 7.99 15.15 13.71 10.17 13.95 7.82 10.89 5.48 Total 100.00 100.00 100.00 100.00 100.00 100.00 100.00 100.00 100.00 100.00 100.00 100.00 100.00 100.00 mg kg-1 Ba 2724.73 2916.77 2907.94 2293.72 1377.45 1426.84 1608.22 1422.68 1439.27 1786.25 1887.55 1069.01 850.11 852.91 Co 252.51 257.73 248.08 185.76 127.12 86.38 92.73 176.60 177.42 193.78 116.35 122.91 74.05 69.07 Cr 751.27 643.95 596.31 478.44 252.82 578.50 363.23 683.44 714.72 682.87 472.19 560.56 269.56 218.10 Cu 64.10 57.27 54.58 64.37 44.73 80.54 75.90 74.01 84.62 76.33 87.47 60.45 56.30 82.09 Li 9.24 10.07 15.20 22.07 14.35 12.55 10.94 22.76 26.46 23.95 9.69 10.85 < LQ < LQ Ni 226.73 232.70 232.73 204.51 115.04 119.72 127.93 187.52 223.57 184.52 115.02 145.57 108.55 80.91 Sr 482.29 615.96 625.91 567.67 1240.76 1054.46 1592.12 469.31 428.65 724.35 566.09 821.77 871.48 858.86 Th 40.12 39.46 37.80 30.50 33.40 37.97 39.50 26.52 28.34 34.50 32.02 30.88 29.60 30.21 V 313.97 353.05 299.32 247.72 248.97 334.69 302.20 465.91 485.33 425.56 275.81 305.18 247.86 255.17 Zn 211.01 206.70 203.02 202.32 145.55 151.26 128.11 178.16 182.52 215.66 172.75 151.72 134.15 144.44 Be 0.58 < LQ 0.87 1.27 1.08 1.26 1.00 1.21 1.23 1.56 1.13 0.76 0.62 0.99 Zr 439.82 463.95 444.32 373.15 314.24 347.24 279.70 447.85 460.68 511.87 308.19 367.80 325.71 296.98 S 1408.03 1519.63 1,260.70 300.59 220.20 262.83 110.88 355.97 564.24 86.81 65.44 213.50 70.96 < LQ Sc 53.38 53.00 50.04 46.73 34.83 38.78 29.49 43.50 45.54 48.53 37.16 36.04 29.44 28.14 Ga 41.22 42.74 37.75 35.04 33.44 33.64 28.96 38.98 41.77 43.06 33.80 32.83 29.27 26.48 Y 17.53 15.12 12.93 13.86 42.62 51.25 48.56 54.55 54.42 63.60 41.28 43.68 38.52 38.90 Cd 1.73 1.67 1.82 3.23 1.86 1.27 0.88 1.78 2.30 2.71 0.75 0.94 0.63 0.49 In 0.21 0.23 0.19 0.18 0.15 0.15 0.12 0.20 0.21 0.22 0.16 0.15 0.14 0.13 Cs 0.07 0.12 0.15 0.31 1.04 1.59 0.75 1.41 1.48 1.92 0.62 0.51 0.28 0.18 Tl < LQ < LQ < LQ < LQ < LQ < LQ < LQ 0.14 0.15 0.12 < LQ < LQ < LQ < LQ Pb 5.74 5.15 4.42 3.19 4.19 5.85 10.64 11.12 10.75 11.70 12.23 4.92 3.64 3.64 Bi 0.12 0.05 < LQ < LQ < LQ < LQ < LQ 0.06 0.08 0.06 0.043 0.05 0.04 < LQ U 3.03 2.95 2.62 2.38 2.51 3.23 2.68 3.24 3.55 3.71 2.01 1.62 0.91 1.18 La 38.59 38.41 34.20 34.13 101.82 127.72 124.19 124.05 127.47 164.00 89.93 105.11 91.96 90.85 Ce 254.68 225.13 238.97 253.98 267.19 323.83 299.11 298.14 290.14 329.25 229.24 239.88 206.00 216.34 Pr 9.17 8.57 7.57 10.03 27.42 34.12 32.55 33.69 33.89 40.44 23.99 27.95 24.81 24.75 Nd 37.93 35.42 31.17 42.85 109.93 137.39 131.87 137.46 136.28 169.70 97.44 111.06 98.49 98.66 Sm 9.15 9.14 7.99 11.02 20.58 25.49 24.14 26.09 25.98 31.68 18.72 20.97 18.63 18.58 Eu 3.21 3.22 2.82 3.62 6.34 7.63 7.28 7.88 7.90 9.24 5.85 6.42 5.64 5.61 Gd 8.24 7.61 6.81 8.53 18.01 21.80 20.60 22.33 22.27 25.87 16.37 18.08 16.00 15.95 Tb 0.99 0.93 0.83 1.05 2.00 2.44 2.25 2.52 2.56 2.90 1.87 2.05 1.82 1.81 Dy 5.55 5.16 4.61 5.74 10.10 12.44 11.26 13.12 13.23 14.96 9.67 10.42 9.24 9.24 Ho 0.93 0.86 0.76 0.92 1.67 2.07 1.87 2.17 2.20 2.50 1.64 1.72 1.53 1.52 Er 2.34 2.17 1.93 2.32 4.03 5.14 4.66 5.28 5.38 6.10 4.04 4.20 3.74 3.68 Tm 0.30 0.27 0.24 0.29 0.46 0.58 0.53 0.61 0.63 0.71 0.48 0.48 0.42 0.42 Yb 1.75 1.61 1.46 1.84 2.56 3.36 3.04 3.51 3.55 3.99 2.68 2.67 2.40 2.40 Lu 0.23 0.21 0.18 0.23 0.35 0.46 0.41 0.47 0.47 0.54 0.36 0.36 0.32 0.32
Table 2. Bulk chemistry contents of major, minor, trace elements, and rare earths elements from the soil profiles 1, 2, 3 and 4.
horizon and a more pronounced increase in the Bi horizon followed by a decrease in the A horizon. Among these ele-ments, S is the one with significant gain of 511.24% in the Bi horizon while Th, V and Ga have relative loss of 14.20, 9.92 and 11.95%, respectively. Sr and Be behavior is the reverse of Ba, Co, Cr e Ni, that is, occur a decrease towards the top of the profile with higher loss of Sr and Be in the A horizon. The Y presents similar loss in all horizons with values around 70%.
For the REEs occur a decrease of all elements toward the top of the profile, except Sc that presents increase. Among them, the Dy, Er, Yb, La and Nd show a peak increase in the Bi hori-zon and, in particular, of Ce in the C1 horiBi hori-zon. The geochem-ical balance shows less loss in the Bi horizon except the Ce which has the lowest value in the C1 horizon. The greatest losses are of LREEs with values around 60–80%, except the Ce with value between 19–35%. The HREEs show moderate losses of around 40–60%.
Profile 3
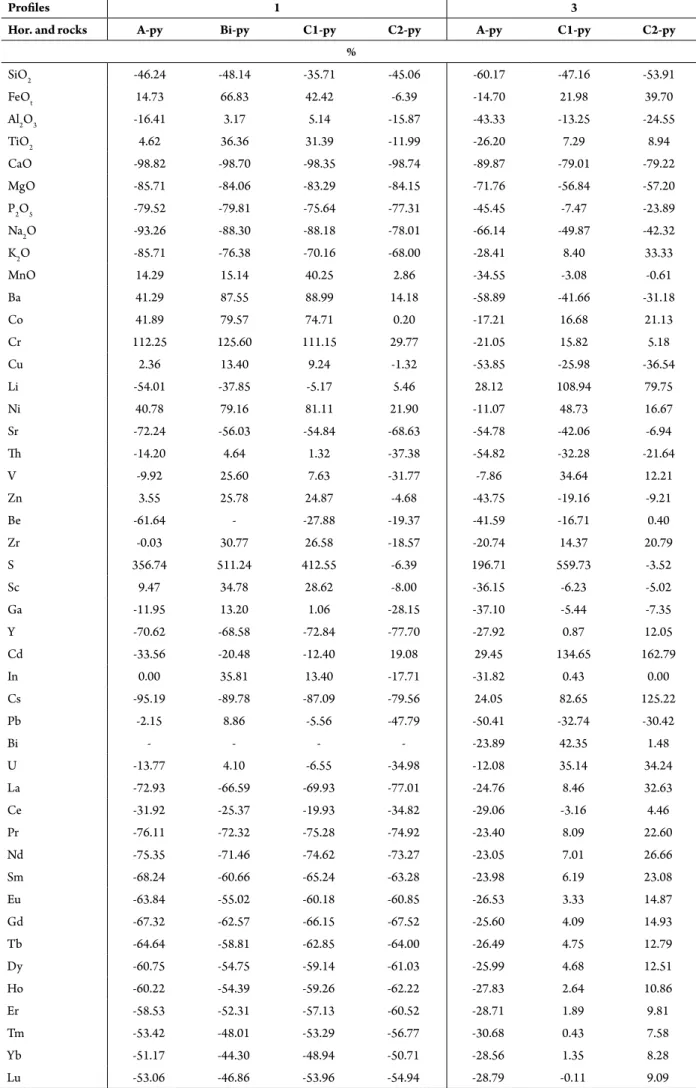
Among the major and minor elements, the absolute con-tents of Fe, Ti and K increase in the C2 and C1 horizon and decrease in the A horizon. The geochemical balance shows higher gain of 39.70 and 33.33% for Fe and K, respectively, in the C2 horizon. The elements Si, Al, Ca, Mg, P, Na and Mn decrease towards the top of the profile with more pronounced loss for Ca around 79–90%.
The absolute contents of Ba, Cu, Sr, Th, Zn, Sc, Ga decrease towards the top of the profile and those of S, Cd and U increase. Co, Cr, Li, Ni, V, Be, Zr, Y and Cs increase in C2 and C1 hori-zon and decrease in the A horihori-zon. The chemical elements In and Bi present constant behavior with a small decrease in the A horizon. The geochemical balance shows loss of Ba, Sr, Th, Zn, Sc, Cu, Ga, Be and Y in relation to pyroclast with greater loss in the A horizon around 30–60%, as opposed to Li, Cd and Cs that show gain in all horizons. Co, Cr, Ni, V and Zr have
Table 3. Concentration results, in mg.kg-1, and their normalization to chondrite (McDonough and Sun 1995), for rare earth elements in
profiles 1,2, 3 and 4.
Prof. Hor. La Ce Pr Nd Sm Eu Gd Tb Dy Ho Er Tm Yb Lu ΣLREE ΣHREE LREE/HREE La/Lu Ce/Ce* Eu/Eu*
1 A 128.63 303.19 76.42 65.40 43.57 43.38 27.47 20.20 17.90 12.74 11.14 9.09 8.75 7.42 617.21 114.72 5.38 17.34 2.82 1.21 Bi 128.03 268.01 71.42 61.07 43.52 43.51 25.37 18.98 16.65 11.78 10.33 8.18 8.05 6.77 572.05 106.11 5.39 18.90 2.54 1.23 C1 114.00 284.49 63.08 53.74 38.05 38.11 22.70 16.94 14.87 10.41 9.19 7.27 7.30 5.81 553.36 94.49 5.86 19.63 3.03 1.23 C2 113.77 302.36 83.58 73.88 52.48 48.92 28.43 21.43 18.52 12.60 11.05 8.79 9.20 7.42 626.06 117.44 5.33 15.33 3.01 1.16 Py 339.40 318.08 228.50 189.53 98.00 85.68 60.03 40.82 32.58 22.88 19.19 13.94 12.80 11.29 1173.52 213.53 5.50 30.06 1.10 1.09 2 C 425.73 385.51 284.33 236.88 121.38 103.11 72.67 49.80 40.13 28.36 24.48 17.58 16.80 14.84 1453.84 264.64 5.49 28.69 1.06 1.06 Py 413.97 356.08 271.25 227.36 114.95 98.38 68.67 45.92 36.32 25.62 22.19 16.06 15.20 13.23 1383.61 243.20 5.69 31.30 1.01 1.07 3 A 413.50 354.93 280.75 237.00 124.24 106.49 74.43 51.43 42.32 29.73 25.14 18.48 17.55 15.16 1410.42 274.25 5.14 27.27 1.00 1.07 C1 424.90 345.40 282.42 234.97 123.71 106.76 74.23 52.24 42.68 30.14 25.62 19.09 17.75 15.16 1411.40 276.91 5.10 28.03 0.96 1.07 C2 546.67 391.96 337.00 292.59 150.86 124.86 86.23 59.18 48.26 34.25 29.05 21.52 19.95 17.42 1719.07 315.85 5.44 31.38 0.85 1.04 Py 299.77 272.90 199.92 168.00 89.14 79.05 54.57 38.16 9.67 22.47 4.04 14.55 13.40 11.61 1029.73 168.46 6.11 25.81 1.07 1.10 4 A 350.37 285.57 232.92 191.48 99.86 86.76 60.27 41.84 33.61 23.56 20.00 14.55 13.35 11.61 1160.19 218.79 5.30 30.17 0.96 1.08 C1 306.53 245.24 206.75 169.81 88.71 76.22 53.33 37.14 29.81 20.96 17.81 12.73 12.00 10.32 1017.05 194.10 5.24 29.70 0.94 1.07 C2 302.83 257.55 206.25 170.10 88.48 75.81 53.17 36.94 29.81 20.82 17.52 12.73 12.00 10.32 1025.21 193.31 5.30 29.34 1.00 1.06
Prof.: profile; Hor.: pedological horizons; Py: pyroclast; (La/Lu)ch: (La/Lach)/(Lu/Luch); Ce/Ce*: (3Ce/Cech)/(2La/Lach + Nd/Ndch); Eu/Eu*: (3Eu/ Euch)/(2Sm/Smch + Tb/Tbch); ch: concentration in chondrite; HREE: high rare earth elements; LREE: low rare earth elements.
REEs: rare earth elements.
Figure 3. Comparison between densities and absolute contents from profile 1.
gains in C2 and C1 horizon and loss in the A horizon. S is the element with the highest gain (559.73%) between the trace ele-ments. Be and Y behave differently from other trace eleele-ments. For the REEs occur an increase in absolute values from rock to C2 horizon followed by a decrease towards the top of the profile. The geochemical balance shows gain of all ele-ments in the C2 and C1 horizons, except for Ce and Lu that present small loss of 3.11 and 0.11%, respectively, and loss
in the A horizon in relation to the pyroclast. In addition, the LREEs show higher gains than the HREEs, between 14–33% and 9–12%, respectively.
DISCUSSION
According to weather studies of geochemical evolution of soil profiles, in all studied profiles the amount of silica
REEs: rare earth elements.
Figure 4. Comparison between densities and absolute levels from profile 3.
decreases considerably with the advance of weathering, while aluminum, iron and titanium tend to accumulate due to their low mobility. Calcium, sodium, potassium and magnesium are the most intensely leached. In the profile 4, potassium and magnesium values are slightly high in the A horizon due to the position of this profile at a lower altitude. The influence of saline sprays and the deposition of chemical elements from
the higher regions increase the amounts of chemical elements in the profiles located at lower altitude, corroborating with Clemente et al. (2012).
Profiles located at higher altitudes, such as profile 1 (460 m), are most depleted in the most mobile elements such as Na, Ca, Mg and K. Clemente et al. (2012) assigned the low
Table 4. Absolute values of the major, minor and trace elements and rare earth elements from profiles 1 and 3. Profiles 1 3 Horizons and rocks A Bi C1 C2 Py A C1 C2 Py kg dm-3 Bulk 0.75 0.93 0.94 0.72 1.05 0.72 1.01 0.96 1.32 % SiO2 21.15 20.40 25.30 21.61 39.34 19.88 26.37 23.00 49.91 FeOt 23.59 34.30 29.28 19.25 20.56 20.79 29.72 34.04 24.37 Al2O3 12.89 15.90 16.21 12.97 15.41 10.01 15.32 13.32 17.66 TiO2 7.64 9.95 9.59 6.42 7.30 7.12 10.35 10.51 9.65 CaO 0.07 0.07 0.09 0.07 5.70 0.47 0.97 0.96 4.62 MgO 0.68 0.75 0.79 0.75 4.73 1.37 2.09 2.07 4.84 P2O5 0.29 0.29 0.35 0.32 1.43 0.62 1.05 0.86 1.14 Na2O 0.04 0.07 0.07 0.12 0.56 0.13 0.19 0.22 0.38 K2O 0.02 0.04 0.05 0.05 0.16 0.45 0.69 0.84 0.63 MnO 0.36 0.36 0.44 0.32 0.32 0.26 0.38 0.39 0.40 mg dm-3 Ba 2,043.55 2,712.60 2,733.46 1,651.48 1,446.32 1,024.33 1,453.66 1,714.80 2,491.57 Co 189.38 239.69 233.20 133.75 133.48 127.15 179.19 186.03 153.58 Cr 563.45 598.87 560.53 344.48 265.46 492.08 721.87 655.56 623.29 Cu 48.08 53.26 51.31 46.35 46.97 53.29 85.47 73.28 115.46 Li 6.93 9.37 14.29 15.89 15.07 16.39 26.72 22.99 12.79 Ni 170.05 216.41 218.77 147.25 120.79 135.01 225.81 177.14 151.83 Sr 361.72 572.84 588.36 408.72 1302.80 337.90 432.94 695.38 747.24 Th 30.09 36.70 35.53 21.96 35.07 19.09 28.62 33.12 42.27 V 235.48 328.34 281.36 178.36 261.42 335.46 490.18 408.54 364.07 Zn 158.26 192.23 190.84 145.67 152.83 128.28 184.35 207.03 228.03 Be 0.44 - 0.82 0.91 1.13 0.87 1.24 1.50 1.49 Zr 329.87 431.47 417.66 268.67 329.95 322.45 465.29 491.40 406.81 S 1,056.02 1,413.26 1,185.06 216.42 231.21 256.30 569.88 83.34 86.38 Sc 40.04 49.29 47.04 33.65 36.57 31.32 46.00 46.59 49.05 Ga 30.92 39.75 35.49 25.23 35.11 28.07 42.19 41.34 44.62 Y 13.15 14.06 12.15 9.98 44.75 39.28 54.96 61.06 54.49 Cd 1.30 1.55 1.71 2.33 1.95 1.28 2.32 2.60 0.99 In 0.16 0.21 0.18 0.13 0.16 0.14 0.21 0.21 0.21 Tl - - - 0.10 0.15 0.12 -Pb 4.31 4.79 4.15 2.30 4.40 8.01 10.86 11.23 16.14 Bi 0.09 0.05 - - - 0.04 0.08 0.06 0.06 U 2.27 2.74 2.46 1.71 2.64 2.33 3.59 3.56 2.65 Cs 0.05 0.11 0.14 0.22 1.09 1.02 1.49 1.84 0.82 La 28.94 35.72 32.15 24.57 106.91 89.32 128.74 157.44 118.71 Ce 191.01 209.37 224.63 182.87 280.55 214.66 293.04 316.08 302.60 Pr 6.88 7.97 7.12 7.22 28.79 24.26 34.23 38.82 31.67 Nd 28.45 32.94 29.30 30.85 115.43 98.97 137.64 162.91 128.62 Sm 6.86 8.50 7.51 7.93 21.61 18.78 26.24 30.41 24.71 Eu 2.41 2.99 2.65 2.61 6.66 5.67 7.98 8.87 7.72 Gd 6.18 7.08 6.40 6.14 18.91 16.08 22.49 24.84 21.61 Tb 0.74 0.86 0.78 0.76 2.10 1.81 2.59 2.78 2.47 Dy 4.16 4.80 4.33 4.13 10.61 9.45 13.36 14.36 12.76 Ho 0.70 0.80 0.71 0.66 1.75 1.56 2.22 2.40 2.16 Er 1.76 2.02 1.81 1.67 4.23 3.80 5.43 5.86 5.33 Tm 0.23 0.25 0.23 0.21 0.48 0.44 0.64 0.68 0.63 Yb 1.31 1.50 1.37 1.32 2.69 2.53 3.59 3.83 3.54 Lu 0.17 0.20 0.17 0.17 0.37 0.34 0.47 0.52 0.48
Table 5. Mass balance of profiles 1 and 3.
Profiles 1 3
Hor. and rocks A-py Bi-py C1-py C2-py A-py C1-py C2-py
% SiO2 -46.24 -48.14 -35.71 -45.06 -60.17 -47.16 -53.91 FeOt 14.73 66.83 42.42 -6.39 -14.70 21.98 39.70 Al2O3 -16.41 3.17 5.14 -15.87 -43.33 -13.25 -24.55 TiO2 4.62 36.36 31.39 -11.99 -26.20 7.29 8.94 CaO -98.82 -98.70 -98.35 -98.74 -89.87 -79.01 -79.22 MgO -85.71 -84.06 -83.29 -84.15 -71.76 -56.84 -57.20 P2O5 -79.52 -79.81 -75.64 -77.31 -45.45 -7.47 -23.89 Na2O -93.26 -88.30 -88.18 -78.01 -66.14 -49.87 -42.32 K2O -85.71 -76.38 -70.16 -68.00 -28.41 8.40 33.33 MnO 14.29 15.14 40.25 2.86 -34.55 -3.08 -0.61 Ba 41.29 87.55 88.99 14.18 -58.89 -41.66 -31.18 Co 41.89 79.57 74.71 0.20 -17.21 16.68 21.13 Cr 112.25 125.60 111.15 29.77 -21.05 15.82 5.18 Cu 2.36 13.40 9.24 -1.32 -53.85 -25.98 -36.54 Li -54.01 -37.85 -5.17 5.46 28.12 108.94 79.75 Ni 40.78 79.16 81.11 21.90 -11.07 48.73 16.67 Sr -72.24 -56.03 -54.84 -68.63 -54.78 -42.06 -6.94 Th -14.20 4.64 1.32 -37.38 -54.82 -32.28 -21.64 V -9.92 25.60 7.63 -31.77 -7.86 34.64 12.21 Zn 3.55 25.78 24.87 -4.68 -43.75 -19.16 -9.21 Be -61.64 - -27.88 -19.37 -41.59 -16.71 0.40 Zr -0.03 30.77 26.58 -18.57 -20.74 14.37 20.79 S 356.74 511.24 412.55 -6.39 196.71 559.73 -3.52 Sc 9.47 34.78 28.62 -8.00 -36.15 -6.23 -5.02 Ga -11.95 13.20 1.06 -28.15 -37.10 -5.44 -7.35 Y -70.62 -68.58 -72.84 -77.70 -27.92 0.87 12.05 Cd -33.56 -20.48 -12.40 19.08 29.45 134.65 162.79 In 0.00 35.81 13.40 -17.71 -31.82 0.43 0.00 Cs -95.19 -89.78 -87.09 -79.56 24.05 82.65 125.22 Pb -2.15 8.86 -5.56 -47.79 -50.41 -32.74 -30.42 Bi - - - - -23.89 42.35 1.48 U -13.77 4.10 -6.55 -34.98 -12.08 35.14 34.24 La -72.93 -66.59 -69.93 -77.01 -24.76 8.46 32.63 Ce -31.92 -25.37 -19.93 -34.82 -29.06 -3.16 4.46 Pr -76.11 -72.32 -75.28 -74.92 -23.40 8.09 22.60 Nd -75.35 -71.46 -74.62 -73.27 -23.05 7.01 26.66 Sm -68.24 -60.66 -65.24 -63.28 -23.98 6.19 23.08 Eu -63.84 -55.02 -60.18 -60.85 -26.53 3.33 14.87 Gd -67.32 -62.57 -66.15 -67.52 -25.60 4.09 14.93 Tb -64.64 -58.81 -62.85 -64.00 -26.49 4.75 12.79 Dy -60.75 -54.75 -59.14 -61.03 -25.99 4.68 12.51 Ho -60.22 -54.39 -59.26 -62.22 -27.83 2.64 10.86 Er -58.53 -52.31 -57.13 -60.52 -28.71 1.89 9.81 Tm -53.42 -48.01 -53.29 -56.77 -30.68 0.43 7.58 Yb -51.17 -44.30 -48.94 -50.71 -28.56 1.35 8.28 Lu -53.06 -46.86 -53.96 -54.94 -28.79 -0.11 9.09
region more elevated of Trindade Island and to small pos-sibility of saline inputs. According to Mateus et al. (2020a),
acid pH data around 5 were found for C1, Bi and A horizons from the profile 1, which may justify the low CaO values in this profile.
In all profiles, the trace elements Ba, Co, Cr, Ni, Sr, V, Zn, Zr, S and Ce are the most abundant and, in general, their quantities increase towards the top of the profile. Similar behavior was found in Fernando de Noronha Island for Co, Cr and Ni in soils developed from rocks of mafic composi-tion (Oliveira et al. 2011b). High values of Ba may be related
to Ti-biotite, since Marques et al. (1999) and Greenwood
(1998) reported its presence in heavily zoned Ti-biotite in ultramafic rocks (melanephelinites) from Trindade Island. The presence of ferromagnesian minerals such as olivine, pyroxene and amphibole explain the high content of Ni, Cr, Co, Zn and V. According to Hawes and Webb (1962), Ni, Cr, Co, Cu, Zn and V have similar chemical characteristics and occur in ferromagnesian minerals. Cr contents is high for all soils due to the deep mantelic origin of the pyroclasts and tend to concentrated in the olivine nuclei (Mateus et al.
2020b). This fact explains the high exchangeable levels of Cr in soils from the Morro Vermelho Formation (Clemente et al.
2012). The Cu content from profiles 3 and 4 present similar behavior to the soils of Clemente et al. (2012): higher
con-tent in near-sea soils, at lower altitude and in younger soils. Another similarity to the Clemente et al. (2012) study is
the most pronounced Zn content in horizons with greater amount of organic matter such as the A horizon of profile 3 and 4, with values of 18.03 e 9.39 g.kg-1 in total organic
car-bon respectively (Mateus et al. 2020a). According to Abreu et al. (2001), high levels of organic matter can complex Cu
and Zn retaining these elements in the soil. Therefore, the higher levels of Zn and Cu in the A horizon from profiles 3 and 4 would be a consequence of the greater amounts of complexes of humic acid linked to these elements. In addi-tion, all horizons from the profiles 3 and 4 still contain several relict fragments of the parental rock (Mateus et al. 2020a),
which could contribute to the more pronounced presence of Zn and Cu.
For profiles 1 and 3, the gain of Fe, Ti, Al and Mn are rela-tive, as these elements increase due to the detriment of others such as Si, Na, K, Ca, Mg and P. In relation to trace elements, profile 1 shows moderate mobility of Sr, V, Co, Y, Zr, Pb, Cd, U, Cs, Th, Ga characterized by the loss of these elements from the altered rock to the C2 horizon and a relative enrichment, espe-cially in Bi horizon. Ba, Cr and Ni show enrichment towards to the top of the profile. Li, Zn, Be, Sc do not vary much and show very close values in the rock and in the soil.
Profile 3 has the inverse behavior of profile 1, with high mobility for Ba, Sr, Zn, Pb represented by their marked loss to the top of the profile and a relative enrichment of Cr, Ni, Co, Zr, V, S, Y, Ga, U, Cs from rock to soil, with slight loss in the A horizon. According to Hawes and Webb (1962) Ba and Sr are elements of high mobility, corroborating the geochem-ical behavior found in the soils of this study. Li, Be and Bi are constant in the profile 1 e 3.
All profiles showed high concentration of LREE. Featured, the profiles 1 and 2 showed positive Ce anomalies, with higher values in 1. In soils on basaltics pyroclasts from São Miguel island (Azores archipelago) occur similar behavior (Freitas and Pacheco 2010) as in topsoils on phonolitic pyroclasts in Brava Island (Cape Verde archipelago); Marques et al. (2018)
related the relative Ce enrichment to stronger oxidizing con-ditions leading to Ce3+ → Ce4+ with preferred retention of this
element on the clay-size fraction. This same explanation could be applied to soil from profile 1 since it is the profile that is most weathered (Mateus et al. 2018).
The REEs in profile 1 are lost by leaching. The position of this profile in higher regions contributes to the loss of these ele-ments. The opposite occurs in the profile 3 positioned in lower regions, concentrating these elements at the base of the profile (C2 and C1 horizon), highlighting the LREEs that show larger gain than the HREEs. In the Fernando de Noronha Island, the HREEs accumulate in soils on mafic rocks (nepheline basalts) at low altitude (Oliveira et al. 2011a). One explanation for this
difference would be that the profile studied by Oliveira et al.
(2011a) is located on older rocks Morro Quixaba Formation (6.2 Ma, Perlingeiro et al. 2013) that of the Morro Vermelho
Formation (0.17 Ma, Cordani 1970), and consequently the soils formed on these rocks are more weathered and more leached, concentrating more HREE than LREE.
CONCLUSIONS
In all profiles, Al and Fe accumulate towards to the top due to their low mobility, and, Ca, Na, K and Mg are the most intensely leached. Similarly, Ti, Mn, Co, Cr, Ni, V, Zr, S show relative enrichment due to the leaching of the most mobile elements during the soil formation process.
Lower altitude profiles tend to have higher K and Mg val-ues in A horizon due to the influence of saline sprays.
Zn and Cu are concentrated in A horizon of low altitude profiles that have higher organic matter content and relict frag-ments of parental rock.
Leaching of the REEs from higher to the lower slope led to the enrichment of these elements, especially the light REEs, in the low lying (258 m) soil. The Ce positive anomalies in high altitude profile (460 m) is because it is more weathered.
ACKNOWLEGEMENTS
We would like to thank to the Brazilian Navy for their logistical support and to the CNPq (306424/2016-9; 442730/2015-2), CAPES (Finance code 001) and FAPEMIG (PPM-00326-18) for their financial contribution. We would also like to express our gratitude to the Laboratory of Environmental Geochemistry (LGqA) of DEGEO/UFOP for the geochemical analyses. Lastly, we would like to show our appreciation to the Laboratory of X-Ray Diffraction of DEGEO/UFOP and of IC2MP, Université de Poitiers for the mineralogical analyses. Authors also acknowledged financial support from the European Union (ERDF) and Region Nouvelle Aquitaine.
ARTICLE INFORMATION
Manuscript ID: 20200073. Received on: 12/30/2019. Approved on: 08/28/2020.
A.C.C.M. wrote the first draft of the manuscript and prepared Figures 1, 2, 3, 4 and Tables 1, 2, 3, 4 and 5. A.C.C.M. was responsible for the geochemical analysis acquisition. A.F.D.C.V., F.S.O., S.P. and C.E.G.R.S. provided advisorship regarding geochemistry, geology, pedology and improved the manuscript through corrections and suggestions. A.F.D.C.V. and C.E.G.R.S. revised the English. A.F.D.C.V., F.S.O., S.P. and C.E.G.R.S. were responsible for the acquisition of research funding.
Competing interests: The authors declare no competing interests.
Abreu C.A., Ferreira M.E, Borkert C.M. 2001 Disponibilidade e avaliação de elementos catiônicos: zinco e cobre. In: Ferreira M.E., Cruz M.C.P., Raij
B. van, Abreu C.A. (eds.). Micronutrientes e elementos tóxicos na agricultura.
Jaboticabal: CNPq/FAPESP/POTAFOS, p. 12-150.
Carvalho I.G. 1995. Fundamentos da geoquímica dos processos exógenos.
Salvador: Bureau Gráfica e Editora, 213 p.
Clemente E.P., Schaefer C.E.R., Oliveira F.S., Marciano L.C., Clemente A.D. 2012. Geoquímica dos solos da Ilha da Trindade, Atlântico Sul, Brasil.
Geociências, 31(1):57-67.
Cordani U.G. 1970. Idade do vulcanismo do Oceano Atlântico Sul. Boletim IAG USP, 1:9-75.
Cotta A.J.B., Enzweiler J., Nardy A.J.R. 2008. Certificado de Análise do Material de Referência BRP-1 (Basalto Ribeirão Preto). Geochimica Brasiliensis, 22(2):113-118. http://dx.doi.org/10.21715/gb.v22i2.282
Cramer J.J., Nesbitt H.W. 1983. Mass-balance relations and trace-element mobility during continental weathering of various igneous rocks. Sciences Géologiques, 73:63-73.
Freitas M.C., Pacheco A.M.G. 2010. Soils of Azores islands: elemental characterization with an emphasis on rare-earth elements. Journal of Radioanalytical and Nuclear Chemistry, 283:117-122. https://doi.
org/10.1007/s10967-009-0130-7
Fund W. 2014. Trinidade-Martin Vaz Islands tropical forests. Available from:
<http://editors.eol.org/eoearth/wiki/Trinidade-Martin_Vaz_Islands_ tropical_forests>. Accessed on: July 20, 2020.
Gardner L.R. 1980. Mobilization of Al and Ti during weathering- isovolumetric geochemical evidence. Chemical Geology, 30(1-2):151-165.
https://doi.org/10.1016/0009-2541(80)90122-9
Greenwood J.C. 1998. Barian–titanian micas from Ilha da Trindade, South Atlantic. Mineralogical Magazine, 62(5):687-695. https://doi.
org/10.1180/002646198547918
Hawes H.E., Webb J.S. 1962. Geochemistry in Mineral Exploration. New York:
Elsevier, 377 p.
Manga V.E., Agyingi C.M., Suh C.E. 2016. Trace element behaviour in soils developed along the slopes of Mt. Cameroon, West Africa. Geochemical Journal, 50(3):267-280. https://doi.org/10.2343/geochemj.2.0413
Marques R., Prudêncio M.I., Waerenborgh J.C., Rocha F., Dias M.I., Ruiz F., Ferreira da Silva E., Abad M., Muñoz A.M. 2014. Origin of reddening in a paleosol buried by lava flows in Fogo island (Cape Verde). Journal of African Earth Sciences, 96:60-70. https://doi.org/10.1016/j.jafrearsci.2014.03.019
Marques L.S., Ulbrich M.N.C., Ruberti E., Tassinari C.G. 1999. Petrology, geochemistry and Sr-Nd isotopes of Trindade and Martin Vaz volcanic rocks (Southern Atlantic Ocean). Journal of Volcanology and Geothermal Research,
93(3-4):191-216. https://doi.org/10.1016/S0377-0273(99)00111-0
Marques R., Vieira B.J., Prudêncio M.I., Waerenborgh J.C., Dias M.I., Rocha F. 2018. Chemistry of volcanic soils used for agriculture in Brava Island (Cape Verde) envisaging a sustainable management. Journal of African Earth Sciences, 147:28-42. https://doi.org/10.1016/j.jafrearsci.2018.06.014
REFERENCES
Mateus A.C.C., Varajão A.F.D.C., Oliveira F.S., Petit S., Schaefer C.E.R. 2020a. Non-allophanic andosols of trindade island, south atlantic, Brazil: A new soil orden in Brazil. Revista Brasileira de Ciências dos Solos, 44:e0200007.
http://dx.doi.org/10.36783/18069657rbcs20200007
Mateus A.C.C., Varajão A.F.D.C., Oliveira F.S., Schaefer C.E. 2018. Alteration of olivine in volcanic rocks from Trindade Island, South Atlantic. Applied Clay Science, 160:40-48. https://doi.org/10.1016/j.clay.2018.01.033
Mateus A.C.C., Varajão A.F.D.C., Petit S., Oliveira F.S., Schaefer C.E.G.R. 2020b. Mineralogical and geochemical signatures of Quaternary pyroclasts alterations at the volcanic Trindade Island, South Atlantic. Journal of South American Earth
Sciences, 102:102674. https://doi.org/10.1016/j.jsames.2020.102674
McDonough W.F., Sun S.S. 1995. The composition of the earth. Chemical Geology,
120(3-4):223-253. https://doi.org/10.1016/0009-2541(94)00140-4
Millot G., Bonifas M. 1955. Transformations isovolumetriques dans les phenomenes de laterisation et de bauxitisation. Bulletin Service Carte Géolique d’Alsace et Lorraine, 8:3-20.
Oliveira F.S., Shaefer C.E.G.R., Abrahão W.A.P., Clemente E.P., Simas F.N.B. 2014. Soil–geomorphology interactions and paleoclimatic implications of an ornithogenic soil toposequence on Rata Island, Fernando de Noronha Archipelago, South Atlantic. Journal of South American Earth Sciences,
52:119-128. https://doi.org/10.1016/j.jsames.2014.02.007
Oliveira S.M.B., Pessenda L.C.R., Babinski M., Gioia S.M.C.L., Fávaro D.I.T. 2011a. Solos Desenvolvidos Sobre Diferentes Rochas Vulcânicas da Ilha de Fernando de Noronha: Padrão de Elementos Terras Raras e Composição Isotópica do Chumbo. Revista do Instituto de Geociências, 11(3):97-105.
https://doi.org/10.5327/Z1519-874X2011000300006
Oliveira S.M.B., Pessenda L.C.R., Gouveia S.E.M., Fávaro D.I.T. 2011b. Heavy metal concentrations in soils from a remote oceanic island, Fernando de Noronha, Brazil. Anais da Academia Brasileira de Ciências,
83(4):1193-1206. http://dx.doi.org/10.1590/S0001-37652011005000042
Oliveira S.M.B., Pessenda L.C.R., Gouveia S.E.M., Fávaro D.I.T., Babinski M. 2009. Evidência Geoquímica de Solos Formados pela Interação de Guanos com Rochas Vulcânicas, Ilha Rata, Fernando de Noronha (PE). Revista do Instituto de Geociências, 9(3):3-12. http://dx.doi.org/10.5327/z1519-874x2009000300001
Perlingeiro G., Vasconcelos P.M., Knesel K.M., Thiede D.S., Cordani U.G. 2013. 40Ar/39Ar geochronology of the Fernando de Noronha Archipelago and implications for the origin of alkaline volcanism in the NE Brazil.
Journal of Volcanology and Geothermal Research, 249:140-154.
Putnis A. 2009. Mineral Replacement Reactions. Reviews in Mineralogy and Geochemistry, 70(1):87-124. https://doi.org/10.2138/rmg.2009.70.3
Roca N., Pazos M.S., Bech, J. 2008. The relationship between WRB soil units and heavy metals content in soils of Catamarca (Argentina). Journal of Geochemical Exploration, 96(2-3):77-85. https://doi.org/10.1016/j.gexplo.2007.04.004
Teixeira P.C., Donagemma G.K., Fontana A., Teixeira W.G. 2017. Manual de métodos de análise de solo. Brasília: Embrapa, 573 p.
Vieira B.J., Soares P.M., Prudêncio M.I., Freitas M.C., Rodrigues A.F. 2004. Caracterização química (terras raras e outros elementos) de solos das ilhas de Santa Maria e Terceira (Açores, Portugal). Geociências, 16(1-2):5-12.