HAL Id: hal-00317806
https://hal.archives-ouvertes.fr/hal-00317806
Submitted on 27 Jul 2005
HAL is a multi-disciplinary open access
archive for the deposit and dissemination of
sci-entific research documents, whether they are
pub-lished or not. The documents may come from
teaching and research institutions in France or
abroad, or from public or private research centers.
L’archive ouverte pluridisciplinaire HAL, est
destinée au dépôt et à la diffusion de documents
scientifiques de niveau recherche, publiés ou non,
émanant des établissements d’enseignement et de
recherche français ou étrangers, des laboratoires
publics ou privés.
Correlation between cosmic noise absorption and VHF
coherent echo intensity
R. A. Makarevitch, F. Honary
To cite this version:
R. A. Makarevitch, F. Honary. Correlation between cosmic noise absorption and VHF coherent
echo intensity. Annales Geophysicae, European Geosciences Union, 2005, 23 (5), pp.1543-1553.
�hal-00317806�
SRef-ID: 1432-0576/ag/2005-23-1543 © European Geosciences Union 2005
Annales
Geophysicae
Correlation between cosmic noise absorption and VHF coherent
echo intensity
R. A. Makarevitch1,*and F. Honary1
1Department of Communication Systems, Lancaster University, Lancaster, LA1 4WA, UK
*now at: Department of Physics, La Trobe University, Victoria, 3086, Australia
Received: 27 September 2004 – Revised: 7 January 2005 – Accepted: 12 January 2005 – Published: 27 July 2005 Part of Special Issue “Atmospheric studies by optical methods”
Abstract. We present examples and statistical analysis of the events with statistically significant correlation between the cosmic noise absorption (CNA) and the signal-to-noise ratio (SNR) of the VHF coherent echo intensity in the area monitored simultaneously by an imaging riometer and two oblique-sounding coherent VHF radars in Northern Scandi-navia. By only considering the observations from the nar-row riometer beams comparable (in terms of the intersection with the ionosphere) with the VHF radar cells, we identify
∼200 one-hour high correlation periods (HCPs) for 2 years
near the solar cycle maximum, 2000–2001. The HCP oc-currence is maximized in the afternoon (12:00–17:00 UT,
MLT∼=UT+3), with the secondary peak near the midnight
(21:00–02:00 UT). Relative to the VHF echo occurrence, HCPs occur more frequently from 11:00 to 20:00 UT. The diurnal variation of HCP occurrence is similar to that of the 1-h intervals with the lowest mean absorption A<0.25 dB.
The HCPs are observed more frequently during the winter months, which, combined with the fact that VHF echoes ob-served during HCPs exhibit features typical for field-aligned E-region irregularities, makes their association with the po-lar mesospheric echoes (for which some positive CNA/SNR correlation has been reported in the past) very unlikely. In-stead, we attribute the high positive CNA/SNR correlation to the synchronous, to a first approximation, variation of the particle fluxes for two different but close sets of energies.
By considering the dependence of the CNA/SNR
correla-tion coefficients for both VHF radars (CA1 and CA2) upon
the correlation between SNRs for two radars (C12), we show
that both coefficients, CA1and CA2, and the agreement
be-tween them decrease drastically with a C12decrease, which
we interpreted through the progressively increasing role of the spatial inhomogeneity of the processes leading to the en-hanced CNA and SNR. In this situation, a similarity between the radio signal collection areas should become important, and we demonstrate that the HCP occurrence and mean
cor-Correspondence to: R. A. Makarevitch
relation coefficient decrease as the riometer beams and radar cells become less comparable in terms of mutual orientation and closeness between the points of maximum sensitivity. Keywords. Ionosphere (Auroral ionosphere; Particle pre-cipitation; Instruments and techniques)
1 Introduction
Since the introduction of relative ionospheric opacity meters (riometers) in the late 1950s, cosmic noise absorption (CNA) measurements have been routinely used for studies of the Earth’s ionosphere as a proxy for energetic particle precip-itation at D-region altitudes (60–90 km), as well as at higher E- and F-region altitudes (see, for example, review papers by Hargreaves, 1969; Stauning, 1996a,b).
Studies have identified several types of absorption events according to the time of observations, event duration, shape of absorption intensity variation with time, accompanying phenomena and associated mechanisms. Thus, both mid-night and morning auroral absorption have been attributed to the energetic (10–100 keV) electrons injected into the region of closed field lines that either immediately precipitate in the midnight sector or drift and precipitate further in the morn-ing sector (Ansari, 1964). The same mechanism has been applied later to the daytime absorption (e.g. Nishino et al., 1999; Kavanagh et al., 2002).
Pre- and post-midnight auroral absorption have been found to exhibit some association with various optical auroral forms (see Hargreaves, 1969, and references therein), with the correlation coefficient between optical intensity and CNA maximized in the midnight sector and decreasing with
time (Ansari, 1964). Absorption intensity has also been
shown to correlate well with the X-ray counting rate at
∼30 km (Brown and Barcus, 1963) and the magnetic
distur-bance level associated with the electrojet currents at 100– 110 km measured by magnetometers (Brown and Campbell, 1962; Hargreaves, 1966; Kavanagh et al., 2004). Positive
705 km 900 km 46 41 37 28 22 13 09 04 15.5 17.5 19.5 21.5 23.5 25.5 67.3 67.8 68.3 68.8 69.3 69.8 70.3 70.8
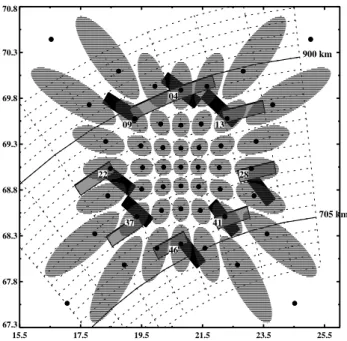
Fig. 1. The experimental setup in Northern Scandinavia showing the central positions of IRIS beams at 90 km by black circles, pro-jections of the 3-dB IRIS beams by contours filled with horizontal lines, STARE Finland radar cells near the IRIS FoV by dotted con-tours, and STARE Finland (grey) and Norway (black) radar cells closest to the selected IRIS beams with digits nearby indicating the IRIS beam number.
correlation has been reported between the CNA and Polar Mesospheric Summer Echo (PMSE) intensity (Czechowsky et al., 1989; Kirkwood et al., 1995; Klostermeyer, 1999; Barabash et al., 2002) as observed by VHF radars, al-though statistically the correlation appears to be rather weak (Czechowsky et al., 1989; Bremer et al., 2000; Barabash et al., 2002).
In this paper we attempt to advance our knowledge of the processes leading to the enhanced cosmic noise absorption by exploring the relationship between the riometer absorp-tion and backscatter power of auroral echoes detected by a VHF coherent radar. We consider the correlation between signal-to-noise ratio (SNR) of the VHF echoes and the CNA, and identify the periods of statistically significant high cor-relation or high corcor-relation periods (HCPs) with corcor-relation coefficients above 0.4 for 1-min resolution data. We also identify the extended periods (over 3 h) of very high corre-lation (>0.8) and analyze statistically the HCP occurrence for a 2-year observational period. By employing the data from several close but spatially separated locations (beams of an imaging riometer), we study the effects on the correla-tion arising from the differences in collecting areas between riometer and VHF radar.
2 Experiment setup
The Lancaster University Imaging Riometer for Ionospheric
Studies (IRIS) at Kilpisj¨arvi, Finland (69.1◦N, 20.8◦E,
∼66◦MLAT) has been providing the data on the CNA at
38.2 MHz for 49 directions since September 1994 (Browne
et al., 1995). The riometer is analogous technically and
operationally to other imaging riometers developed in the late 1980s by the University of Maryland group (see Det-rick and Rosenberg, 1990, for details on imaging riometer techniques). Figure 1 shows the central positions or foci of the 49 beams and 3-dB contours at 90 km (the corner beam contours are not shown) of the IRIS by black dots and areas filled with horizontal lines, respectively.
The IRIS facility is conveniently located within the view-ing areas of several other facilities in Northern Scandi-navia, including the Scandinavian Twin Auroral Radar Ex-periment (STARE) Norway and Finland VHF radars (∼140
and ∼144 MHz) located in Midtsandan, Norway (63.7◦N,
10.73◦E) and Hankasalmi, Finland (62.3◦N, 26.6◦E),
look-ing roughly towards magnetic east and north, respectively. The E-region echoes are monitored in 8 beams separated by
3.6◦in azimuth (3.2◦ half-power beam width) from 495 to
1245 km at 15-km resolution. The data are integrated over 20 s. We show in Fig. 1, by dotted lines, the STARE Finland radar cells closest to the IRIS field of view (FoV). In the stan-dard STARE mode (we only use such data), the single-pulse data are used to determine the power of the echoes and the double-pulse data are used to determine the Doppler velocity (Greenwald et al., 1978; Nielsen, 1982). The STARE echoes that had low power (<1 dB) were not considered.
In this study we only used the data from those IRIS beams whose half-power collection areas are comparable to the STARE radar cells (we thus did not consider either the cen-tral or the corner IRIS beams) and we show in Fig. 1 the radar cells closest to the selected IRIS beams for both Nor-way and Finland radars by black and grey areas, respectively, with digits showing the IRIS beam number.
3 Observations
One can easily notice from Fig. 1 that the degree of similar-ity between the IRIS and STARE collection areas depends not only on their size but also on the relative orientation and the distances between the points of maximum sensitiv-ity/foci. The latter are simply the centers of the radar cells for STARE, while for IRIS these are the central positions of the riometer beams shown by large black dots. For example, IRIS beam 41 is very similar to the closest STARE Norway radar cell both in terms of orientation and distance between the foci. Both the STARE Finland focus and the centre of the intersection area of the STARE Norway and Finland radar cells are also close to the IRIS focus point. One can con-clude that a comparison between the CNA intensity and the STARE backscatter powers would be more meaningful for IRIS beam 41 than, say, for beam 9, for which all three foci are somewhat apart from each other, so that the measure-ments refer to different (although close) locations.
In the following two sections (Sects. 3.1 and 3.2) we per-form a statistical analysis of the CNA/SNR correlation using
the data from the IRIS beam 41 and corresponding STARE cells for a 2-year period of high solar activity, from January 2000 to December 2001, during which the STARE radars regularly observed the ionospheric echoes. Our aim is to explore diurnal and seasonal (if any) variations of the peri-ods with statistically significant correlation. In this study we used the data that have been post-integrated with a period of 1 min. This has been done simply to reduce the database size and computation time. It was found that the use of 20-s res-olution data does not change the results of analysis in any significant way, with exception of slightly lower (by ∼10%) resulting correlation coefficients.
For each 1-h period in 2000–2001, the linear Pearson cor-relation coefficients were computed between the IRIS ab-sorption A in dB and backscatter powers (SNRs, also in dB)
recorded by the STARE Norway and Finland radars (Cnaand
Cf a, respectively), as well as the correlation between the
STARE Norway and Finland powers (Cnf). The correlation
coefficients were entered into the database only if all three parameters had finite values (data were available) for at least 60% of the time within a given 1-h period.
Figure 2 shows two examples of events with very high
correlation (Cna>0.8 for over three hours) for (a) 12 and
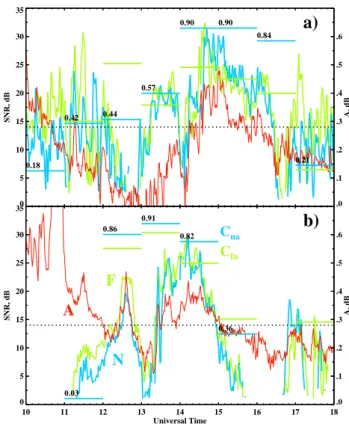
(b) 14 February 2000. The CNA intensity A is shown by the red line, while the STARE Norway (Finland) backscat-ter power variation is shown by the blue (green) line. The
correlation levels Cna and Cf a for each 1-h period of
con-tinuous (60% or more) observations are shown by the blue and green horizontal lines, respectively, with the correlation values shown by digits above the lines and by heights from the bottom of each panel (100%-correlation period would be at the top; negative correlation periods are of the same height as the positive ones). Also shown in Fig. 2, by the dotted hor-izontal line, are the 0.4 correlation levels, comfortably above 99% confidence levels for both 60- and 36-point (60%*60) time series (0.27 and 0.35).
One can notice that during the first event (a) the correlation
is high (Cna, Cf a>0.4) for 6 h (11:00–17:00 UT) and it is
very high (Cf a>0.67, Cna>0.84) for 3 h (14:00–17:00 UT).
A similar pattern is observed for the second event (b), ex-cept that the very high correlation period is observed ear-lier (12:00–15:00 UT). Interestingly, the correlation with the Norway power appears to be generally greater. This can be seen not only from the correlation coefficients themselves but also from the simple comparison of the line plots, thus at
∼12:30 UT on 14 February 2000 the Norway SNR peaks
al-most simultaneously with the CNA, while Finland SNR vari-ation only shows a broad maximum around this time.
3.1 High correlation periods occurrence
The correlation coefficients computed, as described above, are used in this section to investigate the diurnal and sea-sonal dependencies of the high correlation period (HCP)
oc-currence. In Fig. 3 each line corresponds to a HCP (both Cna
and Cf a>0.4). The horizontal position of the line shows the
time of day while the vertical position shows the time of year,
0 5 10 15 20 25 30 35 SNR, dB 0.18 0.42 0.44 0.57 0.90 0.90 0.84 0.21 .0 .1 .2 .3 .4 .5 .6 A, dB
a)
10 11 12 13 14 15 16 17 18 Universal Time 0 5 10 15 20 25 30 35 SNR, dB 0.03 0.86 0.91 0.82 0.36 .0 .1 .2 .3 .4 .5 .6 A, dBb)
A
N
F
Cna CfaFig. 2. Cosmic noise absorption (CNA) in IRIS beam 41 at 1-min resolution for (a) 12 and (b) 14 February 2000, 10:00–18:00 UT (red line). Backscatter power (SNR) of the STARE Norway (Fin-land) echoes in the closest cell (see Fig. 1) is shown by the blue (green) line. The correlation coefficients between CNA and SNR
of the STARE Norway and Finland echoes (Cnaand Cf a) for each
1-h period are shown by the blue (green) horizontal lines, respec-tively, with the digits above and height from the bottom of each panel showing the amount of correlation. The 0.4 levels are shown by the dotted horizontal lines.
as indicated on the right axis (1 January is at the bottom of the diagram while 31 December is at the top). The HCPs were observed more frequently in the afternoon (12:00–17:00 UT) and during the winter (November−February). The secondary maxima were observed near midnight (21:00–02:00 UT) and during the summer (August). The heavy line shows the to-tal (for each hour) HCP number versus time of day, normal-ized to the total (for all events) HCP number. Thus, dur-ing 2000–2001 only 200 periods with high correlation were observed, with the maximum occurrence in the afternoon (14:00–15:00 UT).
This conclusion, however, needs to be verified since, un-like riometer absorption data that was available most of the time (>98% at beam 41 in our observations), the SNR data was not, and Fig. 3 shows the histograms of the STARE Norway and Finland echo occurrence that also exhibit broad maxima in the afternoon at 14:00–17:00 UT, so that a day-time maximum in the HCP occurrence could be simply a result of the oversampling by the STARE radars. One can, however, recognize in Fig. 3 a feature that suggests other-wise, namely that the relative (with respect to the STARE
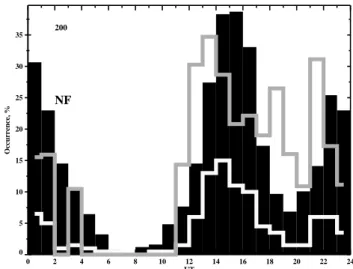
0 2 4 6 8 10 12 14 16 18 20 22 24 UT 200 J F M A M J J A S O N D 0 5 10 15 20 25 Occurrence, % N F
Fig. 3. Diurnal variation of the STARE echo occurrence in the cells closest to the IRIS beam 41 for 2000–2001 with the black (grey) rectangles/line showing the Norway (Finland) echo occurrence. Each 1-h period of high CNA/SNR correlation (Cna, Cf a>0.4) is
shown by the horizontal line with the distance from the bottom cor-responding to the time of the year, as shown on the right axis. The heavy line shows the diurnal variation of the total (for each 1-h in-terval) number of high correlation periods (HCPs) normalized to the total (for all 24 h) number of HCPs shown in the top left corner.
echo number) HCP number variation also maximizes in the afternoon, at around 13:00–14:00 UT, when the heavy line is the highest relative to both Norway and Finland occurrences. The same effect can also be recognized if one compares the occurrences in the afternoon and midnight sectors. Both STARE echo occurrences are comparable in these two sec-tors, whereas the HCP occurrence is at least 2 times higher in the afternoon (15% versus 6%).
A similar feature is also present if one considers not only the total number of echoes versus the time of the observa-tions, as in Fig. 3, but also the total number of 1-h periods with at least 60% echo occurrence, which is perhaps a more proper measure for the STARE echo occurrence, since this was the criterium for the correlation coefficient calculations. Figure 4 shows the 60% STARE echo occurrence (black his-togram) and the relative HCP occurrence (grey thick line). To obtain the latter we divided the HCP occurrence (white line in Fig. 4) if the latter was above a critical value of 2, by the STARE occurrence and normalized it, so that the total area under the grey line is equal to 100%. The STARE echo distribution in Fig. 4 is very similar to that in Fig. 3, with the maximum at 14:00–16:00 UT. The relative HCP occurrence is maximized somewhat earlier, at 12:00–15:00 UT. One can conclude that the maximum of the HCP occurrence in the afternoon sector is not purely due to the bias in the STARE echo occurrence but rather suggestive of a general pattern.
Given this pattern for the diurnal variation of HCP occur-rence it is instructive to compare it with the diurnal varia-tion for various absorpvaria-tion intensity levels, in attempt to re-veal the typical absorption intensities during the periods with
0 2 4 6 8 10 12 14 16 18 20 22 24 UT 200 0 5 10 15 20 25 30 35 Occurrence, % NF
Fig. 4. Diurnal variation of the 1-h periods of STARE observations when both radars detected echoes at least 60% of the time. The white line is the diurnal variation of the total (for each 1-h interval) number of high correlation periods (HCP) (same as in Fig. 3) and the heavy grey line is the relative (with respect to the STARE 60%-occurrence) HCP occurrence normalized to 100%.
high correlation; Fig. 5 shows this comparison for (a) all 731 days of observations and (b) 111 days with at least one HCP present during 2000–2001. The absorption levels shown in Fig. 5 are computed for 1-h average absorption. The white lines in Fig. 5 are the HCP occurrence and the black lines are the relative occurrence of the 0.25<A<0.50 dB level with re-spect to the one of 0.00<A<0.25 dB. The latter was plotted in panel (b) only when the HCP occurrence exceeded 10%.
Let us first discuss the features of panel (a). Only the first distribution (0.00<A<0.25) exhibits similar variation to the HCP occurrence, all other diurnal variations are rather an-ticorrelated with that of the HCPs. The relative occurrence between the two absorption levels also shows some anticor-relation, although its minimum is not exactly simultaneous with the maximum of the HCP variation but shifted by 1– 2 h. Overall, absorption between 0.00–0.25 dB is observed more frequently in the afternoon, both in absolute terms and relative to the absorption between 0.25–0.50 dB. During 111 days with HCPs, panel (b), the absorption is predominantly between 0.00–0.25 dB with some contribution from the 0.25– 0.50 dB level. The trends are similar to the HCP occurrence. The relative occurrence of 0.25–0.50 dB level is, however, somewhat greater than that for all 731 days.
In summary, the absorption was predominantly in the range 0.00–0.25 dB in the afternoon when the HCP occur-rence was at maximum, which suggests that HCPs are asso-ciated with the low absorption intensities.
3.2 Scatter plots of CNA/SNR correlation
The question of what are the typical conditions for the HCPs to be observed is a fundamental one, and in this section we
0 10 20 30 40 50 60 Occurrence, % 0.00 < A < 0.25 0.25 < A < 0.50 0.50 < A < 1.00 1.00 < A a) 0 2 4 6 8 10 12 14 16 18 20 22 24 UT 0 10 20 30 40 50 60 Occurrence, % b) 0 2 4 6 8 10 12 14 16 18 20 22 24 UT
Fig. 5. The occurrence of various absorption levels for (a) all 731 days and (b) 111 days with at least one 1-h HCP during 2000–2001. The white line shows the HCP occurrence (the same as in Figs. 3 and 4) and the black line shows the occurrence of the 0.25<A< 0.50 level relative to the one of 0.0<A<0.25.
and Cf aagainst each other and colour-coding all the points
in correlation coefficient between the STARE powers Cnf
and absorption intensity A.
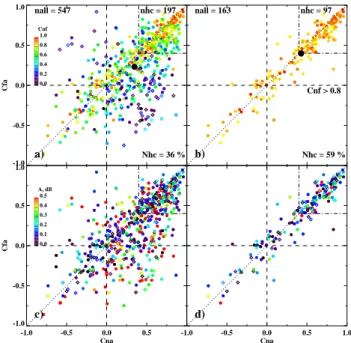
Figure 6 presents the results of this comparison for the en-tire range of correlation coefficients from −1.0 to +1.0 and for all 111 days during which at least one HCP was observed. In panel (a), although the scatter is large, the points are clus-tered around the dotted line of ideal coincidence. Interest-ingly, when the discrepancies are large, for example, when
Cnaand Cf a are of the opposite sign, Cnf is predominantly
negative (diamonds). The points also tend to be closer to the
ideal coincidence line when Cnf is larger. This point is made
clearer in panel (b) which shows only the points with Cnf>
0.8. The mean correlation coefficients (Cna, Cf a)shown by
the large black dot in panels (a) and (b) are also greater in
panel (b) and so is the percentage of HCPs, Nhc. The latter
are calculated by dividing the number of HCPs (points in the
right top corners nhc, Cna, Cf a>0.4) by the total number of
points nall. The points with greater Cnf are associated with
greater Cna, Cf a(red points concentrate in the top-right
cor-ner). Figures 6a,b thus indicate that the amount of correlation between absorption and VHF echo power depends strongly upon the amount of correlation between backscatter powers
-1.0 -0.5 0.0 0.5 1.0 Cfa 0.0 0.2 0.4 0.6 0.8 1.0 Cnf a) nall = 547 nhc = 197 Nhc = 36 % b) nall = 163 nhc = 97 Nhc = 59 % Cnf > 0.8 -1.0 -0.5 0.0 0.5 Cna -1.0 -0.5 0.0 0.5 1.0 Cfa 0.0 0.1 0.2 0.3 0.4 0.5 A, dB c) -1.0 -0.5 0.0 0.5 1.0 Cna d)
Fig. 6. The scatter plot of correlation coefficients (Cf aversus Cna)
for (a) and (c) all correlation coefficients between STARE Norway and Finland backscatter powers Cnf and (b) and (d) for Cnf>0.8.
All points in panels (a),(b) and (c),(d) are colour-coded in Cnf and
absorption intensity A, with the colour bar shown in the top-left corner of panels (a) and (c), respectively. The points
correspond-ing to the positive (negative) Cnf and A are marked with circles
(diamonds). The total number of all points nall (points with
suf-ficiently high correlations nhc) is shown in the top-left (top-right)
corner with percentage of the HCPs Nhc=nhc/nall shown in the
bottom-right corner of panels (a) and (b). The large black circles in panels (a) and (b) mark the mean (Cna, Cf a).
recorded by the two radars. It is also noteworthy that Figs. 6a and b do not have any noticeable bias towards either of the STARE radars; the scatter plots are fairly symmetric with re-spect to the ideal coincidence line and the mean correlation coefficient is only slightly larger for Norway radar. The
dis-crepancy is larger for all Cnf, Fig. 6a (mean Cna=0.35 versus
mean Cf a=0.23), but this is almost entirely due to the points
with negative Cnf and Cf aand positive Cna (cluster of
di-amonds in the bottom-right quadrant), so that for Cnf>0.8
(Fig. 6b) the discrepancy becomes smaller (0.43 versus 0.40). Panels (c) and (d) present the same data as panels (a) and (b), except that colour-coding has been done in absorption intensity. There is no clear trend in the absorption in pan-els (c); all points are rather mixed. The points with larger absorption tend to appear farther from the ideal coincidence line, so that in panel (d) the points near it predominantly have small absorption, with exception of the top-right corner.
3.3 CNA/SNR correlation and spatial effects
In the beginning of Sect. 3 we noted that the observations at the IRIS beam 41 had a better opportunity to show high cor-relation than the ones at beam 9, simply because of the spatial
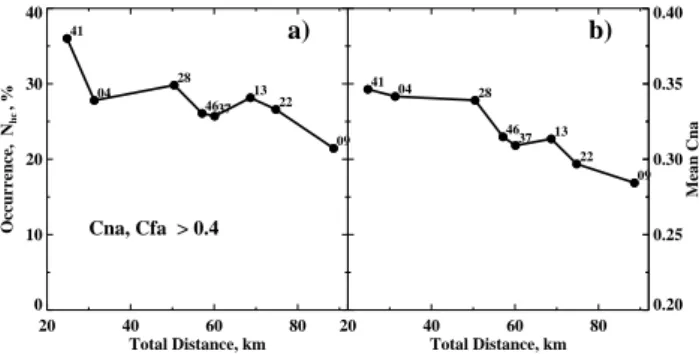
20 40 60 80 Total Distance, km 0 10 20 30 40 Occurrence, N hc , % a) 41 04 28 4637 13 22 09 Cna, Cfa > 0.4 20 40 60 80 Total Distance, km b) 41 04 28 46 37 13 22 09 0.20 0.25 0.30 0.35 0.40 Mean Cna
Fig. 7. Dependence of the (a) occurrence of HCPs and (b) mean
correlation coefficient Cnaupon the total distance between the
col-lecting area foci for selected IRIS beams. The IRIS beam numbers are shown by digits near each point.
differences in observational areas. In this section we explore the spatial effects by employing the data from all considered IRIS beams and corresponding STARE radar cells. To char-acterize the differences in observational areas we introduce a simple quantitative measure, namely for each of the eight IRIS beams we consider the total distance between the points of maximum sensitivity, that is the perimeter of the triangle formed by the centers of the two radar cells and by the cen-tral position of the IRIS beam. This parameter describes the degree of similarity between the observational areas, both in terms of the orientation and foci closeness; the closer it is to zero, the larger the similarity. Figure 7 shows the (a)
occur-rence of HCPs and (b) the mean correlation coefficient Cna
as functions of the total distance. The occurrence Nhc and
mean coefficient Cna are computed as described in the
pre-vious section. The IRIS beam number is indicated near each point.
As one would expect, point 41 is the highest in both pan-els having the largest HCP occurrence and mean correlation, while point 9 is the lowest. Overall, there is a decrease in both HCP occurrence and mean correlation with total dis-tance increase, which indicates that the spatial effects con-tribute strongly to the amount of correlation observed.
One can argue that Fig. 7 is biased towards IRIS beam 41, since the event selection was based entirely on the data from this direction. We therefore repeated the HCP occur-rence calculations seven more times (by taking as the “base” direction IRIS beams 4, 28, 46, 37, 13, 22, and 9, selecting
corresponding event databases, and computing Nhcfor each
of these directions) and found only marginal differences as compared to the results presented in Fig. 7. Thus, the HCP respective occurrences were 36, 27, 29, 26, 25, 28, 26, and 21%, where the first value refers to the HCP occurrence at beam 41 from Fig. 7a.
4 Discussion
The observations of high positive correlation between the ri-ometer absorption and the VHF echo power reported in this
paper are the first observations of this kind, which neces-sitates the consideration of this phenomenon in the context of other auroral phenomena, as outlined in Sect. 1. In this sense of special importance is the fact that a vast majority of high correlation events occur in the afternoon sector, be-tween 12:00 and 19:00 UT, Fig. 3. On a case-by-case basis, the events of very long duration and high correlation were also observed between 12:00 and 17:00 UT, Fig. 2. The absorption events in this time sector are significantly less understood than other absorption types such as, for exam-ple, midnight and morning absorption, both linked to the substorm activity on the nightside (Stauning, 1996a). It is, therefore, not surprising that the high correlation was ob-served away from the midnight meridian, in sharp contrast with the results for the correlation with the optical intensity (Ansari, 1964) and magnetic disturbance (Brown and Camp-bell, 1962), since the physical mechanism responsible for the enhanced CNA levels could easily be different for the after-noon events.
It is well accepted that the bulk of the absorption events is associated with the enhanced ionization (ambient
elec-tron density Ne) at D-/lower E-region altitudes caused by the
precipitating electrons (Hargreaves, 1969; Stauning, 1996a). Some of the absorption events observed with riometers in the polar cap, however, have been also associated in the past with an increase in the E-region collision frequencies caused by electron heating (Stauning, 1984; Stauning and Olesen, 1989) and with an increase in F-region densities (Rosenberg et al., 1993; Wang et al., 1994).
The power of coherent echoes is, on the other hand, a com-plex function, depending upon the electric field intensity E (through the fractional electron density fluctuation amplitude
δNe/Ne), ambient electron density Ne, angle between the
di-rection of propagation k and that of the magnetic field B (as-pect angle α), angle between k and the plasma drift vector
Vd (flow angle θ ), and distance from the radar site to the
backscatter region r (e.g. Haldoupis, 1989). In this study, we consider observations at essentially one observational point (one beam of IRIS and closest STARE cells), which greatly simplifies the problem, as both r and α can be assumed to be constants with refraction negligible at 140 MHz. Even though r and α are different for the two radars, this is not an issue since we consider the correlations. The flow an-gle effects, in principle, could be present in the SNR data, as the echo power is known to decrease with the deviation from the plasma drift direction (Andr´e, 1983). We are not in a position to estimate the flow angles and to study these ef-fects rigourously, since this would require the information on the electric field at the locations of the selected IRIS beams during the entire period under investigation. Given that the interpretation of the STARE velocity data is far from straight-forward, in particular, during the intervals of strong plasma flow (Uspensky et al., 2004), we focused on the echo power data. First of all, we were interested in the fact of a high CNA/SNR correlation itself and were confident that the us-age of the relatively short 1-h intervals minimized the flow angle effects in the correlation analysis. In addition, the
magnetic perturbation data from the International Monitor for Auroral Geomagnetic Effects (IMAGE) and Sub-Auroral Magnetometer Network (SAMNET) fluxgate magnetometers for individual events showed that the electrojet flow was rel-atively stable in terms of direction. We think, therefore, that the most important parameters in the context of this study are
the electric field intensity E and the electron density Ne. The
relative contribution of E and Ne to the power of coherent
echoes is still not well understood though, with some studies showing a strong electric field control (e.g. Haldoupis et al.,
1984) and others suggesting that power is proportional to Ne2
(Uspensky et al., 1983; Starkov et al., 1983; Haldoupis et al., 1990).
The combination of high electric fields and electron densi-ties thus may be the reason for the enhancements in both au-roral absorption and VHF echo power, which can explain our observations of high correlation. There is one drawback in this interpretation though, namely that the principal absorp-tion layer is somewhat lower than the typical altitude range where VHF radars detect irregularities (85–95 km for absorp-tion versus 105–110 km for irregularities). This is not a prob-lem if the densities vary to a large degree synchronously for the altitude range in question (85–110 km), which could be the case if the spectra of the precipitating electrons are far from being monoenergetic. The wealth of existing obser-vational evidence on the correlation between optical inten-sity and CNA seems to support this hypothesis, since optical measurements typically refer to higher altitudes than those of absorption (e.g. Holt and Omholt, 1962; Ansari, 1964).
To check whether the electrons precipitating at two set of heights (around 90 and 110 km) belong to the same population, one would need to compare the elec-tron flux measurements for two corresponding energy ranges. The empirical formula for the effective altitude of the energy deposition derived by del Pozo et al. (1997),
ε(H )=4×10⁵exp(−0.101H ), gives electron energies of 45
and 6 keV, respectively. Unfortunately, the electron flux mea-surements in both energy ranges are difficult to obtain; the instruments on board of the geostationary satellites, such as Los Alamos National Laboratory (LANL) satellites, mea-sure the fluxes of the electrons in the inner magnetosphere with ε>50 keV, whereas ionospheric satellites, such as De-fense Meteorological Satellite Program (DMSP), can provide the fluxes of precipitating electrons with ε<32 keV. The for-mer give temporal variation at several points in the region
of closed field lines (6.6 RE, where RE is the Earth’s radius)
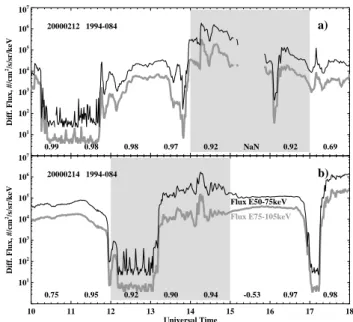
while the latter provide spatial variation along several satel-lite paths (Sun-synchronous orbits at ∼830-km altitude). The two lowest electron energy channels for a Synchronous Or-bit Particle Analyzer (SOPA) instrument (Belian et al., 1992) on board of the presently operational LANL satellites are 50–75 and 75–105 keV. Although these energies are some-what greater than those of interest, one can check whether the electron fluxes were synchronous, and in Fig. 8 we show the electron flux measurements from these two energy chan-nels from the LANL satellite 1994–084, the satellite closest in magnetic local time (MLT∼UT+10) to the IRIS viewing
101 102 103 104 105 106 107 Diff. Flux, #/cm 2/s/sr/keV 20000212 1994-084 a) 0.99 0.98 0.98 0.97 0.92 NaN 0.92 0.69 10 11 12 13 14 15 16 17 18 Universal Time 101 102 103 104 105 106 107 Diff. Flux, #/cm 2/s/sr/keV 20000214 1994-084 b) Flux E75-105keV Flux E50-75keV 0.75 0.95 0.92 0.90 0.94 -0.53 0.97 0.98
Fig. 8. SOPA spin-averaged electron flux measurements at 1-min resolution for (a) 12 and (b) 14 February 2000, 10:00–18:00 UT. The highlighted areas correspond to the periods of very high cor-relation from Fig. 2. The digits at the bottom of each panel show the correlation coefficients between the fluxes at two lowest energy channels for each 1-h interval.
area (MLT∼UT+3), for the same periods as in Fig. 2. The flux variations for the two lowest channels are well synchronized, meaning that the electrons at the lowest end of energy spectrum in the inner magnetosphere belong to the same population, which, in turn, suggests that the fluxes of precipitating electrons are likely to vary synchronously, as well. The periods of very high CNA/SNR correlation from Fig. 2 (highlighted in Fig. 8) correspond to the intervals during which the correlation between fluxes was very high (above 0.9). One can conclude that the electron flux data from the LANL satellite is consistent with the idea that the CNA/SNR correlation is due to the electrons whose fluxes vary synchronously, to a first approximation, within a range of altitudes (90–110 km).
Another possibility is that the CNA/SNR correlation is as-sociated with the electrons precipitating at essentially the same altitude range, since the division between the typical altitudes for CNA and SNR measurements is by no means well defined. The thickness of the principal absorption layer (vertical distance between points where absorption is half that at the peak) can be as high as 15–20 km (e.g. Jespersen et al., 1968) and the absorption layer peak can be well above 90 km (e.g. Terkildsen et al., 2004). The VHF backscatter signal, on the other hand, can come from the wide range of heights with the altitude range which contributes the most to the backscatter power that is dependent upon the
back-ground density Ne(h)and fractional density fluctuation
am-plitude (δNe/Ne)(h)profiles, as described recently by
One particular issue needs to be discussed in this context, namely the nature of VHF echoes observed during the HCPs or, more specifically, whether these echoes were in fact polar mesospheric echoes, since in the past a positive CNA/SNR correlation has been reported for PMSE observations (e.g. Czechowsky et al., 1989; Kirkwood et al., 1995; Barabash
et al., 2002). One should bear in mind, however, that
the vast majority of the PMSE observations have been per-formed with vertical incidence VHF radars at frequencies near 50 MHz, while our measurements were carried out with an oblique-sounding 144-MHz radar, sensitive to field-aligned irregularities in the E region. For a similar experi-ment geometry, the short-duration (<20 min) PMSE echoes detected by the Super Dual Auroral Radar Network (Su-perDARN) Syowa East radar, at very short ranges (180– 315 km), have been reported recently by Hosokawa et al. (2004). In our observations the ranges were much larger (>700 km) and the VHF backscatter was typically observed as wide (∼400 km) and relatively stable (1–2 h) bands of echoes; these features are typical for the E-region echoes as opposed to the polar mesospheric echoes.
The results on the diurnal/seasonal variation presented in this study also disagree with the PMSE hypothesis. The HCP occurrence was clearly maximized in the winter, while PMSEs are observed from May to August in the North-ern Hemisphere (Bremer et al., 2003). Mesospheric echoes are observed also in the winter but these echoes are signif-icantly less frequent and are typically associated with the enhanced particle precipitation (Czechowsky et al., 1989). Our result on the HCP diurnal variation differs from that of Barabash et al. (2002), who reported a significant correla-tion between the square of CNA and PMSE intensities in the 20:00–06:00 UT sector. We conclude, therefore, that VHF echoes in our observations are unlikely to originate from the D-region.
Diurnal variation of HCP was similar to that of the low-est absorption level (0.0–0.25 dB) and different from other higher levels of absorption, Fig. 5a. For days with at least one HCP, the CNA at the highest levels (>0.5 dB) was virtu-ally negligible, Fig. 5b. These features suggest that HCPs are associated with the softer electrons that precipitate at higher E-region altitudes and produce relatively small (though still noticeable) absorption enhancements. The lower the elec-tron energy, the larger the altitude of maximum ionization and hence the better the chances for high correlation with the backscatter power. If so, one would expect the absorption intensity to decrease with a correlation coefficient increase. Indeed, for individual events this was often the case, for ex-ample, in Fig. 2 the highest correlation was observed when CNA was at maximum. Statistically, however, the effect was not obvious; in Figs. 6c and d points with larger absorption were scattered in a seemingly random fashion. We believe that the reason can be that, apart from the physical conditions (e.g. particle energy which stipulates the maximum ioniza-tion height) at a specific point of measurement, the amount of correlation is strongly controlled by the degree of spatial homogeneity, as discussed below.
The question that we address is: How much of the cor-relation is “lost” due to the differences in observational ar-eas, as very often riometer absorption and other parameters are compared at locations that are somewhat apart from each other? In this study we specifically looked at the problem by exploiting a unique opportunity stemming from the ex-periment geometry in Northern Scandinavia, where riometer absorption measurements with high spatial resolution can be combined with the stereoscopic measurements by two VHF radars.
We first looked at the effects of the correlation between echo powers measured by two radars which can be consid-ered as a measure of spatial homogeneity/inhomogeneity, as explained below. The radars monitor slightly different lo-cations and, in addition, collect a backscatter signal from
slightly different areas (radar cells), Fig. 1. In a
situa-tion when the correlasitua-tion Cnf is high, the effects arising
from these differences are not significant because of the gen-eral spatial homogeneity of processes associated with the backscatter signal formation. Thus, if the generation of irreg-ularities is spatially homogeneous in the common area that includes both Norway and Finland radar cells, one can ex-pect that the echo power would be the same for both radars as well, and so would the correlation between some other parameter (CNA in our case) and SNR, in agreement with Fig. 6b. For events with sufficiently high correlation
coef-ficients Cnf, the agreement between CNA/SNR correlation
coefficients is greatly improved. The increases in the mean
correlation coefficients, Cna and Cf a, and in the HCP
per-centage, Nhc, were also significant, Fig. 6. We hence
con-clude that the CNA/SNR correlation is dependent upon the spatial homogeneity of the processes associated with cosmic noise absorption and backscatter power formation.
The data presented in Fig. 6, however, also indicate that
the percentage of the events with high correlation Cnf is
rather low (yellow/red dots in Fig. 6 are less frequent than black/blue/green ones) and that very often it is negative, so that more often than not the backscatter signal formation pro-cess is inhomogeneous. In this situation a similarity between the collection areas becomes an important factor which can significantly affect the amount of CNA/SNR correlation ob-served. Indeed, Fig. 7 shows that this is exactly the case.
Both the HCP occurrence Nhcand the mean correlation Cna
are reduced if the distances between the collection area foci are large, which we interpret as a decrease associated with differences in observational areas, combined with consider-able spatial inhomogeneity.
In our discussion of the factors responsible for the CNA/SNR correlation we emphasized the importance of both electric field intensity and ambient electron density but left unaddressed the issue of the dominant factor, since no direct measurements of these two parameters were available. The HCPs were predominantly observed in the afternoon sector in between 15 and 20 MLT, Fig. 3. Given the latitude of the
common FoV (∼66◦MLAT), the observations in this sector
predominantly refer to the eastward electrojet or to the earth-ward flow region in the magnetospheric plasma sheet. In this
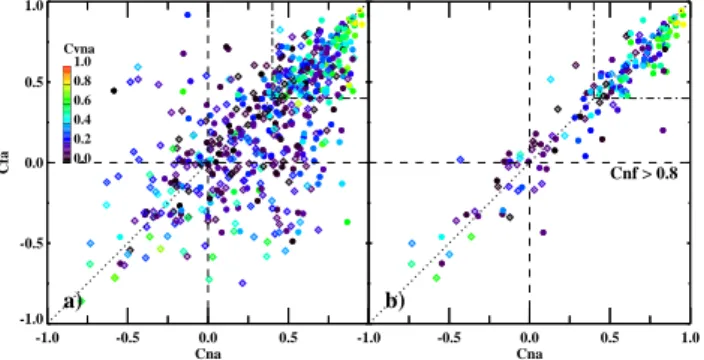
region, the electrons could be accelerated by the earthward convection to sufficiently high energies to be detected by a riometer on the Earth’s surface. If so, one can expect a cer-tain amount of correlation between riometer absorption and plasma drift velocity. Even though the derivation of the full plasma drift vector from the STARE Doppler velocity mea-surements could be quite challenging, as demonstrated re-cently by Uspensky et al. (2003, 2004), one can still attempt to identify the effect sought in the Doppler velocity data. Figure 9 shows the results of the analysis analogous to that of Fig. 6, except that the points are colour-coded in corre-lation coefficient between the STARE Norway velocity and
IRIS absorption, Cvna. One can recognize in Fig. 9a that,
in-deed, green and yellow points cluster in the top-right corner,
meaning that the periods with very high Cna>0.8 also have
high Cvna=0.6–0.8. The same is true for Fig. 9b (Cnf>0.8,
“homogenous case”), which, together with the fact that in
Figs. 6a and b and Figs. 9a and b points with high Cnf and
Cvnabelong to two different (although intersecting)
popula-tions, suggests that there are two different factors involved. One can also see from Fig. 9 that not all HCPs are associ-ated with a high correlation between CNA and the STARE velocity, and that the amount of correlation for velocity is lower than that for power. One can conclude that for some HCP events, especially for ones that exhibit a very high cor-relation, the electric field seems to dominate, which is con-sistent with the “electron acceleration by a convection” sce-nario proposed. More studies are needed, however, in or-der to make a more definite conclusion, in particular, those that would utilize the in-situ observations of the magneto-spheric particle dynamics and ground-based measurements of the electron density.
5 Summary
The analysis of the data collected during 2 years of operation in the common area between 7×7-beam imaging riometer and two VHF coherent radars in Northern Scandinavia has revealed ∼200 one-hour intervals (during 111 days) of sta-tistically significant correlation between the cosmic noise ab-sorption and the signal-to-noise ratio. During several events the CNA/SNR correlation was particularly high (>0.8) for up to 3 h. The high correlation periods are observed predom-inantly in the afternoon sector and in the winter, with the secondary peaks near midnight and in the summer. The di-urnal variation of HCPs is similar to that for events with 1-h mean absorption between 0.0 and 0.25 dB. Consideration of all 1-h intervals for 111 days with HCPs present, on the other hand, did not reveal any trend in the correlation coefficient dependence upon the absorption intensity. The CNA/SNR correlation at a given observational point was found to de-pend strongly upon the correlation between the coherent echo intensities measured by two VHF radars at the same loca-tion; both the CNA/SNR correlation and agreement between the CNA/SNR correlation for the two radars was greatly re-duced when the correlation between the echo powers
mea--1.0 -0.5 0.0 0.5 Cna -1.0 -0.5 0.0 0.5 1.0 Cfa 0.0 0.2 0.4 0.6 0.8 1.0 Cvna a) -1.0 -0.5 0.0 0.5 1.0 Cna b) Cnf > 0.8
Fig. 9. The same as Figs. 6a and b but colour-coded in correlation coefficient between the STARE Norway velocity and IRIS absorp-tion, Cvna.
sured by the two radars was smaller. From a comparison be-tween measurements at 8 observational directions, the HCP occurrence and mean correlation coefficients decrease as the total distance between points of maximum sensitivity (foci) increases; both parameters are maximized for measurements at a direction for which the intersection of the riometer beam with the ionosphere and radar cell are most comparable in terms of spatial coverage, orientation, and proximity between the collection area foci.
6 Conclusions
The events that exhibit a statistically significant correlation between the cosmic noise absorption and the VHF coherent echo intensity, while being relatively rare, show consistent features in their occurrence and correlation amount, from which the following conclusions can be drawn.
1. There is evidence that high correlation periods are as-sociated with the electrons in the lower end of the en-ergy spectrum precipitating at the E-region bottom side as opposed to more energetic particles with the maxi-mum ionization altitude in the D-region. The echoes de-tected by an oblique-sounding VHF radar during HCPs are unlikely to be mesospheric echoes. These echoes represent the scatter from the E-region field-aligned ir-regularities. Highly correlated variations in CNA and SNR are likely to be related to variation in ionization at two sets of heights caused by the precipitating elec-trons at two close sets of energies whose fluxes are well correlated.
2. The amount of correlation between riometer absorption and VHF echo power is strongly controlled by the de-gree of spatial homogeneity of the processes leading to enhanced CNA and SNR.
3. For riometer beams and radar cells comparable in ar-eas and shapes, the correlation is reduced as the arar-eas become less overlapped (e.g. due to rotation) and as the distance between points of maximum sensitivity in-creases. It is therefore imperative to employ the CNA
and SNR measurements in similar radio signal collec-tion areas when comparing these parameters (e.g. in studies of the factors controlling CNA and SNR).
Acknowledgements. This research was supported by the Particle
Physics and Astronomy Research Council, UK (research grant PPA/G/S/2001/00491). The IRIS facility is operated by the De-partment of Communication Systems at Lancaster University and funded by PPARC in collaboration with the Sodankyl¨a Geophysi-cal Observatory. The STARE system is operated jointly by the Max Plank Institute for Aeronomie, Germany, and the Finnish Meteo-rological Institute, Finland, in cooperation with SINTEF, Univer-sity of Trondheim, Norway. The IMAGE magnetometer data are collected as a Finnish-German-Norwegian-Polish-Russian-Swedish project conducted by the Technical University of Braunschweig and FMI. The SAMNET magnetometers are funded by PPARC. We are grateful to M. Uspensky and P. Janhunen of FMI for providing ac-cess to the STARE data and to D. DeLapp and G. Reeves of Los Alamos National Laboratory for providing the SOPA LANL parti-cle flux data.
Topical Editor W. Kofmann thanks M. J. Jarvis and E. Nielsen for their help in evaluating this paper.
References
Andr´e, D.: The dependence of the relative backscatter cross section of 1-m density fluctuations in the auroral electrojet on the angle between electron drift and radar wave vector, J. Geophys. Res., 88, 8043–8049, 1983.
Ansari, Z. A.: The aurorally associated absorption of cosmic noise at College, Alaska, J. Geophys. Res., 69, 4493–4513, 1964. Barabash, V., Kirkwood, S., and Chilson, P. B.: Are variations
in PMSE intensity affected by energetic particle precipitation?, Ann. Geophys., 20, 539–545, 2002,
SRef-ID: 1432-0576/ag/2002-20-539.
Belian, R. D., Gisler, G. R., Cayton, T., and Christensen, R.: High-Z energetic particles at geostationary orbit during the great So-lar Proton Event series of October 1989, J. Geophys. Res., 97, 16 897–16 906, 1992.
Bremer, J., Hoffman, P., and Hansen, T. L.: Geomagnetic control of polar mesosphere summer echoes, Ann. Geophys., 18, 202–208, 2000,
SRef-ID: 1432-0576/ag/2000-18-202.
Bremer, J., Hoffmann, P., Latteck, R., and Singer, W.: Sea-sonal and long-term variations of PMSE from VHF radar observations at Andenes, Norway, J. Geophys. Res., 108, doi:10.1029/2002JD002369, 2003.
Brown, R. R. and Barcus, J. R.: Balloon observations of the ex-tent and structure of auroral zone electron precipitation events, J. Geophys. Res., 68, 6069–6077, 1963.
Brown, R. R. and Campbell, W. H.: An auroral-zone electron pre-cipitation event and its relationship to a magnetic bay, J. Geo-phys. Res., 67, 1357–1366, 1962.
Browne, S., Hargreaves, J. K., and Honary, B.: An imaging riometer for ionospheric studies, Electronics and Communication, 7, 209– 217, 1995.
Czechowsky, P., Reid, I. M., Ruster, R., and Schmidt, G.: VHF radar echoes observed in the summer and winter polar meso-sphere over Andoya, Norway, J. Geophys. Res., 94, 5199–5217, 1989.
del Pozo, C. F., Hargreaves, J. K., and Aylward, A. D.: Ion compo-sition and effective ion recombination rate in the nighttime auro-ral lower ionosphere, J. Atmos. Sol. Terr. Phys., 59, 1919–1943, 1997.
Detrick, D. L. and Rosenberg, T. J.: A phased-array radiowave im-ager for studies of cosmic noise absorption, Radio Sci., 25, 325– 338, 1990.
Greenwald, R. A., Weiss, W., Nielsen, E., and Thomson, N. R.: STARE: A new radar auroral backscatter in Northern Scandi-navia, Radio Sci., 13, 1021–1029, 1978.
Haldoupis, C.: A review on radio studies of auroral E region iono-spheric irregularities, Ann. Geophys., 7, 239–258, 1989. Haldoupis, C., Nielsen, E., and Ierkic, H. M.: STARE Doppler
spec-tral studies of westward electrojet radar aurora, Planet. Space Sci., 32, 1291–1300, 1984.
Haldoupis, C., Nielsen, E., and Schlegel, K.: Dependence of radar auroral scattering cross section on the ambient electron density and the destabilizing electric field, Ann. Geophys., 8, 195–212, 1990.
Hargreaves, J. K.: On the variation of auroral radio absorption with geomagnetic activity, Planet. Space Sci., 14, 991–1006, 1966. Hargreaves, J. K.: Auroral absorption of HF radio waves in the
ionosphere: A review of results from the first decade of riom-etry, Proc. IEEE, 57, 1348–1373, 1969.
Holt, O. and Omholt, A.: Auroral luminosity and absorption of cos-mic radio noise, J. Atmos. Terr. Phys., 24, 467–474, 1962. Hosokawa, K., Ogawa, T., Yukimatu, A. S., Sato, N., and
Iye-mori, T.: Statistics of Antarctic mesospheric echoes observed with the SuperDARN Syowa radar, Geophys. Res. Lett., 31, doi:10.1029/2003GL018776, 2004.
Jespersen, M., Kane, J. A., and Landmark, B.: Electron and positive ion density measurements during conditions of auroral absorp-tion, J. Atmos. Terr. Phys., 30, 1955–1964, 1968.
Kavanagh, A. J., Honary, F., McCrea, I. W., Donovan, E., Wood-field, E. E., Manninen, J., and Anderson, P. C.: Substorm related changes in precipitation in the dayside auroral zone - a multi in-strument case study, Ann. Geophys., 20, 1321–1334, 2002, SRef-ID: 1432-0576/ag/2002-20-1321.
Kavanagh, A. J., Kosch, M. J., Honary, F., Senior, A., Marple, S. R., Woodfield, E. E., and McCrea, I. W.: The statistical dependence of auroral absorption on geomagnetic and solar wind parameters, Ann. Geophys., 22, 877–887, 2004,
SRef-ID: 1432-0576/ag/2004-22-877.
Kirkwood, S., Cho, J., Hall, C. M., Hoppe, U.-P., Murtagh, D. P., Stegman, J., Swartz, W. E., van Eyken, A. P., Wannberg, G., and Witt, G.: A comparison of PMSE and other ground-based observations during the NLC-91 campaign, J. Atmos. Terr. Phys., 57, 35–44, 1995.
Klostermeyer, J.: On the diurnal variation of polar mesosphere sum-mer echoes, Geophys. Res. Lett., 26, 3301–3304, 1999. Nielsen, E.: The STARE system and some of its applications, pp.
213–224, In: IMS Source Book Guide to the International Mag-netospheric Study Data Analysis, (Eds.) Russell, C. T. and South-wood, D. J., Washington, D.C., AGU, 1982.
Nishino, M., Nishitani, N., Sato, N., Yamagishi, H., Lester, M., and Holtet, J. A.: A rectified response of daytime radio wave absorp-tion to southward and northward excursions during northward interplanetary magnetic field: A case study, Adv. Polar Upper Atmos. Res., 13, 139–153, 1999.
Rosenberg, T. J., Wang, Z., Rodger, A. S., Dudeney, J. R., and Baker, K. B.: Imaging riometer and HF radar measurements of drifting F region electron density structures in the polar cap, J.
Geophys. Res., 98, 7757–7764, 1993.
Starkov, G. V., Oksman, J., Uspensky, M. V., and Kustov, A. V.: On the dependence of radar aurora amplitude on ionospheric elec-tron density, J. Geophys., 52, 49–52, 1983.
Stauning, P.: Absorption of cosmic noise in the E-region during electron heating events, Geophys. Res. Lett., 11, 1184–1187, 1984.
Stauning, P.: Investigations of ionospheric radio wave absorption process using imaging riometer techniques, J. Atmos. Terr. Phys., 58, 753–764, 1996a.
Stauning, P.: High-latitude D- and E-region investigations using imaging riometer observations, J. Atmos. Terr. Phys., 58, 765– 783, 1996b.
Stauning, P. and Olesen, J. K.: Observations of the unstable plasma in the disturbed polar E-region, Physica Scripta, 40, 325–332, 1989.
Terkildsen, M. B., Fraser, B. J., and Yamagishi, H.: Determi-nation of the altitudinal peak of cosmic noise absorption us-ing a vertical parallax technique, Geophys. Res. Lett., 31, doi:10.1029/2003GL019068, 2004.
Uspensky, M., Koustov, A., Janhunen, P., Pellinen, R., Danskin, D., and Nozawa, S.: STARE velocities: importance of off-orthogonality and ion motions, Ann. Geophys., 21, 729–743, 2003,
SRef-ID: 1432-0576/ag/2003-21-729.
Uspensky, M., Koustov, A., Janhunen, P., Nielsen, E., Kauristie, K., Amm, O., Pellinen, R., Opgenoorth, H., and Pirjola, R.: STARE velocities: 2 Evening westward electron flow, Ann. Geophys., 22, 1077–1091, 2004,
SRef-ID: 1432-0576/ag/2004-22-1077.
Uspensky, M. V., Pellinen, R. J., Baumjohann, W., Starkov, G. V., Nielsen, E., Sofko, G., and Kaila, K. U.: Spatial variations of ionospheric conductivity and radar auroral amplitude in the east-ward electrojet region during pre-substorm conditions, J. Geo-phys., 52, 40–48, 1983.
Wang, Z., Rosenberg, T. J., Stauning, P., Basu, S., and Crowley, G.: Calculations of riometer absorption associated with F region plasma structures based on Sondre Stromfjord incoherent scatter radar observations, Radio Sci., 29, 209–215, 1994.