HAL Id: hal-00317343
https://hal.archives-ouvertes.fr/hal-00317343
Submitted on 8 Apr 2004
HAL is a multi-disciplinary open access
archive for the deposit and dissemination of
sci-entific research documents, whether they are
pub-lished or not. The documents may come from
teaching and research institutions in France or
abroad, or from public or private research centers.
L’archive ouverte pluridisciplinaire HAL, est
destinée au dépôt et à la diffusion de documents
scientifiques de niveau recherche, publiés ou non,
émanant des établissements d’enseignement et de
recherche français ou étrangers, des laboratoires
publics ou privés.
Polar cap absorption events of November 2001 at Terra
Nova Bay, Antarctica
L. Perrone, L. Alfonsi, V. Romano, G. de Franceschi
To cite this version:
L. Perrone, L. Alfonsi, V. Romano, G. de Franceschi. Polar cap absorption events of November 2001
at Terra Nova Bay, Antarctica. Annales Geophysicae, European Geosciences Union, 2004, 22 (5),
pp.1633-1648. �hal-00317343�
© European Geosciences Union 2004
Geophysicae
Polar cap absorption events of November 2001 at Terra Nova Bay,
Antarctica
L. Perrone, L. Alfonsi, V. Romano, and G. de Franceschi
Istituto Nazionale di Geofisica e Vulcanologia, Rome, Italy
Received: 12 September 2003 – Revised: 6 February 2004 – Accepted: 18 February 2004 – Published: 8 April 2004
Abstract. Polar cap absorption (PCA) events recorded
dur-ing November 2001 are investigated by observations of iono-spheric absorption of a 30 MHz riometer installed at Terra Nova Bay (Antarctica), and of solar proton flux, monitored by the NOAA-GOES8 satellite in geo-synchronous orbit. During this period three solar proton events (SPE) on 4, 19 and 23 November occurred. Two of these are among the dozen most intense events since 1954 and during the cur-rent solar cycle (23rd), the event of 4 November shows the greatest proton flux at energies >10 MeV. Many factors con-tribute to the peak intensity of the two SPE biggest events, one is the Coronal Mass Ejection (CME) speed, other factors are the ambient population of SPE and the shock front due to the CME. During these events absorption peaks of several dB (∼20 dB) are observed at Terra Nova Bay, tens of minutes after the impact of fast halo CMEs on the geomagnetic field. Results of a cross-correlation analysis show that the first hour of absorption is mainly produced by 84–500 MeV pro-tons in the case of the 4 November event and by 15–44 MeV protons for the event of 23 November, whereas in the entire event the contribution to the absorption is due chiefly to 4.2– 82 MeV (4 November) and by 4.2–14.5 MeV (23 November). Good agreement is generally obtained between observed and calculated absorption by the empirical flux-absorption rela-tionship for threshold energy E0=10 MeV. From the
residu-als one can argue that other factors (e.g. X-ray increases and geomagnetic disturbances) can contribute to the ionospheric absorption.
Key words. Ionosphere (Polar Ionosphere, Particle
precipi-tation) – Solar physics (Flares and mass ejections)
Correspondence to: L. Perrone
(perrone@ingv.it)
1 Introduction
In the 1940’s and 1950’s the emissions of solar protons as-sociated with solar flares, as particles in many cases, leave the Sun within a few minutes after the solar flare’s maxi-mum (Cane et al., 2002). Recently, the role of Coronal Mass Ejections (CMEs) in producing major solar proton emission was emphasised to the point that a small group of solar par-ticle physicists consider major solar proton events (SPE) to be completely independent of flares (Kahler, 2001; Reames, 1999). But Cane (2003) observed that particles with ener-gies above 25 MeV are consistent with a population of flare particles in major SPEs, whereas particles events associated with fast shocks, driven by fast CMEs, have the highest inten-sity below 20 MeV. The occurrence of SPE during minimum solar activity is very low, while in active Sun years, espe-cially during the falling and rising phase of the solar cycle, the SPEs may average one per month.
It is well recognised that these solar particles have prompt and nearly complete access to the polar atmosphere via mag-netic field lines interconnected between the interplanetary medium and the terrestrial field (van Allen et al., 1971). Con-sequently, they cause excess ionisation in the ionosphere, particularly concentrated in the polar cap, which, in turn, leads to an increase in the absorption of HF radio waves, termed polar cap absorption (PCA).
The ionisation occurs at various depths which depends on the incident particle energies, so that the ionisation in the D-region during PCA events is due mainly to protons with energy in the range of 1 to 100 MeV that corresponds to an altitude between 30–80 km (Ranta et al., 1993; Sellers et al., 1977; Collis and Rietveld, 1990; Reid, 1974). Parti-cles with even greater energies (>500 MeV) are recorded on the ground by a cosmic-ray detector; these events are called Ground Level Enhancement (GLE) (Davies, 1990).
The major PCA events are associated with solar flares lo-cated on the side of the solar central meridian towards which the Sun rotates, that is, on the west side. It has also been found that the delay between flare outbreak and the start of
1634 L. Perrone et al.: Polar cap absorption events at Terra Nova Bay
a PCA depends mainly upon the heliographic latitude (Ranta et al., 1993). The boundary of the PCA region is typically between 60◦ and 65◦geomagnetic latitude, while the
dura-tions of PCAs vary from a few hours to many days (Collis and Rietveld, 1990).
A characteristic feature of PCA events is the large differ-ence between day and night absorption intensities for con-stant precipitating fluxes of solar particles. A day-to-night ratio in absorption intensities of around 4–8 is often observed during PCA events (Stauning, 1996; Hargreaves et al., 1993; Ranta et al., 1995; Pietrella et al., 2002). The most plausible explanation is a drastic increase in the effective recombina-tion rate after sundown, i.e. when negative ions can exist and positive ions are mostly in the form of clusters which have much larger recombination rates than molecular ions usually found at higher altitudes, and during the day lowering the density of free electrons which cause ionospheric absorption. Speculations that the particles causing PCA were protons of solar origin were suggested before they could be verified by in situ experiments (Reid and Collins, 1959). Modern instru-ments carried on geostationary satellites are now able to pro-vide continuous measurements of solar particles fluxes and their energy spectra. Routine monitoring of ionospheric ab-sorption is possible since the riometric technique was intro-duced (Little and Leinbach, 1959). This instrument measures the amount of cosmic noise absorbed by the ionosphere at operating frequencies in the range 20–50 MHz.
During daytime when PCA event ionisation conditions ex-ist, the dependence of electron density Ne on ionisation rate
q is relatively simple; an excellent correlation has been ob-served between simultaneous measurements of HF absorp-tion and proton fluxes. This prompted the development of empirical formulas connecting these two quantities for esti-mating one from the other when only a single measurement is available. When a daytime PCA occurs the absorption A (measured in dB) should be proportional to the square root of the proton intensity, A∼J1/2(van Allen et al., 1964, Pat-terson et al., 2001).
In the current solar cycle 23 there occurred five se-vere SPEs (>10000 pfu; pfu=particle flux units), five strong (>1000 pfu), 19 moderate (>100 pfu) and 43 (>10 pfu) mi-nor intensity. Ranta et al. (1993) found that only the medium to strong events (>100 pfu) lead to appreciable variations in the absorption. In fact, SPE with pfu <100 result in varia-tions of daily absorption below 2 dB.
Three PCAs recorded at Terra Nova Bay, and SPE events during November 2001 (daylight period) are investigated. Two of these SPEs are severe events and one is of minor in-tensity. Owing to the continuous daylight over Antarctica the absorption data considered here do not show any day/night changes.
A cross-correlation analysis is applied to the ionospheric absorption (1-min data) by 30 MHz riometer measurements and to the integral/differential solar protons flux (5-min data) by the NOAA-GOES-8 satellite. In Sects. 2 and 3 the data analysis are described and the preliminary results are shown
and discussed. Finally, discussion and conclusions are out-lined in Sect. 4.
2 Observations
In November 2001 the riometers installed at the Italian sta-tion of Terra Nova Bay (TNB) in Antarctica (geographic co-ordinates: 74.69◦S, 164.12◦E; geomagnetic co-ordinates: 77.32◦S, 278.92◦E) recorded three PCA events.
A solid state riometer (La Jolla; Chivers, 1975), at 30 MHz, had been placed at TNB in November 1994, to measure the cosmic noise coming from the outer space. The 30 MHz measure is sampled every 1 min. For calculating the ionospheric absorption it is necessary to determine the so-called Quiet Day Curve (QDC). The estimation of the QDC has been carried out first by taking into account the 85% of the maximum value of cosmic radio noise at every given side-real time, and then by applying a Fourier expansion to these percentage values, in order to eliminate the data scattering at the same sidereal time (De Franceschi et al., 1997). Beside the riometer data for investigating the PCA events we have also analysed magnetospheric and solar parameters.
For this scope the following data are taken into account:
– The North Polar Cap index (PC) 1-min data recorded
at Thule (geographic co-ordinates: 77.50◦N, 290.80◦E,
geomagnetic co-ordinates: 88.8◦N, 12.5◦E). Using the
Polar Cap index from the Northern Hemisphere is in-evitable, since the index from Antarctic station Vostok, at the time of this analysis, is not available for the pe-riod considered. Generally, PC values greater than 12 indicate extremely disturbed periods (Lukianova et al., 2002).
– The 5-min integral solar proton flux, defined as the
so-lar proton flux greater than a threshold energy E0, and
differential solar proton flux, defined as a solar proton flux with energy included between a lower and an upper limit. These data are derived by the NOAA GOES-8 satellite in geo-synchronous orbit recorded at seven dif-ferent energy channels.
– Solar X-rays from 0.1–0.8 nm, measured by GOES-10
station with a 1-min sampling by the NOAA-GOES-10 satellite in geosynchronous orbit.
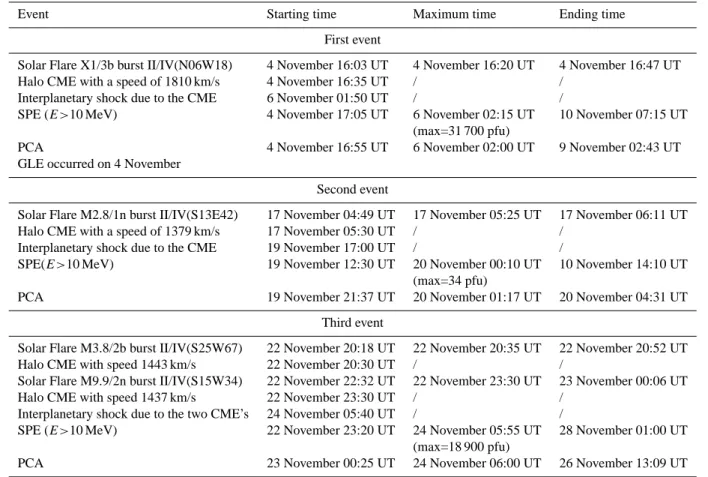
A full as possible description of PCA events is given which also considers the solar sources, as CMEs and flares, and the solar protons events linked to the PCAs. A list of these events and their characteristics is reported in Table 1. The starting time of PCA is considered when the ionospheric absorption is greater than 0.5 dB, also the data about CME are obtained by SOHO’s (Solar and Heliospheric Observatory) LASCO (Large Angle and Spectrometric Coronograph experiment) coronograph.
The temporal behaviour of both ionospheric absorption and differential proton flux is shown in Fig. 1. X-ray flux
Table 1. List of the principal geophysical conditions during November 2001.
Event Starting time Maximum time Ending time
First event
Solar Flare X1/3b burst II/IV(N06W18) 4 November 16:03 UT 4 November 16:20 UT 4 November 16:47 UT Halo CME with a speed of 1810 km/s 4 November 16:35 UT / /
Interplanetary shock due to the CME 6 November 01:50 UT / /
SPE (E>10 MeV) 4 November 17:05 UT 6 November 02:15 UT 10 November 07:15 UT (max=31 700 pfu)
PCA 4 November 16:55 UT 6 November 02:00 UT 9 November 02:43 UT
GLE occurred on 4 November
Second event
Solar Flare M2.8/1n burst II/IV(S13E42) 17 November 04:49 UT 17 November 05:25 UT 17 November 06:11 UT Halo CME with a speed of 1379 km/s 17 November 05:30 UT / /
Interplanetary shock due to the CME 19 November 17:00 UT / /
SPE(E>10 MeV) 19 November 12:30 UT 20 November 00:10 UT 10 November 14:10 UT (max=34 pfu)
PCA 19 November 21:37 UT 20 November 01:17 UT 20 November 04:31 UT Third event
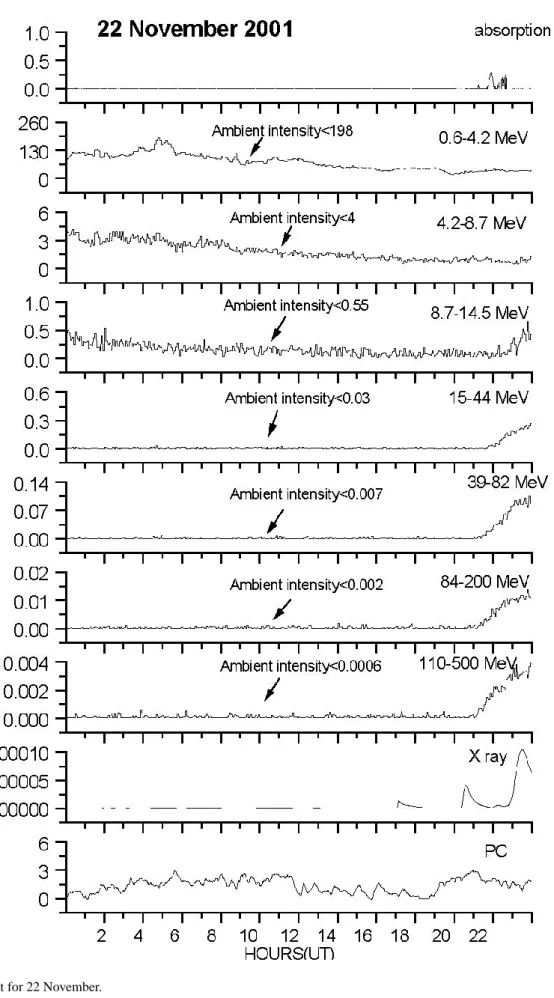
Solar Flare M3.8/2b burst II/IV(S25W67) 22 November 20:18 UT 22 November 20:35 UT 22 November 20:52 UT Halo CME with speed 1443 km/s 22 November 20:30 UT / /
Solar Flare M9.9/2n burst II/IV(S15W34) 22 November 22:32 UT 22 November 23:30 UT 23 November 00:06 UT Halo CME with speed 1437 km/s 22 November 23:30 UT / /
Interplanetary shock due to the two CME’s 24 November 05:40 UT / /
SPE (E>10 MeV) 22 November 23:20 UT 24 November 05:55 UT 28 November 01:00 UT (max=18 900 pfu)
PCA 23 November 00:25 UT 24 November 06:00 UT 26 November 13:09 UT
data and the geomagnetic polar cap index, PC, are also plot-ted for a better description of the solar-magnetic activity dur-ing November 2001.
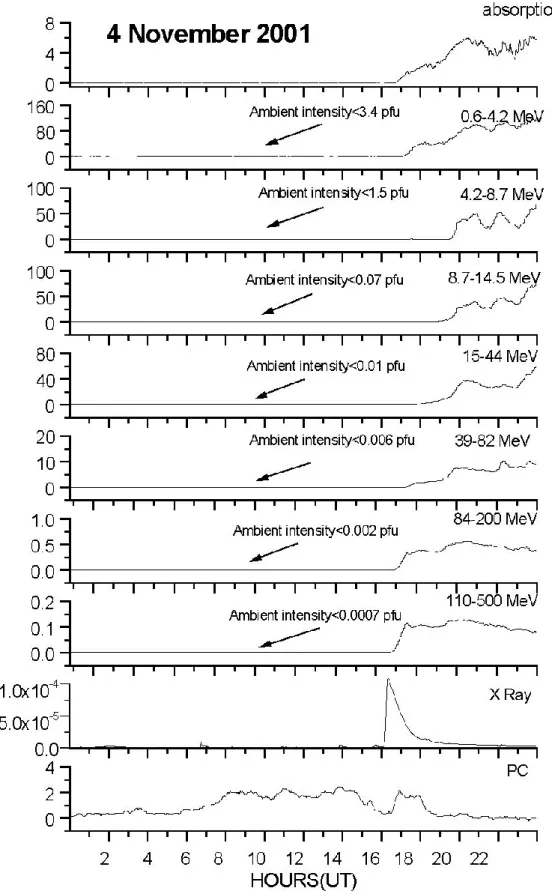
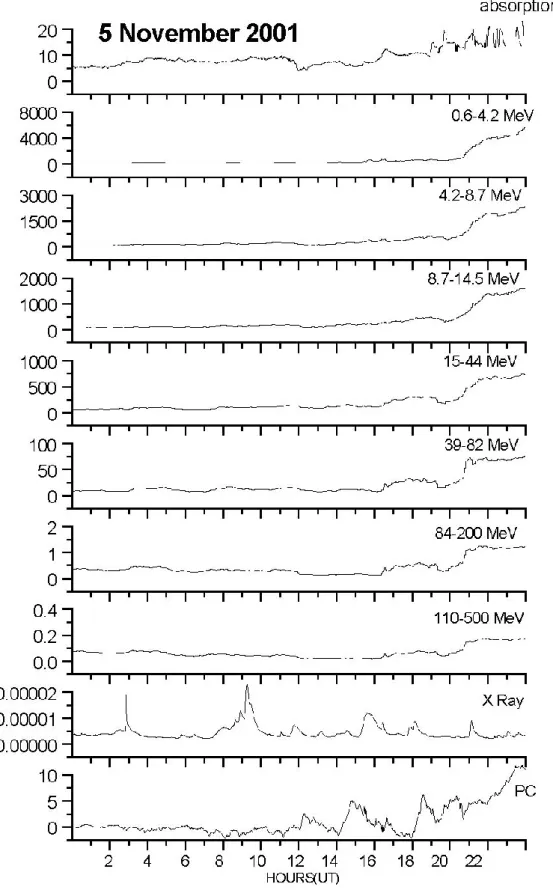
The first PCA analysed here starts on 4 November and ends on 9 November (Table 1, Fig. 1). The proton flux en-hancement begins at the highest energy band when the flare is still in progress. While the starting time of PCA is ob-served a few minutes later a proton flux enhancement in the band 84–500 MeV occurs, simultaneous with the band 15– 82 MeV, 0.6–4.2 MeV and about 20–35 min after the solar sources (Fig. 2). The arrows in Fig. 2 indicate the ambi-ent intensity observed for the differambi-ent solar proton energies just preceding the onset of the SPE. The PC index shows a moderate magnetic activity between 08:00–14:00 UT and between 16:00–18:00 UT. The ionospheric absorption begin-ning on 4 November decreased when four M Solar Flares (10−5≤I<10−4W/m2) occurred on 5 November. This is
probably responsible for a further increase in the proton flux after 16:00 UT and a further increase is observed af-ter 20:00 UT (Fig. 3), whereas the PC has a fluctuating be-haviour between 14:00–21:00 UT and definitively increases after 21:00 UT.
On 6 November an interplanetary shock due to the CME generated on 4 November is observed at 01:50 UT and as a probable consequence of this shock the maximum of the
event is recorded around 02:00 UT and the PC reaches a value of 30 (Fig. 4). All energy bands show a proton flux in-crease around 02:00 and 03:00 UT, while another inin-crease is observed between 04:00–06:00 UT, especially for the lower energy protons, and a decrease around 06:00 and 07:00 UT. After this peak the absorption starts to decline. The SPE and PCA decrease slowly, probably by a series of M solar flares occurring between 6–8 November (Fig. 1), which have en-hanced the solar proton flux and X-ray flux.
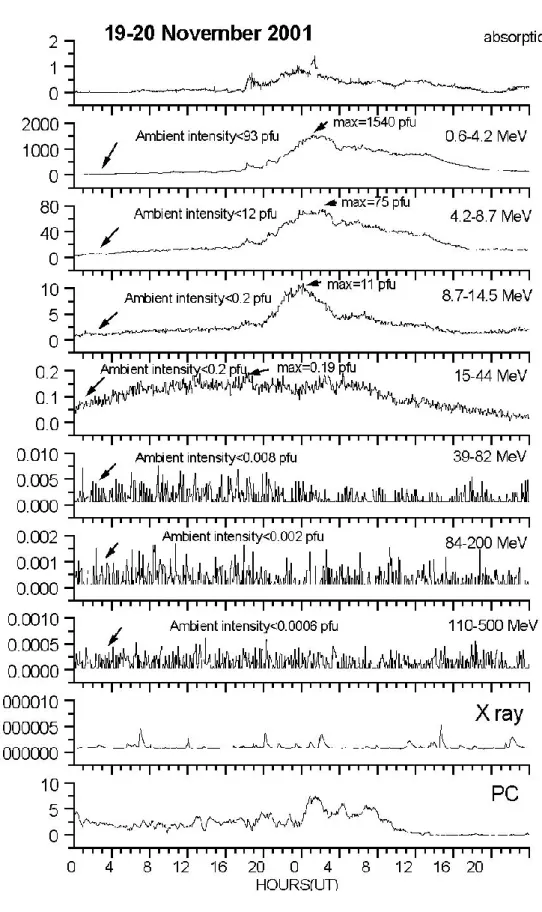
A moderate PCA began on 19 November and ended on 20 November (Fig. 5). This event is characterised by a flare coming from the Sun’s eastern hemisphere (Table 1). Com-pared to the first event the ambient intensity of SPE is greater for the energy band 0.6–44 MeV (Fig. 5). At 17:00 UT on 19 November an interplanetary shock is observed, associated with the CME (halo 05:30) which occurred on 17 Novem-ber and the protons with energies between 0.6 and 14.5 MeV show an increase between 18:00 UT and 20:00 UT. The high-est energy band remains undisturbed. The ionospheric ab-sorption further increases around 18:00 UT and the magnetic activity is disturbed, as indicated by PC values among 2.5 and 3.5 after 13:00 UT and up to 4 at 20:00 UT. Around 01:00 UT on the 20 November proton event, PCA and PC index reach their maximum (Fig. 5).
1636 L. Perrone et al.: Polar cap absorption events at Terra Nova Bay
Fig. 1. Variation of ionospheric absorption, differential solar protons flux, solar X-rays (0.1–0.8 nm), PC index during November 2001 (from top to bottom).
The third Solar Proton Event analysed here starts on 22 November and ends on 26 November (Table 1). Compared to the first event the ambient intensity of SPE is greater for the energy band 0.6–14.5 MeV, in comparison to the sec-ond, for the energy bands of 0.6–4.2 MeV and 8.7–14.5 MeV (Fig. 6). On 22 November protons with 84–500 MeV be-gin to grow after 21:00 UT, about 10 min after the first solar flare, whereas protons with energies between 0.6–8.7 MeV are undisturbed. The PC index shows a moderate magnetic
activity. The PCA starts at 0:25 UT on 23 November, around 3 h later than a proton flux of higher energy and from 1 to 4 h after the solar sources (Fig. 7). The PC is disturbed the whole day and reaches a value of 5 at 23:50 UT.
The PCA and SPE maxima on 24 November at about 06:00 UT are probably connected to a shock impacting the geomagnetic field at 05:40 UT (Fig. 8). This shock comes from the interaction between two interplanetary shock waves by the two CMEs on 22 November (Table 1).
1638 L. Perrone et al.: Polar cap absorption events at Terra Nova Bay
Table 2. Daily correlation coefficients between A and J1/2for each differential protons flux energy band.
Day of November r r r r r r r
2001 0.6–4.2 MeV 4.2–8.7 MeV 8.7-14.5MeV 15–44 MeV 39–82 MeV 84–200 MeV 110–500 MeV
4 0.96 0.94 0.92 0.97 0.95 0.90 0.45 5 0.58 0.84 0.73 0.57 0.66 0.26 −0.015 6 0.95 0.98 0.98 0.96 0.93 0.92 0.93 7 0.81 0.84 0.87 0.86 0.95 0.96 0.91 8 0.78 0.76 0.92 0.95 0.97 0.79 0.26 9 −0.11 0.82 0.90 0.91 0.90 −0.28 −0.30 19 0.96 0.97 0.95 0.56 0.01 −0.35 0.03 20 0.92 0.91 0.90 0.86 0.21 0.11 0.01 23 0.91 0.97 0.97 0.95 0.83 0.70 0.44 24 0.78 0.97 0.97 0.96 0.86 0.82 0.81 25 0.69 0.87 0.98 0.89 0.99 0.63 −0.31 26 0.68 0.95 0.91 0.74 0.90 −0.19 −0.37
This interaction, plus the higher SPE ambient population at the time of the fast halo CME (Kalher, 2001), could be re-sponsible for the enhancement of the peak intensity observed in the energy range 0.6–14.5 MeV (Fig. 6). Compared to the first event the SPEs maxima are higher for the energy bands 0.6–8.7 MeV, for 8.7–14.5 MeV they are similar, while they are smaller for the highest energy band. The PC index indi-cates storm conditions between 06:00 and 08:00 UT with a maximum of 29.
3 Data analysis
3.1 Proton flux at commencement of PCA events
For estimating the proton energy band mainly contribut-ing to the initial phase of PCA, a cross-correlation analy-sis between the ionospheric absorption A(t ) and differen-tial solar proton flux J1/2(t −τ )for a different time delay (τ =0, −5, ...−60 min) is carried out for the two strongest events. In this analysis we use 5-min data of A and J be-tween 16:55 UT and 17:55 UT (first hour of the absorption) of 4 November. A(t ) is well correlated with 84–500 MeV solar protons with a delay between 0 and 30 min. The high-est correlations r are found for the energy band 84–200 MeV (r=0.99) and for 110–500 MeV (r=0.98) for a time delay equal to 5 to 15 min, while the correlation peak related to the energy band 0.6–4.2 MeV is recorded for τ =0 (r=0.98) (Fig. 9). Hence, the starting phase of the absorption is due mainly to 84–500 MeV and 0.6–4.2 MeV.
For the event of 23 November A and J data between 0:25 UT and 1:25 UT (first hour of PCA) are considered. On 23 November (Fig. 10), protons of 15–44 MeV mainly contribute to the absorption for τ =−210, ..., 0. For the en-ergy band 110–500 MeV the correlation coefficient is ≥0.9 for τ =−205, ..., −195 min (Fig. 10). In this case the starting phase of the absorption is due mainly to protons with ener-gies between 15–44 MeV.
3.2 Proton flux throughout the PCA event
The daily impact of the differential solar proton flux on the lower ionosphere is also investigated. A correlation analysis is then applied between A and J1/2hourly means along the days marked by the three SPE/PCA events. The results are presented in Table 2.
On 4 November a very high correlation (r≥0.9) is found for the protons with energies between 0.6–200 MeV, with a peak in the range 15 to 44 MeV, whereas 110–500 MeV pro-tons don’t seem to be correlated with the absorption. On 5 November the correlation is quite high (r=0.73–0.84) only for the energy band 4.2–14.5 MeV. For the day of the maxi-mum (6 November), the correlation is very high for the entire energy band (r=0.92–0.98) and the peak is in the range 4.2– 14.5 MeV (r=0.98). After the maximum of the absorption, the correlation slowly decreases, depending on the different protons energies. During the entire event (4–9), the main contribution is from protons with energies 4.2 to 82 MeV penetrating to altitudes between 80 and 40 km.
From 19 to 20 November protons with lower energies (0.6–14.5 MeV) are mainly involved, indicating that the ab-sorption is produced principally at a higher altitude region than in the previous case (>70 km). The daily correlation for 23 November results >0.9 for 0.6–44 MeV protons, while on the peak day (24 November) the results show r>0.9 for the energy band 4.2–44 MeV (Table 2). During the entire event (23–26), the main contribution was from protons with ener-gies of 4.2–14.5 MeV. It means that the primary contribution to the PCA arises from ionospheric regions between 80 and 60 km.
From the analysis of cross-correlation and the correlation between A and J1/2it can thus be argued that for the first event the starting phase of the absorption is due to protons of 84–500 MeV and 0.6–4.2 MeV (Fig. 9), whereas only in the later phase, between 19:00 UT and 20:00 UT the other channels go into action (see Fig. 2). For the third event the
1640 L. Perrone et al.: Polar cap absorption events at Terra Nova Bay
1642 L. Perrone et al.: Polar cap absorption events at Terra Nova Bay
1644 L. Perrone et al.: Polar cap absorption events at Terra Nova Bay
Fig. 9. Cross-correlation coefficients between A(t ) and differential J1/2(t − τ )calculated for the first hour of 4 November PCA event (16:55 UT–17:55 UT).
Fig. 10. Cross-correlation coefficients between A(t ) and differential J1/2(t − τ )calculated for the first hour of 23 November PCA event (00:25 UT–01:25 UT).
1646 L. Perrone et al.: Polar cap absorption events at Terra Nova Bay
Fig. 11. Hourly means of observed and computed absorption (for J >5 MeV, J >10 MeV) for the three PCA events. Corresponding residuals (observed – calculated absorption) are also plotted.
protons of 15–44 MeV contribute mainly to the beginning of PCA, whereas the protons with energy 4.2–14.5 MeV begin to enhance in a successive phase.
3.3 Testing the relationship between absorption and proton flux during the PCA event
These good correlations led us to apply a linear fit to the absorption and the square root of integrated solar pro-ton flux, providing a reasonable empirical relationship (e.g.
Potemra, 1972). The slope m and the correlation coef-ficient r are determined using the hourly averages of in-tegral solar proton flux. The best correlations are found for J >5 MeV (r=0.97) with m=0.11 dB(cm2s)1/2and for J >10 MeV (r=0.99) with m=0.14 dB(cm2s)1/2. Figure 11 shows the computed absorption, the observed absorption and the residuals (observed–calculated) for the three PCA events combined into a single time series. Notwithstanding these higher correlations on some occasions, the computed absorp-tion underestimates the observed values, whereas at other
times it is overestimated. Most of the residuals fall within ±0.5 dB, for J >5 MeV the residual percentage is 61% while for J >10 MeV it is 80%. For the residuals exceeding ±1 dB, when the computed absorption overestimates the observed absorption, the percentage for J >5 MeV is 34% while for J >10 MeV it is 2%. In the case for which the computed absorption underestimates the observed absorption, the per-centage for J >5 MeV is 5% while for J >10 MeV it is 4%. So the residuals calculated for J >10 MeV are smaller than those obtained for J >5 MeV. In particular, the overestima-tion of the observed absorpoverestima-tion is significant in the case of J >5 MeV. The poorest results are obtained for high so-lar proton fluxes, in particuso-lar on 5 November, for which residuals range between 2.5 and 2.8 dB. The low correlation found between the differential solar proton flux and iono-spheric absorption (Table 1) is confirmed by these high resid-uals. For example, the overestimation (∼−2.5 dB) obtained with J >10 MeV is poorer than that obtained for J >5 MeV (∼−1.2 dB), because in this second case it is inserted into the energy band 4.2–8.7 MeV for which there was found the best correlation (Table 1). A reason for the overestimation could be the occurrence of solar radio emission, whereas for the un-derestimation an X-ray increase is probably responsible; four solar flares of class M occurred, and the high geomagnetic activity has caused an enhancement of the absorption. The second case for which the errors are significant is between 23 and 24 November for which the residuals (∼2 dB) are posi-tive; the associated geomagnetic activity suggests that softer particles were also involved, enhancing the observed iono-spheric absorption.
4 Discussion and conclusions
1. The SPEs on 4 November and 22 November are among the dozen most intense events since 1954, with peaks of integrated solar protons flux (J >10 MeV) of 31 700 and 18 900 counts/cm2·s·sr. They are associated with large solar flares (X1 and M9.9) originating from the Sun’s western hemisphere and with high CME speeds. Unlike these great events, the SPE linked to the solar flare of 17 November is less intense (J =34 counts/cm2·s·sr). The peak intensity of an SPE depends on several factors, one of which is the CME speed. The CME of 4 November has a speed of 1810 km/s, which suggests that it can pro-duce an intense SPE. The CMEs of 22 November – on the other hand – have a speed of about 1440 km/s, but probably the enhanced ambient SPE population that can be observed in the energy band between 0.6–44 MeV and the interaction of the two CMEs contribute to the enhancement of the peak intensity in the energy bands 0.6–14.5 MeV. The impact of CME with the geomag-netic field for the two events corresponds to the peaks of PCA and of the magnetic activity (PC index). The less intense SPE has a softer spectrum due to the solar source at eastern longitudes, which also results in longer time
delays (∼2 days) between the beginning of the SPEs and the solar flares, than in the other two events. 2. The 4 November event, when also a Ground Level
Enhancement (GLE) was recorded (Richardson et al., 2003), shows a harder spectrum than the 22 Novem-ber SPE. This is also supported by the protons’ energies which contribute predominantly to the absorption. So the starting phase of the absorption for the first event is due mainly to 84–500 MeV and 0.6–4.2 MeV, with a time delay of 15, ..., 0 min and a correlation around 0.98, whereas for the second event the starting phase of the absorption is mainly due to protons with ener-gies between 15 and 44 MeV with τ =−210, ..., 0 min and a poorer correlation compared to the earlier event (r∼0.90). Considering the entire period, the main con-tribution of the event of 4 November is due to pro-tons with energies from 4.2 to 82 MeV penetrating to altitudes ranging from 80 to 40 km. For the event of 19 November the main contribution comes from pro-tons with energies 0.6 to 8.7 MeV. This means that the primary contribution to the PCA arises from an iono-spheric region >70 km. On the other hand, on 23 November, the main contribution is from protons of 4.2 to 14.5 MeV penetrating to altitudes between 80 and 60 km.
3. The empirical relationship between proton flux and ri-ometer absorption A∝J1/2 is applied for J >5 MeV and J >10 MeV. The best correlations are found for J >5 MeV (r=0.97) with m=0.11 dB(cm2s)1/2and for J >10 MeV (r=0.99) with m=0.14 dB (cm2s)1/2. The residuals calculated for >10 MeV are smaller than those obtained for J >5 MeV and they exceed ±1 dB in 6% of the cases. One factor is due to the chosen threshold (E=10 MeV) for which significant contributions by the lower energy protons are neglected. The others factors which may affect the result could be due to the over-estimation by the occurrence of solar radio emission, whereas for the underestimation the X-ray increase and the high geomagnetic activity have probably caused an enhancement of the absorption.
Acknowledgements. The authors would like to thank the Italian Na-tional Program of Antarctic Researches (PNRA) for supporting this study, the Space Environment Center (NOAA, US Dept. of Com-merce, Boulder, CO, USA) and the Danish Meteorological Institute for providing data, the referees for improving the manuscript.
Topical Editor M. Lester thanks R. Morris and M. Friedrich for their help in evaluating this paper.
References
Cane, H. V., Erickson, W. C., and Prestage, N. P.: Solar flares, type III radio bursts, coronal mass ejections, and energetic particles, J. Geophys. Res., 107, 14–1, 14–19, 2002.
Cane, H. V., von Rosenvinge, T. T., Cohen, C. M. S., and Mewaldt, R. A.: Two components in major solar particle events, Geophys. Res. Lett., 30, 8017–8020, 2003.
1648 L. Perrone et al.: Polar cap absorption events at Terra Nova Bay
Chivers, H. J.: High latitude ionospheric absorption, Antarc. J.U.S., X, 222–223, 1975.
Collis, P. N. and Rietveld, M. N.: Mesospheric observations with the EISCAT UHF radar during polar cap absorption events: elec-tron densities and negative ions, Ann. Geophys., 8, 809–824, 1990.
Davies, K.: Ionospheric Radio, Peter Peregrinus Ltd., London, UK, 1990.
De Franceschi, G., de Santis, A., and Perrone, L.: Analysis of Rio-metric data recorded at Terra Nova Bay, Antarctica, Conference Proceedings of Solar Terrestrial Predictions Workshop, edited by Heckman, G., Marubashi, K., Shea, M. A., Smart, D. F., and Thompson, R., RWC Tokyo, 431–434, 1997.
Hargreaves, J. K., Shirochkov, A .V., and Farmer, A. D.: The polar cap absorption event of 19–21 March 1990: recombination co-efficients, the twilight transition and midday recovery, J. Atmos. Terr. Phys., 55, 857–862, 1993.
Kahler, S. W.: The correlation between solar energetic particle peak intensities and speeds of coronal mass ejections: Effect of am-bient particle intensities and energy spectra, J. Geophys. Res., 106(A10), 20 947–20 955, 2001.
Little, C. G. and Leinbach, H.: The riometer: a device for the con-tinuous observation of ionospheric absorption, Proc. I.R.E., 47, 315–320, 1959.
Lukianova, R. and Troshichev, O.: The polar cap magnetic activity indices in the southern (PCS) and northern (PCN) polar caps: Consistency and discrepancy, Geophys. Res. Lett, 29, 1879– 1782, 2002.
Patterson, J. D., Armstrong, T. P., Lird, C. M., Detrick, D. L., and Weatherwax, A. T.: Correlation of solar energetic protons and polar cap absorption, J. Geophys. Res., 106, 149–163, 2001. Pietrella, M., Perrone, L., Romano, V., Alfonsi, L., Cerrone, M.,
and Rossi, C.: Upper atmosphere effects of solar and magnetic perturbations over Antarctica, ESA, SP-477, 471–474, 2002.
Potemra, T. A.: The empirical connection of riometer absorption to solar protons during PCA events, Radio Sci., 7, 571–577, 1972. Ranta, H., Ranta, A., Yousef, S. M., Burns, J., and Stauning, P.:
D-region observations of polar cap absorption events during the EISCAT operation in 1981–1989, J. Atmos. Terr. Phys, 55, 751– 766, 1993.
Ranta, H., Yamagishi, H., and Stauning, P.: Twilight anomaly, mid-day recovery and cutoff latitudes during the intense polar cap absorption event of March 1991, Ann. Geophys., 1, 262–276, 1995.
Reames, D. V.: Particle acceleration at the Sun and in the helio-sphere, Space Sci. Rev., 90, 413–491, 1999.
Reid, G. C. and Collis, C.: Observations of abnormal VHF radio wave absorption at medium and high latitudes, J. Atmos. Terr. Phys., 14, 68–81, 1959.
Reid, G. H.: Polar Cap Absorption – Observations and Theory, Fun-damentals of Cosmic Physics, 1, 167–204, 1974.
Richardson, I. G., Lawrence, G. R., Haggerty, D. K., Kucera, T. A., and Szabo, A.: Are CME “interactions” really important for ac-celerating major solar energetic particle events?, Geophys. Res. Lett., 30, 14, 1763–1766, 2003.
Sellers, B., Hanser, F. A., Stroscio, M. A., and Yates, G. K.: The night and day relationships between polar cap riometer absorp-tion and solar protons, Radio Sci., 5, 779–789, 1977.
Stauning, P.: High-Latitude D-and E-region investigations using imaging riometers observations, J. Atmos. Sol. Terr. Phys., 58-6, 765–783, 1996.
Van Allen, J. A., Lin, A. W., and Leinbach, H.: On the relationship between absolute solar cosmic ray intensity and riometer absorp-tion, J. Geophys. Res., 69, 4481–4491, 1964.
Van Allen, J. A., Fennell, J. A., and Ness, N. F.: Asymmetric access of energetic solar protons to the Earth’s north and south polar caps, J. Geophys. Res., 76, 4262–4275, 1971.