Mean velocities measured with the double pulse technique
7
0
0
Texte intégral
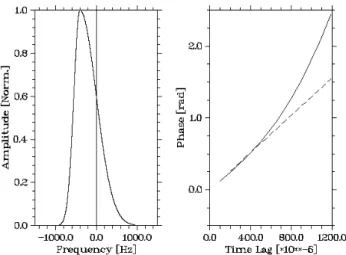
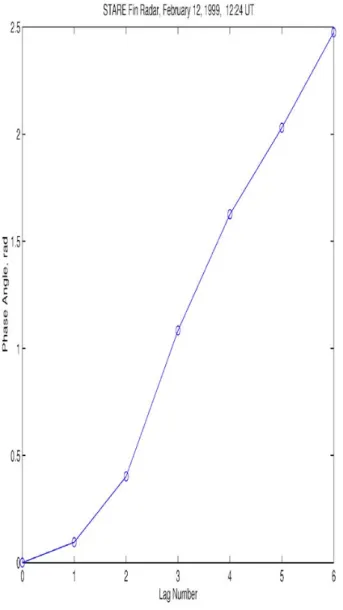
Figure
Documents relatifs