Bachelor Thesis 2016
M
ANAGEMENT OF ONLINE CUSTOMER REVIEWS IN THE HOSPITALITY
INDUSTRY
:
A
N EMPIRICAL ANALYSIS OF MANAGEMENT PRACTICES IN
THREE AND FOUR STAR HOTELS IN
S
WITZERLAND
Student:
Giulia Robbiani
Supervisor:
Roland Schegg
Submitted on: 28
thNovember 2016
ii
A
BSTRACT
Online review websites have become a powerful source of information and play a big role in the decision-making process of customers above all in the hotel industry (Blal & Sturman, 2014). To get the most valuable stay, potential guests will first look for previous customers’ feedbacks before choosing a hotel. Furthermore, it facilitates businesses to improve in the quality of their products and services. The communication between the two parties is now stronger than ever before (Fotis, 2015).
For this thesis, the Valais Tourism Observatory provided data from TrustYou of hotels in Switzerland. The aim of this research paper is to know how online reviews are managed by hotels in Switzerland.
In order to reach the objective, an empirical analysis has been conducted on Booking.com and on TripAdvisor. A sample of 150 three- and four- star hotels has been analysed, with 600 comments coming from Booking.com and 462 from TripAdvisor. The analysis has included comments answered from the 1st January 2013 until the 15th of October 2016. Moreover,
three hoteliers have been interviewed in order to have an insight of online reviews management practices.
The results of the analysis demonstrate that the most sensible factors according to customer reviews are the rooms, the location and the quality of the staff service. The most positively criticised sectors by guests are the breakfast, the quality of the staff service, the location and the rooms. The most negatively criticised sectors by guests are the rooms, the noise and the price. In addition, it confirms that hotels that have a higher score tend to answer more frequently than hotels that have a lower score. Finally, the analysis shows that hotels tend to answer to positive comments more than negative ones.
Keywords: Review websites, online reputation management, Swiss hotels, TrustScore.
iii
F
OREWORD AND ACKNOWLEDGEMENTS
Nowadays, people take into consideration more the experience of previous guests to make their experience more valuable and unforgettable. Indeed, they trust more online customer reviews than advertisements made by businesses because they have a neutral point of view (Mayer, 2015). According to a study made by Carmelon Digital Marketing (2014), which is a company that gives digital marketing solutions and services to leading companies internationally, “41% read reviews from other travelers before booking a hotel (Vardi, 2014). Many researches have been made aware of the impact of online reviews on the reputation of hotels. A recent study from Cornell University shows that encouraging the publication of reviews improves not only the ranking of the hotel, but the sales as well (Morand, 2016). It is important for hotels to pay attention and stay active on these reviews websites to stand out from their competitors (Saul, 2016). This is why, nowadays, for businesses to stay “alive”, they need to have an online presence and have to listen to what customers want and need. Therefore, they have to build a close and strong relationship with their guests.
The aim of this research is to know whether hotels take into account reviews and whether they answer to all comments or only a specific type. The main objective is to understand how these reviews are managed and their impact on the online reputation of hotels.
The difficulties encountered in this research paper were to define the important variables and what sub-criteria to include in order to have a pertinent result. Another difficulty was to decide how to evaluate each criteria, for example, how many points must be given to each criteria and to define whether all criteria have the same importance.
At the end of this paper, I would like to thank Roland Schegg who submitted me this subject, guided me, helped me and gave me advices throughout this paper. Without him, the research paper could not have been accomplished. I would like to show my gratitude to Ariane Boesch, Eric Fassbind and Daniel Rousseau to have given me their precious time and to have given me important information for my thesis as well. Finally, I would like to thank my family especially my sister, Cynthia, my brother, Zeno, and my cousin, Nina, to have read my paper.
iv
T
ABLE OF
C
ONTENTS
Abstract ... ii
Foreword and acknowledgements ... iii
List of tables ... vi
List of figures ...vii
Introduction ... 1
1. Literature review ... 3
1.1. The changing behaviour of consumers ... 3
1.2. Impact of social media ... 6
1.3. How important are reviews in the decision-making process of consumers? ... 7
1.4. Disadvantages of online review websites ... 8
1.5. Online reputation management by hoteliers ... 9
2. Research questions ... 16 3. Methodology ... 17 3.1. Detailed grid ... 17 3.2. Master grid ... 17 3.3. Parameters ... 20 3.4. TrustYou Score... 27 3.4.1. What is it? ... 27
3.4.2. Parameters compared with the TrustScore ... 28
3.5. Source of information ... 28
4. Results ... 29
4.1. Result of the analysis ... 29
4.1.1. Distribution of the total number of hotels in relation to their TrustScore ... 29
4.1.2. Positive versus negative comments ... 31
4.1.3. Sensible sectors according to customers ... 33
4.1.3.1. The most positively criticised sectors 4.1.3.2. The most negatively criticised sectors 4.1.4. Rate of answer... 39
4.1.5. Quality of answer ... 41
4.1.6. Length of answer ... 43
v
4.2. Interviews ... 46
5. Discussion ... 52
5.1 Positive versus negative comments ... 52
5.2. Sensible sectors for customers ... 52
5.2.1. The most positively criticised sectors ... 53
5.2.2. The most negatively criticised sectors ... 54
5.3. Rate of answer ... 54
5.4. Quality of answer ... 55
5.5. Length of answer ... 56
5.6. Speed of answer ... 56
5.7. Interviews ... 56
5.8. Answers to research questions ... 57
5.9. Limitations ... 59
Conclusion ... 60
References ... 61
Appendix I: Detailed grid ... 65
Appendix II: Judgement of the friendliness and the questioning of the hotel ... 66
Appendix III: Master grid ... 67
Appendix IV: List of hotels analysed ... 71
vi
L
IST OF TABLES
Table 1 Master grid’s characteristics ... 18
Table 2 Master grid Booking.com Part 1 ... 19
Table 3 Master grid Booking.com Part 2 ... 20
Table 4 Scale for positive and negative comments ... 20
Table 5 Example of calculation for the most sensible sectors for guests (not actual numbers) ... 22
Table 6 Example of how the most positively and negatively criticised sectors have been calculated (not actual numbers) ... 23
Table 7 Criteria to analyse quality of answer ... 25
Table 8 Example of average speed of answer (not actual numbers) ... 27
Table 9 Distribution of hotels analysed on Booking.com (blue) and on TripAdvisor (green) .. 29
Table 10 Proportion of hotels on Booking.com (blue) and TripAdvisor that have answered (green) ... 30
Table 11 Proportion of positive and negative comments on Booking.com... 31
Table 12 Proportion of positive and negative comments on TripAdvisor ... 32
Table 13 The most sensible sectors according to customers on Booking.com ... 33
Table 14 The most sensible sectors according to customers on TripAdvisor ... 34
Table 15 The most positively criticised sectors from guests on Booking.com ... 35
Table 16 The most positively criticised sectors from guests on TripAdvisor ... 36
Table 17 The most negatively criticised sectors from guests on Booking.com ... 37
Table 18 The most negatively criticised sectors from guests on TripAdvisor ... 38
Table 19 Rate of answer on Booking.com ... 39
Table 20 Rate of answer on TripAdvisor ... 40
Table 21 Quality of answer on Booking.com ... 41
Table 22 Quality of answer on TripAdvisor ... 42
Table 23 Length of answer on Booking.com ... 43
Table 24 Length of answer on TripAdvisor ... 44
vii
L
IST OF FIGURES
Figure 1 Circle of trust ... 4
Figure 2 How do you use customer review websites? ... 7
Figure 3 Global Review Distribution by site ... 11
Figure 4 Use of customer review websites in Europe ... 11
1
I
NTRODUCTION
Tourism is the world’s largest industry and is the fastest growing economic sector in the world. According to UNWTO, its contribution to the world GDP was 9.8% in 2015 and the international tourist arrivals grew by 4.6 % in 2015 to reach 1,184 million (World Tourism Organization UNWTO, 2016). It is expecting to reach 1,800 million by 2030. In Switzerland, tourism is the fifth largest sector of exportation and it contributes to 4% of the GDP. However, with the current strength of the Swiss franc, Switzerland has become an unaffordable destination for some tourists. Therefore, there is a bigger challenge for hoteliers to attract tourists.
Thanks to social media, businesses can promote their brand easily and can obtain a better understanding of the expectation of potential new guests. It has become a main source of information for travellers and it plays now an important role on customer’s decision-making process. Furthermore, it facilitates businesses to improve in the quality of their products and services. The communication between the two parties is now stronger than ever before (Fotis, 2015).
The power of marketing has changed as well; users have much more influence than before. New strategies have to be found for marketers. B2C engagement and customer service are the key to have a good online reputation (Buhalis & Mamalakis, 2015). Did you know that 77% of users refer often or always to comments on TripAdvisor before choosing a hotel? It is important for hoteliers to manage their online reputation effectively because they can better performs their internal and external operations, which allows them to keep track at the individual unit, brand and chain level (Lynn & Riaz, 2015).
Review websites and how hotels are managing their reputation are the main themes of this paper. Are these review websites a challenge for hoteliers? What do they think about that? To which kind of comments do hotels tend to respond too? Which are the hotels that answer most frequently on these review websites? These questions are answered throughout this research paper.
2 The first chapter is the literary review, it describes the current situation of online review websites with facts and figures. It explains the changing behaviour of consumer due to the improvement of technology, the impact of social media on users, its importance of the decision-making process of consumers and finally, it describes the best practices according to previous studies conducted by professional researches.
The second and third chapters describe the research questions, the objective of the paper and the methodology used to analyse online review management in Switzerland. The latter includes the explanation of the analysis grids and the variables on which the analysis was based on.
The results of the analysis are presented in the fourth chapter. The structure of the results is presented according to the six variables. Finally, in the last chapter explanation of the results and recommendations are discussed.
3
1.
L
ITERATURE REVIEW
The development of digital devices has led to a changing behaviour of consumers. People, now, have a multitude of ways to get information about the products and services they want to purchase. They look into a variety of sources, one of which is the experience of fellow travellers, which is very important in the decision-making process (Werthner & Klein, 1999). To get the most valuable stay, potential guests will first look for previous customers’ feedbacks before choosing a hotel. Thanks to the electronic Word of Mouth, the information has become more transparent, therefore, it is important for hoteliers to change their marketing strategy, as traditional marketing is not as powerful as before (Buhalis & Mamalakis, 2015).
This chapter is divided into five parts. It explains the changing behaviour of consumers, the increasing importance of user-generated-content websites, their impact on users, the disadvantages of review websites and how hoteliers should manage their online reputation. At the end of this first section, the reader will understand the importance of online review websites in the consumers’ side and on hoteliers’ side.
1.1.
T
HE CHANGING BEHAVIOUR OF CONSUMERSTourism services are intangible and cannot be tested before purchase. Therefore, it is important for consumers to have the maximum of information before making a decision. To reduce this purchasing risk, users search in a variety of sources. Consequently, the Web has become the most effective source of information (Werthner & Klein, 1999). In the past, going online was something that people occasionally did, it was used in a different way to achieve a task that was previously done in another way. Now, the World Wide Web is offering many more opportunities and benefits for users that were not available before (Ofcom, 2015).
Nowadays, advice from consumers who have already tested the specific products, are the most influential and preferred sources when making a decision before travelling (Crotts, 1999). Figure 1 illustrates the trust from guests to users. Indeed, according to a study made on Blablacar (Mastroianni, 2016), 89% of the people surveyed tended to have more confidence in people they had never met, than their neighbours or co-workers, as long as their online profiles are completed with specific details (pictures, phone numbers, comments from previous travellers). This percentage is similar to the confidence given to family and friends.
4 As we can see, social media has an important impact on travel planning and the decision-making process, it is not “just” considered as an additional source of information for those who use them (Fotis, 2015).
Besides, the consumer behaviour is also changing, consumers are more informed, more independent and more individualistic (Poon, 1993). Their lifestyle is changing as well, people travel more but for shorter periods of time (Saul, 2016). However, what is contradictory is that they are looking to have luxury travel experiences but meanwhile wanting the cheapest hotel rate (Gretzel, 2006).
Now, with the increasing importance of social media, electronic Word of Mouth reviews are a major influence on the decision-making process (Blal & Sturman, 2014): 52% of travellers changed their initial plans based on social media posts and 87% of travellers use the Internet to plan an upcoming trip (Vardi, 2014). However, with the amount of information available on these platforms, it is more and more difficult for users to target the necessary information that fulfil their specific needs (Fotis, 2015).
Figure 1 Circle of trust
5 The interactions with travellers has become an essential strategy in the tourism industry (Lenoir, 2016). According to a study made in SAS Institute and the Pennsylvania State University (McGuire, 2013), online reviews have the biggest influence on users in evaluating a hotel’s quality. Now, businesses have to understand consumer-buying behaviours, because it will help them to achieve a good strategy for pricing and positioning. The presence of user-generated content has shifted the environment from a price-transparency to a value-transparency. Consumers are no longer focusing on prices to determinate the quality, but on the value of the services and products offered as a whole (Grier, 2016).
Reviews are a source of information that contribute to the effective management of the entire tourism industry and the competitive advantage of each business (Phillips, Zigan, Santos Silva, & Schegg, 2015). By listening and taking into account comments made by guests, businesses can improve on performance and grow more effectively. Moreover, it encourages consumers to come back thanks to hotels’ attention to details from its reviews, which will only raise the profile of the company and might boost consumers to spend more. Indeed, if a hotel understands what their guests wants and needs are based on the feedback, they can personalized the experience and service for the guest, which will increase the chances for the consumers to spend more from the beginning of the booking process to their last day in the hotel (Saul, 2016).
Personalization will be a key factor in marketing for the future. Indeed, personalized content is a good strategy because it is based on customers’ interests and motivation. Thus, when hoteliers are able to achieve a clear target down at an individual level, success is ensured. According to Chris Regalado, to reach your target audience, the demographics and psychographics of clients must be understood (Leonardo, 2016).
As hotel marketers, we all know the basic profile of our customers through standard demographic information. Demographics tell us where guests come from, their gender, age, location etc., but they don’t really tell us who they are. That’s where Psychographics come in. By studying things like purchasing and browsing habits, lifestyle, spending habits, hobbies and values, psychographics can help us uncover why a buyer makes a purchase.
6 This allows us to create more personalized and targeted content for them. (Chris Regalado, 2016)
1.2.
I
MPACT OF SOCIAL MEDIAIn the tourism industry, the percentage of users buying products or services online is higher than any other indutry. Studies show that, 79% of people buy their flights online, 64% make hotel bookings online and 62% of this is related to business tourism. Moreover, in 80% of the cases, a Google search leads to an online purchase. The development of new technologies made a fundamental change in the way clients are consuming goods and services (bookings, online reviews, last minutes, low cost, etc.). Consequently, their expectations are higher and they have became more demanding (UNAT, 2014).
With the development of Web 2.0 and social media, society has changed the way they communicate. The Internet has reinforced the relationship between businesses and its consumers with a variety of online channels that contribute to the interactions and transactions between them (Fotis, 2015). To give you an idea, every twenty minutes on Facebook, the leading social media platform, one million links are shared, two million people send friends requests and three million messages are sent (Statistic Brain Research Institute, 2016). As you can imagine, a lot of information is being exchanged.
Web 2.0 not only has dramatically changed the traditional mass media communication, but also the relationship between consumers, in the way they communicate and collaborate with each other (Fotis, 2015). Furthermore, it has brought Word of Mouth, which is the most valuable form of marketing, online (Whitler, 2014). Thanks to the information shared electronically, people changed their ways of searching for products and services (Cantallops & Salvi, 2014). Indeed, user-generated-content websites, are one form of electronic Word of Mouth that has a big impact on how consumers obtain information, evaluate and make decisions on products and services relating to tourism (Sparks, Fung So, & Bradley, 2015). Knowing that each month there are 350 million different visitors on TripAdvisor, that every minute 255 new reviews are posted covering 6.6 million businesses, including one million hotels, Bed&Breakfasts and specialty lodging (TripAdvisor, 2016). Keeping track of all of these reviews has become a great challenge for the hospitality industry.
7
1.3.
H
OW IMPORTANT ARE REVIEWS IN THE DECISION-
MAKING PROCESS OFCONSUMERS
?
As we have been discussing, the factor that most influences consumers today when selecting a hotel, is previous guest experiences. It helps to influence booking decisions, it reduces uncertainty and it gives an impression to potential consumers about how their stay will be once they arrive (Sigmund & Fritsch, 2013). Even if they will not book their travel online, most consumers will at least have a look at review websites before making a decision. According to a survey, accommodation (68%) is the sector where consumers pay most attention to reviews, then restaurants (61%), cinemas (23%) and sports clubs (22%). With the development of mobile devices, potential customers can access the Internet whenever they wish, which enhances the importance of online reviews for travel decisions. Besides, users are more likely to trust experiences shared by other travellers than official marketing advertisements from businesses or experts, because what clients write is objective (Saul, 2016).
Figure 2 How do you use customer review websites?
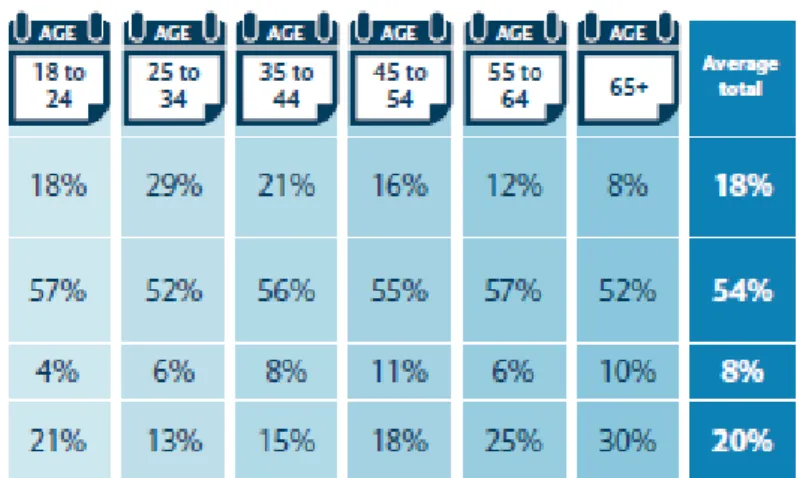
Online reviews are a precious source of information to help consumers evaluate and make a decision about their leisure travels. Furthermore, they are having a considerable impact on consumer behaviour, especially amongst younger people (Saul, 2016). Indeed, more than 25% of 18 to 24 year olds, consider online reviews as one of the three most influencing factors when deciding where to stay, compared to 18% of 65 year olds and over (Fox). Figure 2 shows
8 very clearly how people are using customer review websites and the importance of the feedback in the decision-making process of users. The importance of customer feedback will increase as they are having a considerable impact on consumer behaviour, especially amongst younger generations as they are having a greater spending power.
More and more people are likely to leave a feedback than before, the main reason is that they know how important and influential reviews can be for other customers. Furthermore, it increases the volume and the quality of online reviews (Saul, 2016). According to a study made at ITB Berlin, around 96% of internet users consider reviews websites as “important”, “very important” or “essential”. Half of the surveyed people see customer reviews websites as “important, but they should be handled with care”. 90% use customer review websites “always” or “often” to help them in making their booking decisions and only 1% consider them to be “non-credible” (Conrady, 2014).
1.4.
D
ISADVANTAGES OF ONLINE REVIEW WEBSITESOnline reviews can make or break the reputation of a hotel. If online review websites can boost hotels, it can also have a negative effect on them (Wilson, 2010). Misusing or abusing, both from the owner and guests, to increase or decrease the score of the business online or to ask for a discount, are also frequent. Most online review websites have taken measures to avoid this type of behaviour, but it is still an actual issue for hoteliers. To effectively manage such abuse from guests, a professional and balanced response is the best solution. Besides, to denigrate a hotel, the opinion of the client has to be quite strong, this can be especially serious for small businesses. Hoteliers need to ask themselves, whether the comments are fair and truthful, before taking action (Ross, 2014).
Fake reviews are also a major issue that should not be avoided, they represent between 1% and 16% of all guest reviews. Additionally, there is also the possibility for a business to encounter a fake-reviewer group (people who work collaboratively to write fake reviews). This practice can be even more damaging as it has the possibility of taking a total control of the reputation of the business (Mukherjee, Liu, & Glance, 2012) .It is an actual issue to recognise whether a comment is fake because there are no common standards to qualify them as false. According to the UK Competition and Markets Authority, there are two types of fake reviews
9 being written: the first is describing false and/or negative comments and the other makes false or positive comments (Valant, 2015).
Fake consumer reviews are one of the factors that distort the market the most in the e-commerce industry. One of the benefits of online reviews is to boost competition between businesses regarding their products and services, which are evaluated by customers who point out their strenghts and weaknesses. Therefore, if online reviews are not reliable anymore, it can lower the competition within the market because businesses that have a lot of presence and a good online reputation would be the only trusted ones (Valant, 2015).
Consumers’ reviews are important as a comparison tool, which influence a consumer’s choice about a product or service. Therefore, these tools, with the aim of increasing customer awareness and trust, should not mislead consumers with fake reviews. As more and more people are buying online, it is not an issue to underestimate. Fortunately, guidelines have already been adopted worldwide (Valant, 2015).
1.5.
O
NLINE REPUTATION MANAGEMENT BY HOTELIERSSocial media is one of the most popular and favoured ways for online users to spend their time. It enables them to stay in contact with friends and families and remain informed about other contents. At this time, there are more than 1.6 billion social network users in the world; with 64% of Internet users who have access to social media (Statista, s.d.). In addition, 50% of travel companies have generated bookings through social media (Vardi, 2014).
Thanks to the valuable data that online reviews provide, businesses can identify gaps in their service and take action to better meet the needs of their guests (Mayer, 2015). However, according to a study, 63% hoteliers deal with a review in the moment and do not keep a record of feedback for each specific consumers. It is six to seven times more expensive to acquire a new customer than it is to keep a current one (Help Scout, s.d.). Therefore, it is important for hoteliers to have a good Customer Relationship Management system in order to know the needs and expectations of their guests. Businesses that do not take into consideration online reviews are missing opportunities to develop themselves, personalize their offers and stay at the head of the competition (Saul, 2016). That being said, only 32% of business owners are managing their online status (Gonzalo, 2015). There are tools such as TrustYou that can help
10 monitoring social media and track what guests are saying about a specific company in the Web, which save a lot of time! (Horster, 2012, p. 219)
TrustYou
TrustYou is a tool to manage reviews on platform such as Booking.com or TripAdvisor. It is an online reputation management system for hotels, destinations and travel websites to improve travel experience. It analyses travel reviews and transforms this information into data visualization. It offers different products (TrustYou, s.d.):
TrustYou Meta-Review summarizes review content
TrustYou Messaging: A platform that allows hoteliers to communicate with their guests during their stay
TrustYou Stars: A platform that gives insights to hoteliers regarding the post-stay feedback of customers and are visible to other travellers as well
TrustYou Analytics & Radar analyses all guest feedback across the web to give an insight to hoteliers
Booking.com and TripAdvisor
Booking.com B.V. is part of The Priceline Group which is the world’s leading provider of online travel. Booking B.V. owns and manage Booking.com TM, which is the world leader of
booking online accommodation. Each day more than 1,200,000 room nights are reserved on the website. Since the beginning of 2014, hoteliers are allowed to answer to comments (Booking.com, s.d.).
TripAdvisor is the world largest review site. Each month 350 millions users visit the website and has 385 million reviews and opinion about 6.6 million accommodation, restaurants and attractions (TripAdvisor Inc, 2016).
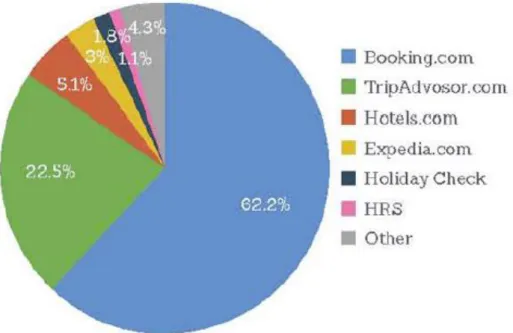
11 In regard to TripAdvisor and Booking.com they are the most important customer review sites (Conrady, 2014). Figure 3 represents the proportion of comment from Booking.com and TripAdvisor. About 62% of comments come from Booking.com and TripAdvisor globally. Figure 4 shows the use of customer review websites in Europe. Booking.com and TripAdvisor represent a bit less than 85% (TendenceHotellerie, 2015).
Figure 3 Global Review Distribution by site
Source: Tendence Hotellerie (2015)
Figure 4 Use of customer review websites in Europe
12
Recommendations
Hoteliers should use more user-generated content by (Murphy, 2015): Encouraging guests to write online feedbacks
Responding to online feedback in an appropriate and professional manner Taking action according to clients’ reviews
Getting familiar to major review websites such as TripAdvisor Learning how to get the most value out of user-generated content
What is also important is the rapidness of the answer. Business owners need to respond effectively (Lynn & Riaz, 2015). The faster, the better, since the longer hoteliers wait to respond, the more users are only seeing one side of the feedback (Gonzalo, 2015). Thus, what is essential to think about, is to prioritize positive reviews at the top, 70% of users read up to twenty reviews per hotel (Conrady, 2014). So, potential users will pay more attention to the first few comments because they are considered as the most reliable ones as there are the most recent (Gonzalo, 2014). Besides, when guests have to decide between two hotels, generally the hotel that has more of an online presence will be chosen (Sigmund & Fritsch, 2013).
Online reputation management is now an important tool in the marketing strategy to know the performance of customer service, public relations, sales and even recruitments (Gonzalo, 2015). Therefore, hoteliers should not hesitate to invest in the different social media platforms for their online advertising. Electronic Word of Mouth is a strong marketing tool and must not be underestimated (Buhalis & Mamalakis, 2015). 86% of people between the age of 18 and 34 years old consider that user-generated content is generally a good indicator of the quality of a product or service (Price, 2016).
The Pennsylvania State University and the SAS Institute found that the most influential factor on consumers when evaluating hotel’s quality is online reviews. Prices are not considered a valuable variable in a hotel’s evaluation of quality. Now, to have a good reputation, focusing on the problems raised in online reviews is the key to the growth of the hotel, reducing prices is no longer a sign of improvement in the eyes of consumers (Vardi, 2014).
13 Figure 5 shows the top 10 factors that hoteliers consider important for their business. Online presence remains important and is still the biggest area of investment for accommodation owners in 2016, with 59% investing more in this area than they did in 2015 (TripAdvisor, 2016).
Online reviews is also a good tool for hoteliers to benchmark themselves and to determine which department they want to improve in comparison to their competitors. It is also a good source of information for managers to know where guests are satisfied and where the hotel needs improvement or support to ensure that guests’ expectations are satisfied. For example, if a manager notices that three-star hotels need improvement in their service, thanks to clients’ feedbacks, it can offer an opportunity to train their employees, which will lead to a positive impact on key points that are being seen as most negative by most consumers (Mayer, 2015).
Many studies have been conducted to analyse the impact of online reviews on hotel performance. According to a study made at Cornell University (Anderson & Han, 2016), review scores and the number of reviews are positively related to a hotel’s performance (price, occupancy, and total revenue). Therefore, hoteliers should encourage clients to write online feedbacks. The same study demonstrated that not only boosting clients to post reviews is positively related to an increase in the scores of those reviews, but also these reviews are generally better than those posted without encouragement. Moreover, hotels have also
Figure 5 Online reviews and retaining customers are key for business owners
14 noticed improvements in their Average Daily Rate, occupancy and their Revenue per Available Room (RevPAR). However, according to the Ecole Hotelier Lausanne, more reviews do not necessarily have an impact on the RevPAR. Indeed, for economy and midscale hotels, higher the number of reviews the better. But for upscale and luxury ones, the quality of the review has a bigger impact on hotel performance, than the number. Furthermore, Anderson and Han (2016) affirm that not all reviews should be answered. Indeed, if hoteliers respond to more than 40%, the revenue starts to decrease. Thus, hoteliers are better off responding to negative reviews than to positive ones, as it may become unfavourable for them.
Besides, consumers appreciate more when hotels answer to negative comments, instead of acknowledging positive ones. Letting clients know, that they are important for the hotel improves the volume and the quality of reviews, and furthermore, when they have the feeling to be listened, it has a favourable effect on review scores and revenue (Anderson & Han, 2016). Did you know that 70% of buying experiences are based on how the customer feels they are being treated? (Help Scout, s.d.). Moreover, according to Anderson (2012), if a hotel increases its review score by one point on a five-point scale (e.g. from 3.3 to 4.3) or if the hotel has a higher reputation than its competitor with the same price, the hotel can increase its price by 11.2% and still maintain the same occupancy or market share. So, on TripAdvisor, Yelp or Booking.com, hoteliers should favour all reviews that have from one to three (one to six for Booking.com) stars and letting apart the four- and five- star reviews, depending on the content and context. On online travel agencies sites, it is less important as management responses are not published and, therefore, have less visibility (Gonzalo, 2015).
Review management in Switzerland
Over 11,000 hotels in 48 cities in Europe, the Middle East, Africa and India have been analysed by PwC (PricewaterhouseCoopers), an audit and advisory company.
In Geneva, guests gave hotels an average Global Review Index (a score reflecting a hotel’s overall online reputation) score of 79% and for three-star hotels 76% (which corresponds to 48% of the total number of hotels in Geneva). According to online reviews, location and cleanliness are rated the best. However, value and the quality of the room had the lowest rates. Guests tend to expect more for their money, when they pay for more stars. Regarding the average responses, 14% of hotel managers responded, which is 50% more compared to
15 2014, with a growth of 122% for three-star hotels. Nevertheless, four-star hotels answer more frequently (10,8%) than three-stars (7,0%). Regarding the proportion of positive reviews answered versus negative ones, positive answers had slightly more responses (Mayer, 2015). In Zurich, hotels have a Global Review Index score of 82%, which is higher than most other cities in Western and Central Europe. Three-star hotels (which correspond to 54% of the total number of hotels in the city) were rated at 80%. Regarding the online reputation, they have the same features as hotels in Geneva. The answer rate for the city is on average 21%, which is more than a half compared to 2014. Four-star hotels answer more frequently (28,1%) than three-star hotels (15,6%). The proportion of positive versus negative reviews answered is about the same (Mayer, 2015).
16
2.
R
ESEARCH QUESTIONS
The aim of this research is to know whether hotels take into account reviews and whether they answer to all comments or only a special type. Therefore, the main objective of this paper is to have a deeper understanding of how online reviews are managed in Switzerland. To reach this objective, it is necessary to answer the following research questions:
1. Do hoteliers respond to customer feedback on online evaluation platforms such as TripAdvisor and Booking.com?
2. How do hoteliers answer online reviews?
3. To which type of comments do hotels answer comments?
4. How do hotels manage the pressure of negative reviews from clients?
5. Are hotels that answer to customer reviews better rated than hotels that do not answer to any comments?
17
3.
M
ETHODOLOGY
In this chapter the method used to reach the objective is explained. The author has analyzed both comments and answers of 150 hotels on Booking.com and on TripAdvisor. For each hotel the 10 most recent comments answered have been analysed. For those who had less than 10 comments, the analysis has included comments answered from 1st of January
2013 until the 15th of October 2016.
For that matter, two analysis grids have been created. The first one is the detailed grid, which examines with different parameters each comment and their answer individually for each hotel. The second one is the master grid, where all the results from the detailed grid are reported.
3.1.
D
ETAILED GRIDIt has the purpose of analysing each hotel’s answers individually per review website. In this table different parameters are calculated: The customer comment content, the quality of answer, the speed of answer and the length of answer (Appendix I). The description of each parameters is explained later on this paper.
3.2.
M
ASTER GRIDAll information from the detailed grid are reported in the master grid. In addition, the rate of answer and the number of positive and negative comments each hotel has answered, are calculated as well (Appendix III).
At the end of this analysis, the following parameters are calculated: Positive or negative comments
Customer comment content Rate of answer
Quality of answer Speed of answer Length of answer
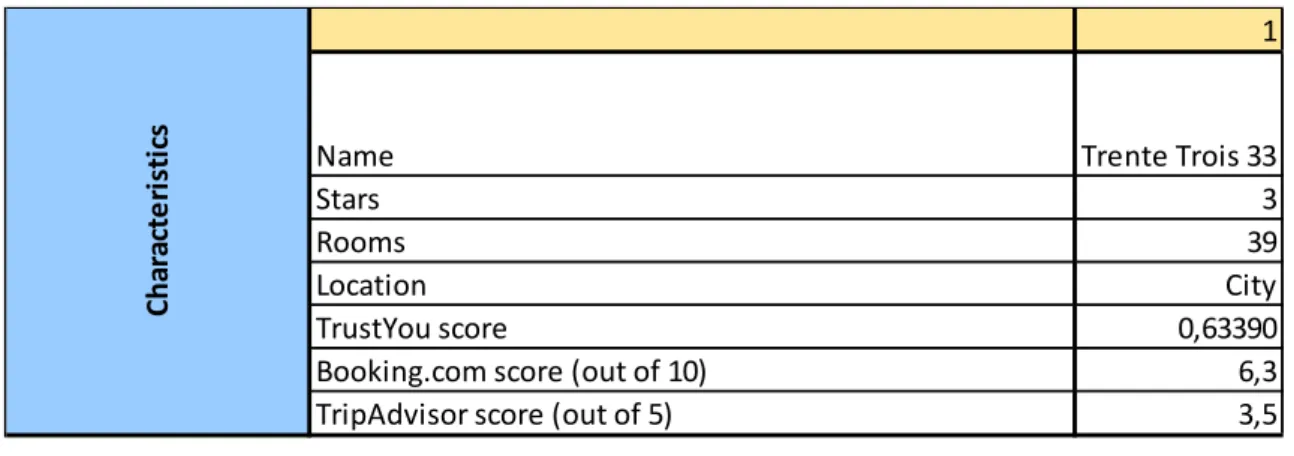
18 The master grid is then downloaded in Sphinx (software for survey and data analysis) in order to analyse the parameters and find any correlation with the TrustYou score. Table 1, 2 and 3 shows a part of the master grid, respectively the part for Booking.com. Appendix III shows the master grid with the TripAdvisor’s table included.
1
Name Trente Trois 33
Stars 3
Rooms 39
Location City
TrustYou score 0,63390
Booking.com score (out of 10) 6,3
TripAdvisor score (out of 5) 3,5
Ch ar ac te ri st ic s
Table 1 Master grid’s characteristics
19
Table 2 Master grid Booking.com Part 1
Source: Data collected by the author (2016)
Nb of customers' comments since 2013 1720
Nb of hotel's answers since 2013 207
Rate of answers 0,120348837
Positive Comments 3
Negative Comments 7
Bar and Beverages 0
Bar and Beverages / Nb of comments replied
Breakfast 0
Breakfast/ Nb of comments replied
Cleanliness 0
Cleanliness / Nb of comments replied
Entrance Area 0
Entrance Area / Nb of comments replied
Food 0
Food / Nb of comments replied
Hotel Building -3
Hotel Building / Nb of comments replied -0,3
Hotel 0
Hotel / Nb of comments replied
Location 4
Location / Nb of comments replied 0,4
Restaurant 0
Restaurant / Nb of comments replied
Noise -1
Noise / Nb of comments replied -0,1
Price -2
Price / Nb of comments replied -0,2
Room -1
Room / Nb of comments replied -0,1
Service included 2
Service included / Nb of comments replied 0,2
Staff service 0
Staff service / Nb of comments replied
Value -1
Value / Nb of comments replied -0,1
Vibe 0
Vibe / Nb of comments replied
WiFi 0
WiFi / Nb of comments replied
Other 0
Other / Nb of comments replied
Total comment's content -0,2
Total comment's content / comment replied
R at e o f an sw e r C u st o m e r co n te n t co m m e n ts B o o ki n g.c o m P o si ti ve vs N eg ati ve Co mme n t
20
3.3.
P
ARAMETERSPositive versus negative comments
Each comment that received an answer was judged whether it was positive or negative. Table 4 shows the scale to judge whether a comment was positive or negative depending on the review website.
Table 4 Scale for positive and negative comments
Booking.com score TripAvisor score
Positive Comments 7-10 4-5
Negative Comments 1-6 1-3
Tone of the answer 2
Focus of the answer 6
Language 10
Name of client 0
Thanked 2
Rewarded 0
Wished 0
Signature from the hotel 8
Questioning 0
Mistake 6
Quality score total 34
Quality score / answers analysed 3,4
Length 4199
Length/ answers analysed 419,9
Has the hotel answered within 3 days? Has the hotel answered within 7 days? Has the hotel answered within 28 days?
Speed / comments analysed
Q u al it y o f an sw e r Sp e e d B o o ki n g.c o m Le n gt h
Table 3 Master grid Booking.com Part 2
Source: Data collected by the author (2016)
21 According Mr. Gonzalo, a negative comment on TripAdvisor corresponds to a mark between one to three and on Booking.com it relates to a mark from one to six (Gonzalo, 2015). Therefore, the judgement of each comment was based on this theory.
At the end the proportion of positive and negative comments is calculated. The result will tell whether hotels tend to answer more to positive comments or tend to answer more to negative comments. The total comments analysed on Booking.com is 600 and on TripAdvisor is 462.
Customer comment content
This parameter includes 18 sectors that relate to all services and products put at disposal for clients that are criticised by guests after their stay.
Sectors:
Bar and Beverages Breakfast Cleanliness Entrance Area Food Hotel Building1 Hotel 2 Location Restaurant Noise Price Room
Service included in the price3
Staff service4 Value Vibe5 WiFi Other6
1 Hotel Building is corresponding to the appearance
of the building and its style.
2 Hotel characteristics relates to the hotel as a
whole. For example, when the client says: “The hotel is good.”
3 This criterion corresponds to all services that the
client gets free in addition of what he or she paid such as welcome drink, free transport part, minibar, etc.
4 Staff service relates to the service quality of
employees
5 It corresponds to the atmosphere in the hotel
whether the overall service of the hotel enhance a good feeling.
6 It includes remarks related to the storage room,
the schedule of the reception, the parking, the conference rooms and whether the hotel was adapted for kids.
22 At the end, the parameter gives three different results. The first one shows the most sensible sectors according to customers. The second result gives the sectors that have been the most positively criticised by guests. The third one gives the most negatively criticised sectors.
Each sector that came out in the comment was marked with one point if the comments was positively criticised or minus one if the comment was negatively criticised. If the sector was not mentioned in the comment, 0 point was given.
The total for each sector has been calculated per hotel. As some hotels had answered less than 10 times during the period analysed, the total of each sector has been divided by the number of comments analysed per hotel.
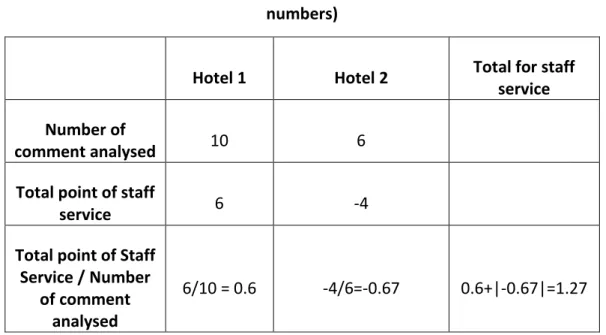
Table 5 shows an example of how the most sensible sectors have been calculated with the example of staff service.
Table 5 Example of calculation for the most sensible sectors for guests (not actual numbers)
Hotel 1 Hotel 2 Total for staff
service Number of
comment analysed 10 6
Total point of staff
service 6 -4
Total point of Staff Service / Number
of comment analysed
6/10 = 0.6 -4/6=-0.67 0.6+|-0.67|=1.27
23 Table 6 shows how the most positively and the most negatively criticised sectors have been calculated with staff service and location. In this example, the most positively criticised sector by guest is location (1.47) and the most negatively criticised sector is staff service (-0.53).
Table 6 Example of how the most positively and negatively criticised sectors have been calculated (not actual numbers)
Rate of answer
The rate of answer is the percentage of answers made by the hotel. It relates to the number of comments answered by the hotel compared to the total number of comments. It is calculated by dividing the number of comments answered by the number of comments from the 1st of January 2013 until the 15th of October 2016.
The minimum is 0% and the maximum is 100%. Out of the 150 hotels analysed, six hotels could not be found on Booking.com and three hotels on TripAdvisor. Therefore, to analyse the rate of answer for each review websites, the total for Booking.com is 144 and for TripAdvisor is 147.
Hotel 1 Hotel 2 Hotel 3
Total positively criticised Total negatively criticised Number of comment analysed 10 10 6 16 Total point of staff service 6 -2 -2 Average staff service 6/10=0.6 -2/10=-0.2 -2/6=-0.33 0.6 -0.2+(-0.53)=-0.53 Total point of Location -4 8 4 Average Location -4/10=-0.4 8/10=0.8 4/6=0.67 0.8+0.67=1.47 -0.4
24 The rate of answer of each hotel has been compared with the TrustYou score of each hotel on Sphinx in order to see whether there was a correlation between the two parameters.
Quality of answer
It determines the quality of the answer. It contains 10 criteria (C.f. Table 7) that have either zero point or one point each. Therefore, the minimum point an answer can have is zero and the maximum is 10. Each criteria is related to a closed-ended question worth zero or one point each. As some hotels had answered less than 10 times during the period analysed, the total has been divided by the number of comments answered for each hotel. The total gives the average quality score for the hotel.
On Booking.com out of the 144 hotels, 72 hotels have answered to comments. To analyse the average quality of answer for each hotel, the total is 72. On TripAdvisor, out of the 144 hotels analysed 60 hotels have answered to comments. To analyse the average quality of answer for each hotel on TripAdvisor, the total is 60.
The average quality of answer of each hotel has been compared with the TrustYou score of each hotel on Sphinx in order to see whether there was a correlation between the two parameters.
25
Table 7 Criteria to analyse quality of answer
Criteria Question/Affirmation Comment
Tone of the answer
Was the answer friendly? It characterizes whether the answer is friendly or unfriendly. If it is judged friendly, it is worth one point. If the answer to the question is no, it is worth 0 point.
Three people have been asked to judge the tone of the answer to have an objective result (Appendix II). Focus of the
answer
At least one of the critical points from the customer is treated by the answer.
Yes: 1 point No: 0 point Language Has the hotel answered in the
same language as the comment?
Yes: 1 point No: 0 point Name of client Has the hotel mentioned the
name of the client?
Yes: 1 point No: 0 point Thanking Has the hotel thanked the
client to have written a comment?
Yes: 1 point No: 0 point Rewarding Has the hotel offered a reward
for the next stay?
Yes: 1 point No: 0 point Wishing Has the hotel wished to see the
client soon?
Yes: 1 point No: 0 point Signature of the
hotel
Has the hotel signed, either the name of the hotel or written the staff team?
Yes: 1 point No: 0 point Questioning Is the hotel questioning itself? Yes: 1 point
No: 0 point
Three people have been asked to judge whether the hotel is questioning itself, to have an objective result (Appendix II).
Mistakes The hotel did not do any mistake in the answer.
Yes: 1 point No: 0 point Source: Data collected by the author (2016)
26
Length of answer
It is the number of characters (without space) that the answer contains. The total of characters is divided by the number of answers analysed, so that the result gives an average and does not depend on the number of answers.
On Booking.com out of the 144 hotels, 72 hotels have answered to comments. To analyse the average length of each answer for each hotel, the total is 72. On TripAdvisor, out of the 144 hotels analysed 60 hotels have answered to comments. To analyse the average length of answer for each hotel on TripAdvisor, the total is 60.
The average length of answer of each hotel has been compared with the TrustYou score of each hotel on Sphinx in order to see whether there was a correlation between the two parameters.
Speed of answer
It determines whether the hotel has answered quickly or not. In order to calculate it, three criteria have been settled:
1. The hotel has answered within 3 days. It corresponds to a fast answer.
2. The hotel has answered within 7 days. It corresponds to the average period of answer.
3. The hotel has answered within 28 days. It corresponds to a slow answer.
The author has decided the number of days that are related to a fast, average or slow answer. Each affirmation is worth one point. The minimum point an answer can have is zero point and the maximum is three points. This variable has been calculated only for TripAdvisor, as on Booking.com the date of the answer was not visible.
27 Table 8 demonstrates an example of how the average speed of answer has been calculated.
Table 8 Example of average speed of answer (not actual numbers)
Hotel 1 Scale Answer 1 Answer 2 Total
Has the hotel answered within 3 days? Yes: 1 No: 0 0 1 1
Has the hotel answered within 7 days? Yes: 1 No: 0 1 1 2
Has the hotel answered within 28 days? Yes: 1 No: 0 1 1 2
Average (Total/ nb of hotel answers) 5/2=2.5
On TripAdvisor, out of the 144 hotels analysed 60 hotels have answered to comments. To analyse the average Speed of Answer for each hotel on TripAdvisor, the total is 60.
The average speed of answer of each hotel has been compared with the TrustYou score of each hotel on Sphinx in order to see whether there was a correlation between the two parameters.
3.4.
T
RUSTY
OUS
CORE3.4.1.
W
HAT IS IT?
It is a score based on all opinions found on the Internet. To calculate it, TrustYou takes into consideration all information on the social web made about a specific hotel. It includes reviews, comments, surveys, and tweets about a hotel. Thanks to smart technological tools, Trustyou determines a complete picture of global consumer opinion of a hotel. The TrustScore is a number between zero and 100. A low Trustscore relates to a less trustworthy offer wherease a high TrustScore indicates that the guest can trust the hotel or the brand (TrustYou, 2012). The most recent reviews have a greater weighting than older ones as they are more relevant for readers (TrustPilot, 2016).
28
3.4.2.
P
ARAMETERS COMPARED WITH THET
RUSTS
COREIn this analysis some parameters have been analysed in relation to the TrustScore of each hotel. Those parameters are:
Rate of answer Quality of answer
Length of answer Speed of answer
3.5.
S
OURCE OF INFORMATIONValais Tourism Observatory provided a list of three- and four- star hotels located in Switzerland that includes the name of the hotels, their addresses and their TrustYou score in 2015. The dataset gives insights about the overall customer evaluation of each hotel (c.f. chapter 3.3). A sample of 150three- and four-star hotels (67 from cities, 38 from villages and 45 from mountain regions) including highly and badly rated hotels have been analysed on TripAdvisor and Booking.com (Appendix IV). In Switzerland, three- and four-star hotels count more beds and overnight stays than the other categories of hotels, that is why they are represented in this paper (Liechti, 2015).
In order to distinguish a hotel located in a city or a village, the definition of “Union des villes suisses” have been used. According to the latter, to differentiate a city from a village, the number of inhabitants is the key. A district of more than 10, 000 inhabitants is a city, less is considered as a village. It is based on this definition that the author could know whether a hotel is located in a city or a village (Union des villes suisses, 2014).
29
4.
R
ESULTS
4.1.
R
ESULT OF THE ANALYSIS4.1.1.
D
ISTRIBUTION OF THE TOTAL NUMBER OF HOTELS IN RELATION TO THEIRT
RUSTS
CORETable 9 highlights the distribution of hotels (it includes hotels that answered to comments and those who did not) in relation to the score they received on TrustYou. There are a total of 144 hotels for Booking.com and 147 hotels for TripAdvisor. The total number of hotel for each review websites has been used to calculate the rate of answer.
18 38 61 27 19 37 62 29 0 10 20 30 40 50 60 70
Less than 0,7 From 0,7 to 0,8 From 0,8 to 0,9 0,9 and more
N u m b er o f h o tels TrustScore
Table 9 Distribution of hotels analysed on Booking.com (blue) and on TripAdvisor (green)
30 Table 10 shows the proportion of hotels that only have answered to comments according to their score on TrustYou. There is a total of 72 hotels that have answered to comments on Booking.com and 60 hotels on TripAdvisor. Therefore, half of the hotels on Booking.com and 59% of the hotels on TripAdvisor have not responded to any comments. The quality of answer, the speed of answer and the length of answer have been calculated according to those numbers. 5 19 35 13 3 17 26 14 0 5 10 15 20 25 30 35 40
Less than 0,7 From 0,7 to 0,8 From 0,8 to 0,9 0,9 and more
N u m b er o f h o tels TrustScore
Table 10 Proportion of hotels on Booking.com (blue) and TripAdvisor that have answered (green)
31
4.1.2.
P
OSITIVE VERSUS NEGATIVE COMMENTSBooking.com
Table 11 shows the total number of positive comments versus the negative comments that received an answer from the hotel on Booking.com. Amongst the 72 hotels that have responded to reviews, there are 600 comments answered; of which 517 are positive and 83 are negative. Positive comments represent 86.17% whereas negative comments represent 13.83%.
86% 14%
Positive Comments Negative Comments
Table 11 Proportion of positive and negative comments on Booking.com
32
TripAdvisor
Table 12 shows the proportion of positive and negative feedbacks that received an answer from the hotel on TripAdvisor. Amongst the 60 hotels analysed, there are 462 comments answered; of which 373 are positive and 89 are negative. Positive comments represent 80.74% and negative comments 19.26%.
81% 19%
Positive Comment Negative Comment
Table 12 Proportion of positive and negative comments on TripAdvisor
33
4.1.3.
S
ENSIBLE SECTORS ACCORDING TO CUSTOMERSBooking.com
Table 13 The most sensible sectors according to customers on Booking.com
Table 13 shows the most sensible sectors clients have criticised (positively and negatively) amongst the comments analysed on Booking.com website. Rooms, the location of the hotel and the quality of staff service are what came out the most in clients’ reviews. However, clients are less demanding with the vibe, the entrance area and the bar and beverages in a hotel.
0 5 10 15 20 25 30
34
TripAdvisor
Table 14 The most sensible sectors according to customers on TripAdvisor
Table 14 shows the most sensible sectors for guests amongst the comments analysed on TripAdvisor website. The results are almost the same comparing to Booking.com. Location, staff service and room are still what clients criticised the most. The entrance area, the vibe and other are where clients are less sensible.
0 5 10 15 20 25 30 35
35
4.1.3.1.
T
HE MOST POSITIVELY CRITICISED SECTORSBooking.com
Table 15 shows the sectors that have been the most positively criticised by guests amongst the comments analysed on Booking.com. The breakfast, the quality of the staff service and the location are the sectors that have been the most positively criticised.
Table 15 The most positively criticised sectors from guests on Booking.com
0 5 10 15 20 25 30
36
TripAdvisor
Table 16 shows the sectors that have been the most positively criticised by guests amongst the comments analysed on TripAdvisor. The location of hotels, the rooms and the quality of the staff service are those that have been the most positively criticised.
Table 16 The most positively criticised sectors from guests on TripAdvisor
0 5 10 15 20 25 30 35
37
4.1.3.2.
T
HE MOST NEGATIVELY CRITICISED SECTORSBooking.com
Table 17 shows the sectors that have been the most negatively criticised by guests amongst the comments analysed on Booking.com. Price, noise and room are the sectors that have been the most negatively criticised. We can see that rooms come out more frequently on negative comments than the other sectors.
0 2 4 6 8 10 12
Table 17 The most negatively criticised sectors from guests on Booking.com
38
TripAdvisor
Table 18 shows the sectors that have been the most negatively criticised by guest amongst the comments analysed on TripAdvisor. Room, noise and price are the sectors that have been the most negatively criticised.
0 0,5 1 1,5 2 2,5 3 3,5 4
Table 18 The most negatively criticised sectors from guests on TripAdvisor
39
4.1.4.
R
ATE OF ANSWERBooking.com
Table 19 compares the rate of answer on Booking.com with the hotel score on TrustYou. We can observe that higher is the TrustScore, higher is the rate of answer. However, above 90% the rate of answer decreases.
0 0,02 0,04 0,06 0,08 0,1 0,12 0,14
Less than 0,7 From 0,7 to 0,8 From 0,8 to 0,9 0,9 and more
Rat e o f An swe r TrustScore
Table 19 Rate of answer on Booking.com
40
TripAdvisor
Table 20 shows the rate of answers on TripAdvisor versus their TrustYou score. We can see that higher is the TrustScore, higher is the rate of answer. This tendency is less marked for hotels with a score above 90%.
Table 20 Rate of answer on TripAdvisor
0 0,05 0,1 0,15 0,2 0,25
Less than 0,7 From 0,7 to 0,8 From 0,8 to 0,9 0,9 and more
Rat e o f An sw er TrustScore
41
4.1.5.
Q
UALITY OF ANSWERBooking.com
Table 21 shows the average quality of answer analysed on Booking.com compared with the hotel score on TrustYou. There is no clear correlation between the quality of answer and the TrustScore.
Source: Data collected by the author (2016)
0 1 2 3 4 5 6 7 8
Less than 0,7 From 0,7 to 0,8 From 0,8 to 0,9 0,9 and more
Av era ge Qu alit y o f An sw er TrustScore
42
TripAdvisor
Table 22 demonstrates the average quality of answer analysed on TripAdvisor compared with the hotel score on TrustYou. There is no clear correlation between the quality of answer and the TrustScore. However, we can notice that hotels that have a score below 70%, have a better quality of answer than hotels with a higher score.
6,4 6,5 6,6 6,7 6,8 6,9 7 7,1 7,2
Less than 0,7 From 0,7 to 0,8 From 0,8 to 0,9 0,9 and more
Av era ge Q u alit y o f An swe r TrustScore
Table 22 Quality of answer on TripAdvisor
43
4.1.6.
L
ENGTH OF ANSWERBooking.com
Table 23 shows the average length of answer on Booking.com compared with the TrustScore. There is no clear correlation between those two parameters.
Source: Data collected by the author (2016)
0 50 100 150 200 250 300 350 400
Less than 0,7 From 0,7 to 0,8 From 0,8 to 0,9 0,9 and more
Table 23 Length of answer on Booking.com
44
TripAdvisor
Table 24 shows the average length of answer on TripAdvisor compared with hotel scores on TrustYou. There is no clear correlation between those two parameters. However, once again, hotels that have a score below 70%, write longer answer than hotels with a higher score.
0 100 200 300 400 500 600 700
Less than 0,7 From 0,7 to 0,8 From 0,8 to 0,9 0,9 and more
Table 24 Length of answer on TripAdvisor
45
4.1.7.
S
PEED OF ANSWERTripAdvisor
Table 25 Speed of answer on TripAdvisor
On table 25 the average speed of answer from TripAdvisor is compared with the TrustYou score. There is a correlation between the two parameters. Hotels with a score below 70% and above 90% answer faster than hotels with a score between 70% and 90%.
1,77 1,78 1,79 1,8 1,81 1,82 1,83 1,84 1,85 1,86 1,87
Less than 0,7 From 0,7 to 0,8 From 0,8 to 0,9 0,9 and more
46
4.2.
I
NTERVIEWSThree hotel managers have been interviewed in order to have an insight of online reviews management practices. The first hotelier is Daniel Rousseau (human resources manager and quality coach of the hotel Beaulac**** in Neuchâtel), then Eric Fassbind (owner of “By Fassbind Hotels” chain) and the last but not least, Ariane Boesch (manager of the Hôtel des Arts*** in Neuchâtel).
Importance of review websites
Before going further, the first thing that the three interviewees pointed out is the difference between TripAdvisor and Booking.com. On TripAdvisor anybody can write a comment, even though the user has not been to the hotel. On Booking.com, the user has to stay in the hotel to be able to write a comment. Even if the client cancelled the room, she or he cannot write a comment on Booking.com. Therefore, on TripAdvisor comments have more probabilities to be fraudulent and not representative.
According to Mr. Rousseau (2016) from the hotel Beaulac, it is vital and a necessity for hoteliers to work with those review websites. Even though many rooms are booked through companies for business purpose, leisure travellers occupy the rooms left based on the comments they have read online. Those websites are essential since they are the most used tools to make reservations. Mr. Fassbind (2016) finds that it is a new way of receiving a maximum of different point of views. It gives also customers more information on their expectations once arrived at the destination.
Opportunities & constraints
There are several opportunities for hoteliers to be present on those websites. One is the visibility. Booking.com pays a lot to be the first on research pages on the Internet. For a small hotel such as the Hotel des Arts, it gives more visibility worldwide. Everybody who has access to the Internet can see the hotel online. Ever since more and more people consider those review websites in their decision-making process, Mrs. Boesch (2016) has increased her occupancy rate and her turnover by 10-15%. Besides, now that revenue management is used by most hoteliers, it gives them a powerful strategy to use online reputation at their advantage. Indeed, now reputation pricing has become the new trend for managers. It gives
47 graphical tools that help hoteliers visualise their market position in relation to their rate and reputation and setting new pricing opportunities (Grier, 2016).
However, all of this has a cost and commissions are no exception. 12% to 15% of commission on Booking.com on each reservation is something not to underestimate. There is also additional costs for hotels where competition is more present, to have a good place on Booking.com the commission double and without forgetting the possibility to pay to appear in the first page on Google. Moreover, according to Mrs. Boesch, hoteliers do not have as much power on prices as before. Indeed, according to an article published on L’Express of Neuchâtel (Gigon, 2016)., platforms such as Booking.com have a tariff clause that prevent hoteliers to offer cheaper prices to their clients, but this is going to change.
Mr. Rousseau has also experienced the fact that during the renovation of the hotel, it happened that they offer discount because of the noise pollution. However, few clients before having seen their room, were trying to negotiate rates, because they read a comment about the discount. Or simply, some were negotiating rates in exchange of a good comment online. According to Mr. Fassbind those practices were previously integrated in the customs of the hotel chain. Guest feedbacks were already taken into account. Therefore, it has not brought him any opportunities neither any constraints.
Comments management
How do you manage online comments?
The three managers interviewed take into consideration online comments. For Mr. Rousseau all comments are taken into account, not only guest comments (comments made in room directly thanks to a form) but also all online reviews (Booking.com, TripAdvisor, and other websites) and remarks made directly to employees. It gives him an insight of all complaints and helps him to find the source of the problem. Since all information is computerized and stored per client, he can anticipate problems. For example, a person that comes regularly at the hotel and was not happy with the cleanliness of the room last time she/he stayed, will allow to be more careful on this problem next time the client come. This can help making the difference with other competitors and showing to clients that they are important for the hotel.