BIOINFORMATICS
APPLICATIONS NOTE
Vol. 24 no. 18 2008, pages 2110–2111doi:10.1093/bioinformatics/btn363Systems biology
The protein information and property explorer: an easy-to-use,
rich-client web application for the management and functional
analysis of proteomic data
H. Ramos
1, P. Shannon
1,∗and R. Aebersold
1,2,31Institute for Systems Biology, 1441 North 34th Street, Seattle, WA 98103-8904, USA,2Institute of Molecular
Systems Biology and Competence Center for Systems Physiology and Metabolic Disease, ETH Zurich, Zurich, Switzerland and3Faculty of Science, University of Zurich, Zurich, Switzerland
Received on April 8, 2008; revised on June 13, 2008; accepted on July 14, 2008 Advance Access publication July 16, 2008
Associate Editor: Trey Ideker
ABSTRACT
Motivation: Mass spectrometry experiments in the field of proteomics produce lists containing tens to thousands of identified proteins. With the protein information and property explorer (PIPE), the biologist can acquire functional annotations for these proteins and explore the enrichment of the list, or fraction thereof, with respect to functional classes. These protein lists may be saved for access at a later time or different location. The PIPE is interoperable with the Firegoose and the Gaggle, permitting wide-ranging data exploration and analysis. The PIPE is a rich-client web application which uses AJAX capabilities provided by the Google Web Toolkit, and server-side data storage using Hibernate.
Availability: http://pipe.systemsbiology.net Contact: [email protected]
1 INTRODUCTION
After an MS/MS proteomics experiment has been completed and the results have been analyzed with a suite of software tools such as the Trans-Proteomic Pipeline (Keller et al., 2005), the end result is typically a list of protein identifiers (IPI, UniRef, UniProt, etc.) with varying degrees of certainty assigned to each protein on the list. The protein information and property explorer (PIPE) is a starting point for the next step in analysis of proteomic experimental results such as the functional annotation of the identified proteins and their association with biological processes. It is a launching pad from which simple operations can be performed on this data and messages can be passed to other, more sophisticated analysis software such as the Gaggle (Shannon et al., 2006). The PIPE currently supports Human, Mouse, Rat, Yeast protein identifiers; as well as a few other, less commonly studied organisms.
Though many of the PIPE’s features may be found separately in existing software, the power of the PIPE lies in bringing these features together under one system, offering them in web 2.0 fashion, and providing a higher degree of personalization and interactivity for the user. We highlight key differences between the PIPE and popular existing software below.
∗To whom correspondence should be addressed.
2 FEATURES
2.1 Mapping identifiers
Most biological annotation (GO and KEGG, for example) is provided in terms of Entrez Gene IDs. The first step in annotating proteins, therefore, is to map them to the genes from which they are transcribed and translated. The PIPE currently maps IPI, UniProt and NCBI protein identifiers to Entrez Gene IDs, gene symbols, descriptions, Gene Ontology (GO) terms and more. When new identifiers are returned, they become part of the working environment and can be selected for broadcasting or used for selecting a subset of the user’s data. This is in contrast to other ID mapping software like the Protein Information Resource (PIR) or MatchMiner which return a non-interactive flat text file.
2.2 Protein sequence lookup
Not all protein identifiers are mapped to genes by the standard bioinformatics authorities. For these cases, the PIPE provides easy point and click access to a protein’s sequence and submission to NCBI BLAST. Once the user has examined the blast results and determined which gene, if any, the protein is associated with, he/she may enter and save the new mapping in the PIPE; in contrast to UniProt or PIR, the PIPE can accept and preserve this assignment for future lookups on a per user basis.
2.3 GO enrichment
Functional annotation and the association of the identified proteins with biological processes are crucial to the analysis of proteomics data. This is often achieved by computing the enrichment of proteins in the identified set related to function or other ontology classes. The PIPE employs the Bioconductor R package ‘GOstats’ (Falcon and Gentleman, 2007), running on the backend server, to calculate the relative enrichment of sets of identified proteins in relation to the whole set of proteins with respect to biological process, molecular function and/or cellular component information. The PIPE generates a ‘Gaggled’ instance of Cytoscape (Shannon et al., 2003) to display an interactive, hierarchical graph of the enriched GO categories. This mode of presentation permits easy navigation of the usually complex GO annotation: significance thresholds
Protein information and property explorer
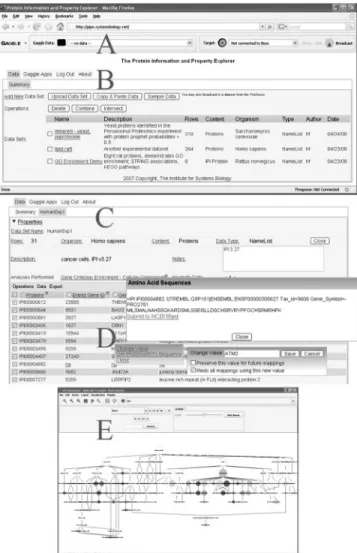
Fig. 1. (A) Through the Firegoose, the PIPE and the Gaggle interchange data at the click of the ‘Broadcast’ button. (B) Logging into the PIPE produces a view summarizing all previously entered datasets. (C) Opening a dataset produces a view of the data and a menu bar containing operations which can be performed on the data. Here, we have performed an ID Mapping operation from IPI numbers to Entrez Gene ID, gene symbol and description. (D) When no mapping is found for a protein identifier, clicking on the ‘na’ value gives the user the option to lookup the protein sequence or enter the missing value. (E) The results of a GO enrichment operation are presented in a Gaggled Cytoscape window (Shannon et al., 2003, 2006).
(from the hypergeometric distribution) may be set with a slider to hide less significant categories, functional context of categories may be explored, and proteins annotated to a particular category may broadcast back to the PIPE and saved as a selection. Despite their many merits, other GO annotation websites (i.e. DAVID, FatiGO) lack this combination of interactivity and persistence.
2.4 Communication with other software and websites
By interfacing with the Firegoose (Bare et al., 2007), the PIPE can access several valuable online bioinformatics resources as
well as different Java applications running on the user’s desktop. Web resources include DAVID, Kegg Pathways, Entrez Gene and EMBL String. The Firegoose Firefox browser plug-in plays the intermediary between the PIPE and other applications in the Gaggle. The PIPE is thus able to send and receive data from popular Gaggle enabled software applications such as Cytoscape, Data Matrix Viewer, MultiExperiment Viewer and the R statistical environment.
2.5 Data management and persistence
The PIPE allows lists of proteins to be imported through text file upload, direct copy and paste, or broadcasts from the Gaggle. These datasets can be combined or intersected, or new datasets can be created from their subsets. If the user elects to log in with a user account, these datasets will be preserved in the PIPE database for future access. The PIPE does all this through the convenience of a web browser, as where software like the Bioinformatics Resource Manager, which also does identifier mapping and Gaggle broadcasting, requires the user to install a client desktop application.
3 TECHNICAL DETAILS
The Google Web Toolkit (GWT) was employed to enable extensive Asynchronous JavaScript and XML (AJAX) in the application. This has the advantages over traditional web applications in that the user is not required to wait for page reloading because the MVC model runs entirely on the client browser, contacting the server only for specific data when required. The GWT allows the developer to code in Java and then compiles the code into JavaScript. The back end is hosted on a tomcat servlet container and uses Hibernate ORM technology and MySQL for data persistence. This application was developed and tested for the Firefox browser in conjunction with the Firegoose plug-in; however it may also be used with other popular web browsers like Internet Explorer, Safari and Opera without the added benefit of the Firegoose and the Gaggle. Cytoscape and the other Gaggle Applications require Java 1.5 or above.
ACKNOWLEDGEMENTS
Funding: National Heart, Lung and Blood Institute, National
Institutes of Health (N01-HV-28179 to R.A.).
Conflict of Interest: none declared.
REFERENCES
Bare,J. et al. (2007) The Firegoose: a two-way integration of diverse data from different bioinformatics web resources with desktop applications. BMC Bioinformatics, 8, 456.
Falcon,S. and Gentleman,R. (2007) Using GOstats to test gene lists for GO term association. Bioinformatics, 23, 257–258.
Keller,A. et al. (2005) A uniform proteomics MS/MS analysis platform utilizing open XML file formats. Mol. Syst. Biol., 1, 17.
Shannon,P. et al. (2003) Cytoscape: a software environment for integrated models of biomolecular interaction networks. Genome Res., 13, 2498–2504.
Shannon,P. et al. (2006) The Gaggle: an open-source software system for integrating bioinformatics software and data sources. BMC Bioinformatics, 7, 176.