Generations from Today
’
s Public Debts
§REINER EICHENBERGER,* DAVID STADELMANN**
University of Fribourg and CREMA – Center for Research in Economics, Management and the Arts
From the politico-economic perspective, federalism is a protector of the present generation. But what about future generations? In federal states, Ricardian equivalence cannot be assumed to work properly, as migration between local jurisdictions undermines intergenerational redistribution based on parental altruism. However, we argue that there exists another equivalence mechanism which also works with purely selfish individuals: Public debts capitalize into property values. Jurisdictions with larger net debts exhibit, ceteris paribus, lower property prices. Debt capitalization in property values is the more pronounced the less elastic land supply is and the more mobile the other factors of production are. Therefore, capitalization is more relevant for local than for national debts, i.e. it is more pronounced in a federal than in a centralized state. Thus, federalism also becomes a protector of future generations.
1. INTRODUCTION
From the politico-economic perspective, federalism is a protector of the current generation. It protects citizens from exploitation by establishing fiscal equivalence and competition between local governments, thus strengthening the incentives for politicians to cater to efficiency. But what about future
§ We are grateful to Geoffrey Brennan, Giuseppe Eusepi Bruno S. Frey, Michael Funk, Volker
Grossmann, Louis Imbeau, Fabio Padovano, Sigrid Röhrs, Mark Schelker, and Friedrich Schneider for illuminating discussions. We are also indebted to Bernard Dafflon for helpful comments on property management in Swiss communes, as well as the Zürcher Kantonalbank (Patrick Schellenbauer and Marco Salvi) for providing a house price dataset.
* University of Fribourg, Department of Economics, Bd. de Pérolles 90, 1700 Fribourg
(Switzerland), +41 (0)26 300 82 62, reiner.eichenberger@unifr.ch; CREMA - Center for Research in Economics, Management and the Arts.
** University of Fribourg, Department of Economics, Bd. de Pérolles 90, 1700 Fribourg
(Switzerland), +41 (0)26 300 82 63, david.stadelmann@unifr.ch; CREMA - Center for Research in Economics, Management and the Arts.
generations? If individuals are as selfish as is commonly assumed in economics, they are clearly interested in living at the expense of future generations by financing government spending by debts rather than by taxation. Of course, there is the well-known counterargument of Ricardian equivalence which states that the debt burden cannot be shifted to future generations as the present generation reacts to debt spending by increasing savings. However, the assumptions for Ricardian equivalence to hold are quite demanding. It starts from the presumption that the utility of future generations enters into the utility function of the present generation. While this is obviously true in a model with overlapping generations and parental altruism, it may not reflect reality. Many individuals have no descendants and, thus, no obvious reason to care about the debt burden of future generations. Moreover, migration may help to circumvent the repayment obligations for debts. It could therefore be argued that the debt burden can be shifted to future generations.
This argument is all the more convincing in a federal state where citizens can safely assume there being a good chance that their own kids will migrate to another jurisdiction, and that the debts of the jurisdiction where they presently live will have to be repaid by new inhabitants. Therefore, it could be argued that at the sub-national level fiscal responsibility gets blurred, which induces citizens and politicians to prefer debt over tax financing, thus making federalism an exploiter of future generations.
Fortunately, reality looks different: There is another mechanism that makes federalism not only a protector of the present, but also of future generations: the capitalization of jurisdictional assets and debts into property prices. In open economies such as small countries or local jurisdictions, the price of housing reflects individual preferences for packages of public services and tax prices. Capitalization occurs when, for given housing and demographic characteristics, the difference in local property values reflects differences in taxes and public services. As is well known, the quality of government services and the level of taxation indeed capitalize to a large extent.1 There is no reason why debts
should not also capitalize.
In fact, we are not the first to think about debt capitalization (see e.g. Eichenberger, 2007; Stadelmann and Eichenberger, 2008). Daly (1969) had already pinpointed it long ago. But capitalization of public debts has played no role in the literature since then and has only been rediscovered recently (see Banzhaf and Oates, 2008).
1 Among others, Oates (1969, 1973), Pollakowski (1973), Edel and Sclar (1974), Chinloy (1978),
Reinhard (1981), Yinger et al. (1988), Brasington (2002), and Reback (2005) consider the capitalization of taxes and/or public goods.
Note that our approach and Barro’s (1989) theory do not exclude each other but are complementary. For small jurisdictions, however, our approach relies on less demanding behavioral assumptions. Moreover, according to Barro empirical studies do not provide consistent support for his theory. He attributes this to identification problems and the simultaneity between consumption and income. In contrast, we argue that our approach suffers much less from these problems as endogeneity problems are usually less
pronounced when the dependent variables are housing prices.2
For a first test of our theory of debt capitalization in a federal state, we analyze the prices of standardized single family houses for the 171 communities of the Swiss Canton of Zurich. Swiss cantons form a particularly good fiscal laboratory for our purposes for at least four reasons: (1) each of them is a small federation of its own as Swiss municipalities have a high level of autonomy with respect to local income taxation and financing decisions; (2) all municipalities in Zurich use a common harmonized public accounting system for budgeting, bookkeeping with balance sheets, and reporting which facilitates comparisons of fiscal variables; (3) they have free access to capital markets; and (4) the Swiss federal court prohibits higher government levels from bailing out municipalities. Thus, Switzerland forms an ideal setting for identifying how public debts capitalize in a federal state.
Municipal real net funds as the difference between financial assets minus liabilities and municipal equity are commonly used indicators in government
publications.3 We show that municipal net funds and municipal equity
capitalize positively. Several specification tests for a number of different measures of communal wealth lead to the same conclusions. The effects found are not only statistically significant, but also economically highly relevant, thus bolstering the capitalization-based theory of equivalence of debt and tax financing for the local public sector. Most countries do help lower levels of government when they are in financial distress, but compared to other countries Switzerland has only a minor system of equalization grants. Our results are also robust when controlling for implicit bail-out through fiscal equalization by higher government levels. Thus, the political fight over deficits
2 The results of numerous studies differ little when comparing OLS and IV estimates.
Experimental studies find similar price impacts for diverse variables with respect to signs and often also sizes (see, for example, Black, 1999; or Chay and Greenstone, 2005). Thus, most recent articles on capitalization of variables other than debts do not focus on endogeneity problems (see, for example, Stull and Stull, 1991; Palmon and Smith, 1998; or Brasington, 2001, 2002). Bajari and Kahn (2005) call this a common practice in the hedonic literature.
3 The Statistical Office of the Canton of Zürich writes in its press release Statistik.info 21/2003 that
the most important financial indicator on the balance sheet is “net funds” (translated from German). DOI: 10.2202/1555-5879.1539
and debts is no intergenerational conflict, but an intragenerational conflict between today’s property owners and today’s tenants.
We are aware that in real life the capitalization mechanism is affected by various identifiable conditions. Two types of such conditions may be discerned. The first group comprises conditions such as housing market inefficiencies due to moving costs, slow adjustment mechanisms, and fiscal
illusion as proposed by Buchanan (1964). Under such conditions capitalization
still holds in the long run but is slow and more erratic in the short run. Thus, if a short run increase of debt spending occurs, there are losers and winners who
have incentives to lobby for and against debt spending, respectively (see
Eichenberger and Stadelmann, 2009). Second, there are factors such as partial bailout expectations and fiscal equalization schemes that explicitly or implicitly transfer the debt obligations from one community to others or to higher government levels. These factors weaken capitalization at the local level but transfer it to the higher level, thus offering local jurisdictions partial incentives to opt for debts. Thus, in countries with substantial systems of equalization grants, capitalization of debts at the local level is likely to be lower. However, equalization grants do not completely annihilate the proposed mechanism but rather transfer it to a higher federal level. In countries with large systems of equalization at the local level but mobile individuals, debts are likely to capitalize partly at the local and partly at the regional level.
The remainder of this paper is structured as follows: Section 2 first reviews two branches of the literature which are important for our argument. It shortly presents Barro’s equivalence and looks at the literature on capitalization of taxes and public goods. Then it discusses the theoretical underpinnings of debt capitalization. Section 3 introduces our data and the econometric procedure. Section 4 presents our econometric results, and section 5 concludes.
2. RELATED LITERATURE AND THEORY
2.1.
R
ELATEDL
ITERATUREThe traditional view of government debts presumes that when governments cut taxes and run deficits consumers increase their spending, thus shifting the debt
burden to future generations. Barro (1974) considers an alternative view of
government budget deficits. In an overlapping generations model where households act as though they lived infinitely, government debts have no effect on consumption as (altruistic) individuals increase their savings, which allows future generations to pay back the debts. Therefore, a tax cut financed by new government debts does not reduce the tax burden for the present generation, it
simply reschedules it. It is important to note that Barro’s results are generated by assuming intergenerationally dependent preferences which effectively create an infinite time horizon although each individual member of a generation has only a
finite lifetime. This view on budget deficits was labeled by Buchanan (1976) and
others, as well as by Barro (1989) himself, as the “Ricardian equivalence.” To establish the equivalence of taxes and public debts, loan markets must be perfect, individuals must be certain about their future income, and taxation must not be distortive. However, market imperfections do not annihilate but only weaken the correspondence between taxes and budget deficits.
While Ricardian equivalence is dependent on highly specific assumptions, we focus on another mechanism which induces a correspondence between taxes and public debts. It works through the housing and land market. By accumulating debts, a community is only able to alter the time distribution of explicit tax payments. If the debt-issuing generation wants to sell its property it faces lower values when large obligations have been accumulated in the past. The buying generation bids less for the assets because they have to pay back the accumulated debts through higher taxes in the future. Debts therefore reduce the price for the current generations’ properties which makes them bear the burden. While this argument is surprising to many economists and is not mentioned in academic and public debates on debts and deficits, it has
already been brought forward by Daly (1969).
In the same year, Oates (1969) argued in a path-breaking study that consumers
migrate to the jurisdiction offering the tax/public services package which is best suited to their preferences. Differences in these fiscal packages are then reflected in the price of housing that individuals are willing to pay to live in a
certain location, providing a first test for the Tiebout (1956) hypothesis. Oates’
regressions confirm capitalization of both property taxes and public goods which are approximated by public expenditures. Following Oates, a number of well-known papers in public finance defend an opposite view. Starting with a
critical comment from Pollakowski (1973) and an immediate reply from Oates
(1973), authors like Edel and Sclar (1974) and Hamilton (1976) argue against
capitalization of fiscal variables such as taxes, expenditures or public services
into housing prices. Brueckner (1979) provides an excellent survey of this
academic discussion. Starrett (1981) and Yinger (1982) finally conclude the
intellectual debate after more than a decade by providing theoretical models that validate the capitalization of fiscal differences in the long run.
Empirical literature following the first capitalization studies mainly differs with respect to the degrees found for capitalization of diverse variables and the hypotheses tested. The literature finds that apart from differentials in taxes and public services, variables such as school quality, environmental quality, DOI: 10.2202/1555-5879.1539
neighborhood characteristics, etc. are partly or fully capitalized into property
values. A comprehensive study of capitalization was done by Yinger et al. (1988).
Other and more recent capitalization analyses include Stull and Stull (1991), Palmon and Smith (1998), Epple and Sieg (1999), and Brasington (2002), among others. Property values have also been used as a proxy for the valuation of public goods. Black (1999), Figlio and Lucas (2004), and Reback (2005) are some of the
numerous examples. Fischel (2001) argues that property owners as watchful
citizens of local governments counteract possible risks to their assets.
Interestingly, of all these capitalization studies none looks at the capitalization of public debts. Nevertheless, there exists some related literature. There are some few papers which analyze the effect of unfunded liabilities of pension plans on municipal property prices. In a comprehensive literature search we
found two contributions only: Epple and Schipper (1981) emphasize the problem
of finding good measures for the local underfunding problem of pensions as actuarial assumptions vary between different jurisdictions, making it difficult to estimate the precise obligations. They find some capitalization effects for municipalities in the Pittsburgh area but they mention that additional empirical
research on the question is needed. In a similar setting, Leeds (1985) considers 67
municipalities in the Chicago area. As a measure for unfunded liabilities he uses the ratio of the payments by the pension fund to the assets held by it. He does not find any significant coefficients in the regression analysis for his underfunding measure but suggests that underfunded pensions have an indirect effect on property values via taxes. The actions of previous political generations affect current taxes and thereby house prices. Consequently, underfunding is a form of hidden taxation and politically motivated. Both contributions partly attribute their moderately significant results to the difficult data situation and weak municipal accounting systems. The authors state that the evidence for the capitalization of unfunded liabilities is inconsistent and further empirical research might shed light on the underlying mechanisms.
2.2.
T
HEORETICALM
ECHANISMThe effectiveness of federalism as a protector for future generations depends on the existence of capitalization in general and debt capitalization in particular.
Intuitively, debt capitalization works as follows: Individuals form expectations on the future development of real estate values. The capitalization literature confirms that the demand for property depends on the quality of public services and the tax price. Both variables depend on the debt burden. If the present generation expects future house prices to rise due to, among other factors, high net assets or low net debts, individuals already bid more for houses today causing present prices to rise. On the other hand, communities with negative prospects
due to high net debts will see declining house prices even today. Therefore, it is not the future generation who bear the burden of government debts but present property owners. Consequently, we expect property prices to be lower in communities with lower net assets and higher net debts, respectively.
The extent of capitalization depends on the relative supply elasticities of the various factors of production. If the supply of land is inelastic and the other factors of production (labor and capital) are mobile, the whole future tax burden has to be carried by land. Thus, there is full capitalization, which means that present land owners are carrying the burden. In contrast, when labor is not mobile it also carries part of the burden. While the former conditions are typical for local jurisdictions, the latter apply to national economies. Therefore, debt capitalization is more relevant to local government debt than to central government debt. This sets a natural brake on local government debts which protects future generations from the debt burden. In contrast, at the national level capitalization is less relevant, which allows shifting at least part of the debt burden to future generations.
But what do we know about the relative supply elasticities of land and other factors of production? It can be safely assumed that land is rather inelastic, particularly when compared to labor and capital in a metropolitan area of a federal state. Thus, land owners should carry the burden of low municipal assets and high municipal debts. However, capitalization of net funds also depends on the absolute elasticity of the supply of land for construction in general and the
institutional mechanism which determines zoning. Edel and Sclar (1974) and
Hamilton (1976) claim that the supply of jurisdictions can be increased in the long run. Therefore, the supply of any arbitrary tax/public service combination is perfectly elastic. In this case competition between land developers equalizes differentials in house values and fiscal variables have no influence on prices. If the supply of land were perfectly elastic, a shift in demand due to changes in public debts and assets would have no effect on prices. On the other hand, Yinger (1981, 1982) argues that the supply of land of a given quality, i.e. land which exhibits a specific tax/public service combination, cannot be perfectly elastic because it always involves opportunity costs for the land developers. Housing prices are not only influenced by fiscal variables but also by other factors such as local amenities. Additionally, tax revenue does not translate as directly into public services for all communities as supposed by the above-mentioned authors. Lastly, the maximum capacity of a residential area is fixed in each jurisdiction and nonresidential land cannot be converted endlessly. Consequently, the supply of housing must become inelastic when approaching full capacity, particularly in urban areas. In the long-run equilibrium, for a
sufficiently high population density, such as in a metropolitan area, no more conversions are possible and local fiscal variables will be fully capitalized.
Clearly, the absolute elasticity of supply is an empirical question and depends on various factors. In Switzerland, for instance, the area which can be used for construction of buildings has only increased by about 2.7 percent in total between 1994 and 2006, and in the Canton of Zurich the area available for housing has actually decreased over the same period although the population has grown by about 10 percent. It is also evident that in more densely populated regions supply cannot be perfectly elastic.
3. DATA
We evaluate whether federalism protects future generations through debt capitalization by analyzing data from 169 communities in the metropolitan area of Zurich, Switzerland. The city of Zurich is the center of the largest urban agglomeration in Switzerland with over one million people living and working there. The Canton (Swiss form of State) of Zurich is the largest of all 26 Swiss cantons and has approximately 1.3 million inhabitants. The metropolitan area consists of 171 municipalities (including the city of Zurich and the city of Winterthur). Heterogeneity is driven by, among other factors, the widely differing size of the communities (from 251 to 29321 inhabitants, excluding Zurich and Winterthur), their distance to the economic centers, and their orientation towards the Zurichsee, a large (88.66 km2) lake in the canton.4
Each community in the Canton determines its own income tax rates by annually fixing a municipal tax multiplier on the state income tax (“allgemeine Staatssteuer”) which is a progressive income tax schedule at the cantonal level. This highly decentralized form of income tax is typical for
Switzerland and finances over 80% of communal expenditures in the Canton
of Zurich. Municipal tax rates are set either by the citizens in a town meeting or by the municipal parliament. By international standards, the municipalities have large autonomy with respect to public expenditures and local regulations, although the cantonal as well as the federal governments set minimum standards for the provision of various public goods. Minimum standards reduce the problem of errors in the measurement and the comparison of public goods between jurisdictions that is inherent in most capitalization
studies according to Palmon and Smith (1998).
4 Supplementary information on the Canton and the City of Zurich are available in the
In 1982 the canton’s municipalities introduced a harmonized public accounting system for budgeting and bookkeeping. These standards require all communities to follow the same legal framework concerning their current and capital accounts. In addition, they demand an annual financial statement and a balance sheet in which assets are included at acquisition values minus amortization. The balance sheet along with other bookkeeping standards distinguishes the Swiss
communal finance framework from most other countries (see Oster, 2006). Swiss
communes have full autonomy from higher government levels in domains such as the acquisition, the use, or the disposition of assets. Communities associate local self-rule in asset management with autonomy and federalism which makes it almost a holy issue.5
An important facet of Swiss federalism is that communities can become insolvent when they accumulate debts that are too high, which distinguishes Swiss communities from communities in Germany, Austria and other European countries. The Swiss federal court prevented higher government levels from bailing out insolvent communities in the publicly well-known court case of the municipality of Leukerbad, a community in the Canton of Valais with approximately 2000 inhabitants. After Leukerbad went bankrupt with obligations mounting to 346 million Swiss francs (approximately 313 million US dollars), a number of creditors issued lawsuits against the canton to settle the community’s obligations. The federal court rejected all of them, arguing that Swiss communities act on their own responsibility in the federal system. Consequently, communities in our dataset will not be bailed out by higher government levels and have no strategic incentive to accumulate either debts or extensive budget deficits.
As a result, the metropolitan area of Zurich is a perfect laboratory to identify whether federalism in the sense of fiscal decentralization protects future generations by capitalization of local assets and debts in private properties.
We analyze the impact of municipal assets and debts on the average price of comparable single family houses over the years 1998 to 2004. These houses are
characterized by five rooms, two bathrooms, 450m2 surface, 750m3 volume,
end-terrace houses, conveniently situated in the municipality, and one garage space. The data was provided by the Cantonal Bank of Zurich, the market leader in real estate banking in the canton, which evaluates houses by the sales comparison approach based on actual transactions. Moreover, location-specific characteristics such as distance to the next school or the next shopping facility are available for each observation. By looking at a comparable house for each
5 See Dafflon (2006) for a detailed discussion concerning communal real property management
in Switzerland as well as the harmonized public accounting system. DOI: 10.2202/1555-5879.1539
municipality we can focus on differentials in debts, public services and amenities between communities.
Our dataset includes a large number of variables which capture real estate specific aspects as well as aspects specific to the respective municipality such as taxes, real net funds, equity, public goods, and various demographic characteristics. These data were obtained from the Statistical Office of the Canton of Zurich (Statistisches Amt des Kantons Zürich), the Secretary for Education of the Canton of Zurich (Bildungsdirektion des Kantons Zürich), and the Financial Statistics of the Canton of Zurich (GEFIS Finanzstatistik des Kantons Zürich).
As our primary variable of interest we use real net funds which are the main municipal financial assets (liquidities, assets, and equipment; adjusted for amortizations but excluding accruals) minus debts (regular obligations, short-term debts and long-short-term debts excluding deferrals and provisions). Equity from the communal balance sheets serves as an additional variable to approximate a community’s asset and debt situation. For robustness tests we use two different measures reported by the Statistical Office: net funds (as real net funds but including accruals, deferrals and provisions) and self-financing per capita, which is a measure similar to the managerial Cash Flow.
Local public goods are accounted for by aggregated public expenditures, the average class size in primary schools, proximity to schools, and an identifier for whether the school is managed by the community itself or a separate school community. We also control for a number of other demographic and socio-economic variables in further robustness tests. Needless to say, we take account of local real estate characteristics by including variables for lake view, south-west exposure, proximity to the urban center, proximity to the next shop, environmental damage, and land available for construction use.
Our dataset contains these variables for all municipalities in the canton and we average them over the same time period as the house price variable.6 All
control variables, their sources, means and standard deviations are reported in Appendix Table A1.
6 In the analysis we do not include Zurich and Winterthur because, as opposed to the other
municipalities, they are considered to be cities and have a different structure as they are composed of heterogeneous districts. Polinsky and Shavell (1976) show that using cross-section regressions to analyze the effect of amenities on house values is only valid when the communities are considered “small” and there is mobility within and among them. Zurich and Winterthur are large compared to the rest of the communities in the canton. We performed a number of robustness tests including the city of Zurich and Winterthur. Our main insights do not change when we include these two additional observations.
4. ESTIMATION PROCEDURE AND RESULTS
4.1.
B
ASELINEE
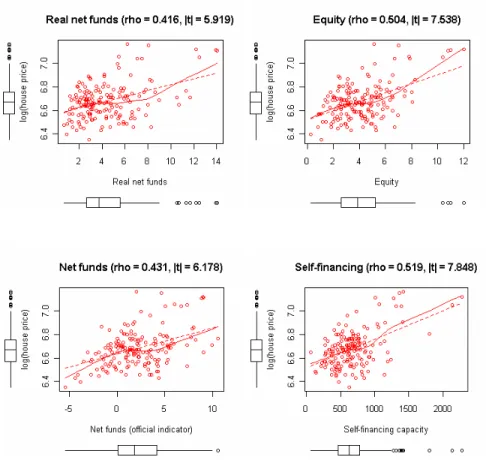
STIMATESFigure 1 represents the central motivation for why federalism serves as a protector of future generations through debt capitalization. The scatterplots reveal the relationship between four measures of a community’s financial situation and house prices. The Box-Whisker-Plots next to the horizontal and vertical axes give an idea of the distribution of the variables. The box represents the first to the third quartile of the distribution containing the median. The whiskers extend to the most extreme data point which is no more than 1.5 times the interquartile range from the box. The dashed line represents the linear relationship between the variables. In order to take account of possible non-linearities, we estimate a LOESS smoother (Local Polynomial Regression Fitting) with a smoother span of 0.75 which is represented by the solid line.
Municipal real net funds as well as all other measures of a community’s financial situation show significant and positive correlations with house values. These positive correlations could be due to omitted variable bias. Therefore, we estimate a so-called amenity model to identify the impact of communal asset and debt measures on house prices. In such models,7 the measures of
interest, municipal real net funds, equity, net funds and self-financing capacity can be included as additional variables besides common attributes such as location characteristics, income tax rates, etc. We use an amenity model of the following common specification form
, ) control ( ) TaxRate ( ) situation asset/debt ( 3 2 1 0 i i j j C j i i i p
ε
β
β
β
β
+ ∑ + + + = =where pirepresents the value of a comparable single family house in jurisdiction i
averaged over the years 1998 to 2004. The coefficients βj for j =3,...,C
measure the impact of public goods, as well as other amenities such as demographic and location effects which were averaged over the same time period. The estimated coefficients of a municipality’s real net funds, equity, and the tax rates each represent the ceteris paribus impact of a change in a community’s wealth. Table 1 reports the results.
7 See, for example, Oates (1969) and the reactions to his paper (Stull and Stull, 1991, or
Brasington, 1999).
Figure 1. Property Values and Different Measures for Financial Situation
Notes: The figures show the correlation between different measures of a community’s financial situation and log(house price). rho represents the correlation coefficient. The Box-Whisker-Plots on the x and y axis represent the distribution of the respective variables. The whiskers extend to the most extreme data point which is no more than 1.5 times the interquartile range from the box. The dashed line represents the linear relationship between the two variables. For the solid line, a LOESS smoother which uses locally polynomial regressions with smoother span 0.75 was applied.
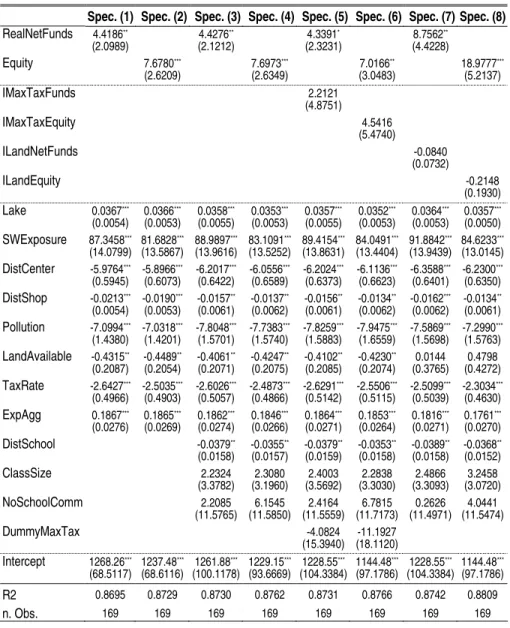
Table 1. Public Debts and Property Prices –Results and Differential Hypotheses
Spec. (1) Spec. (2) Spec. (3) Spec. (4) Spec. (5) Spec. (6) Spec. (7) Spec. (8)
RealNetFunds 4.4186** (2.0989) 4.4276 ** (2.1212) 4.3391 * (2.3231) 8.7562 ** (4.4228) Equity 7.6780*** (2.6209) 7.6973 *** (2.6349) 7.0166 ** (3.0483) 18.9777 *** (5.2137) IMaxTaxFunds 2.2121 (4.8751) IMaxTaxEquity 4.5416 (5.4740) ILandNetFunds -0.0840 (0.0732) ILandEquity -0.2148 (0.1930) Lake 0.0367*** (0.0054) 0.0366 *** (0.0053) 0.0358 *** (0.0055) 0.0353 *** (0.0053) 0.0357 *** (0.0055) 0.0352 *** (0.0053) 0.0364 *** (0.0053) 0.0357 *** (0.0050) SWExposure 87.3458*** (14.0799) 81.6828 *** (13.5867) 88.9897 *** (13.9616) 83.1091 *** (13.5252) 89.4154 *** (13.8631) 84.0491 *** (13.4404) 91.8842 *** (13.9439) 84.6233 *** (13.0145) DistCenter -5.9764*** (0.5945) -5.8966 *** (0.6073) -6.2017 *** (0.6422) -6.0556 *** (0.6589) -6.2024 *** (0.6373) -6.1136 *** (0.6623) -6.3588 *** (0.6401) -6.2300 *** (0.6350) DistShop -0.0213*** (0.0054) -0.0190 *** (0.0053) -0.0157 ** (0.0061) -0.0137 ** (0.0062) -0.0156 ** (0.0061) -0.0134 ** (0.0062) -0.0162 *** (0.0062) -0.0134 ** (0.0061) Pollution -7.0994*** (1.4380) -7.0318 *** (1.4201) -7.8048 *** (1.5701) -7.7383 *** (1.5740) -7.8259 *** (1.5883) -7.9475 *** (1.6559) -7.5869 *** (1.5698) -7.2990 *** (1.5763) LandAvailable -0.4315** (0.2087) -0.4489 ** (0.2054) -0.4061 ** (0.2071) -0.4247 ** (0.2075) -0.4102 ** (0.2085) -0.4230 ** (0.2074) (0.3765) 0.0144 (0.4272) 0.4798 TaxRate -2.6427*** (0.4966) -2.5035 *** (0.4903) -2.6026 *** (0.5057) -2.4873 *** (0.4866) -2.6291 *** (0.5142) -2.5506 *** (0.5115) -2.5099 *** (0.5039) -2.3034 *** (0.4630) ExpAgg 0.1867*** (0.0276) 0.1865 *** (0.0269) 0.1862 *** (0.0274) 0.1846 *** (0.0266) 0.1864 *** (0.0271) 0.1853 *** (0.0264) 0.1816 *** (0.0271) 0.1761 *** (0.0270) DistSchool -0.0379** (0.0158) -0.0355 ** (0.0157) -0.0379 ** (0.0159) -0.0353 ** (0.0158) -0.0389 ** (0.0158) -0.0368 ** (0.0152) ClassSize 2.2324 (3.3782) (3.1960) 2.3080 (3.5692) 2.4003 (3.3030) 2.2838 (3.3093) 2.4866 (3.0720) 3.2458 NoSchoolComm 2.2085 (11.5765) (11.5850) 6.1545 (11.5559) 2.4164 (11.7173) 6.7815 (11.4971) 0.2626 (11.5474)4.0441 DummyMaxTax -4.0824 (15.3940) (18.1120) -11.1927 Intercept 1268.26*** (68.5117) 1237.48 *** (68.6116) 1261.88 *** (100.1178) 1229.15 *** (93.6669) 1228.55 *** (104.3384) 1144.48 *** (97.1786) 1228.55 *** (104.3384) 1144.48 *** (97.1786) R2 0.8695 0.8729 0.8730 0.8762 0.8731 0.8766 0.8742 0.8809 n. Obs. 169 169 169 169 169 169 169 169
Notes: The left-hand-side variable in all regressions is the price of a standardized and comparable single family house across 169 municipalities. Robust standard errors using a White-Huber heteroskedasticity adjusted sandwich estimator in parenthesis. * * * indicates significance levels of below 1 percent; * * indicates significance levels between 1 and 5 percent; * indicates significance levels between 5 and 10 percent.
If federalism induces debt capitalization, it follows that real net funds (and other measures for assets and debts of a community) should capitalize positively while income tax rates should exhibit a negative sign. Specification (1) fully supports our theoretical reasoning. The effect of municipal real net funds per capita is positive and significant at the 5% level. Income taxes
capitalize negatively and significantly at the 1% level. As communal assets and
debts reflect themselves in property values, the burden of low assets and high debts cannot be shifted to future generations and current land owners have to shoulder bad municipal finances.
The monetary extent of capitalization of real net funds depends on the number of inhabitants per house and the debt burden which is financed by natural (as opposed to corporate) persons, which in turn depends on the share of capital taxes, the relative incomes of inhabitants as well as the progressivity of the tax schedule. Due to these influences and due to the fact that the size of the effects found are per house while our data for real net funds are on a per capita basis, we cannot directly calculate the extent of capitalization. To give a rough estimate we start from the fact that in the Canton of Zurich natural
persons pay for about 80% of total tax receipts. If we assume that each house
is inhabited by four persons and that these individuals are average taxpayers, we obtain from the coefficient value of real net funds in specification (1) an average capitalization rate for a 1% increase in real net funds of 138%.8
All of our control variables have the expected signs as shown in specification (1). For lake view and south-west exposure, we unanimously anticipated and obtained positive coefficients, whereas for distance to the metropolitan center, distance to shops, and air pollution level, negative coefficients are observed. Land available for construction capitalizes negatively and significantly as more supply decreases prices. The coefficient of the aggregate spending for culture, health, administration, and social security is positive and significant as these expenditures serve as a measure for the provision of public goods.
Specification (2) analyzes the effect of municipal equity per capita from balance sheets on house prices as another measure for a community’s asset and debt situation. Higher municipal equity increases house values significantly at the 1%
level. Equity in balance sheets might suffer from evaluation standards concerning the commune’s administrative capital. Financial equalization transfers from the canton depend on a constructed index of financial power which also considers communal equity. As a result, communities have an incentive to report lower equity values per capita. The downward bias of municipal equity makes it possible
8 Overcapitalization is not uncommon in the literature: Oates (1973), Church (1974), and
that the coefficient estimates are biased upwards. However, the incentive to report too-low equity is systematic for all municipalities, which indicates that a potential bias is symmetric for all communities. All control variables remain comparable in size and significance when compared to specification (1).
In specifications (3) and (4) we control for various variables measuring school quality. Especially, estimates with data for the United States indicate that schools play a role in determining house prices (see Black, 1999; Figlio and Lucas, 2004; or Reback, 2005). For Switzerland, PISA Science Competencies Scores indicate that the between-school variance explained by the PISA index of the economic, social and cultural status of students and schools is lower than for most other OECD countries, which supports the common perception of generally small differences between school standards in Switzerland. In our empirical specifications, distance to the next school capitalizes negatively and significantly as it is more attractive to live nearer to schools. Class size in primary schools also negatively affects property prices as class size is an indicator for the quality of schooling. However, the coefficient’s standard error is high. Separate school communities might work more efficiently than unified communities (see Frey and Eichenberger, 2002) but the dummy does not yield any significant results. Concerning our main hypothesis of capitalization of assets and debts, we find that the inclusion of school-specific controls does not change the sign and both variables in columns (3) and (4) remain highly significant.
Even though the Swiss federal court prevents higher federal levels from bailing-out communities, there exist other ways of supporting communities in financial distress. Implicit forms of bail-out may potentially represent incentives for local governments to accumulate debt. Compared to other countries, Switzerland has no substantial system of equalization grants. However, communities with high tax rates are often in financial turmoil and may receive additional grants from the cantonal government. If communities with low assets and high debts obtain financial support, capitalization of municipal net funds and equity may decrease. To identify whether implicit bail-out reduces capitalization of debts, we interact our financial measures with a dummy which identifies communities with tax rates above the 80th decile (high tax communities). The results in columns (5) and (6) show that municipal real net funds and municipal equity capitalize both positively and significantly. The interaction terms (IMaxTaxFunds) in specification (5) and (IMaxTaxEquity) in specification (6) are positive but both far from significant which indicates that implicit bail-out by higher government levels plays a minor role for capitalization.
We have indicated that capitalization of debts may depend on the elasticity of the supply of land. When enough land for construction is available, capitalization of fiscal differences between communities can be lower due to supply reactions by DOI: 10.2202/1555-5879.1539
land developers. Data from 1994 to 2006 shows that total developed sites available in the Canton of Zurich increased only very slightly from 27762 to 28511 hectares and land available for housing actually decreased during the same period from 14642 to 14040 hectares. On the other hand, cantonal population increased
by over 10000 persons a year or 0.8% annually. This indicates that supply of land
is likely to be close to its long-run equilibrium and that housing values mainly reflect tax/service combinations. Nevertheless, we interact our measure for available land for construction with real net funds and equity in specifications (7) and (8), respectively. The negative signs of the interaction terms indicate that capitalization of communal assets and debts is lower in communities with more available land but the coefficients are not statistically significant. Again, the burden of local public debts cannot be shifted to future generations as real net funds and equity capitalize significantly independent of land availability.
So far we have shown that municipal real net funds and equity affect property values positively, which provides support for viewing federalism as a debt brake because of debt capitalization. Appendix Table A2 provides additional robustness tests using other controls together with real net funds and equity which confirm the baseline results. Next, we will analyze the influence on a community’s financial situation more closely by considering different specification tests and more indirect measures of municipal wealth.
4.2.
R
OBUSTNESST
ESTSWe investigate the effect of variations of the estimation equation and introduce additional measures for a community’s financial situation to show the robustness of our baseline results in Table 2.
Specifications (1) and (2) show the results when estimating a semi-logarithmic form of the amenity model (see, for example, Brasington, 2001, 2002). In such a
setting, the dependent variable is expressed in logs and all other variables enter the regression as in the standard setting. The results show that our main variables of interest, i.e. real net funds and municipal equity, remain both positive and significant.
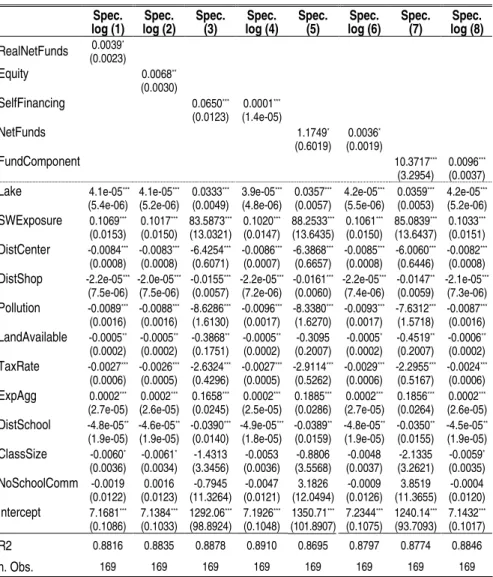
Table 2. Public Debts and Property Prices – Robustness Tests
Spec.
log (1) log (2) Spec. Spec.(3) log (4) Spec. Spec.(5) log (6) Spec. Spec.(7) log (8) Spec.
RealNetFunds 0.0039* (0.0023) Equity 0.0068** (0.0030) SelfFinancing 0.0650*** (0.0123) 0.0001*** (1.4e-05) NetFunds 1.1749* (0.6019) 0.0036* (0.0019) FundComponent 10.3717*** (3.2954) 0.0096*** (0.0037) Lake 4.1e-05*** (5.4e-06) 4.1e-05*** (5.2e-06) 0.0333*** (0.0049) 3.9e-05*** (4.8e-06) 0.0357*** (0.0057) 4.2e-05*** (5.5e-06) 0.0359*** (0.0053) 4.2e-05*** (5.2e-06) SWExposure 0.1069*** (0.0153) 0.1017*** (0.0150) 83.5873*** (13.0321) 0.1020*** (0.0147) 88.2533*** (13.6435) 0.1061*** (0.0150) 85.0839*** (13.6437) 0.1033*** (0.0151) DistCenter -0.0084*** (0.0008) -0.0083*** (0.0008) -6.4254*** (0.6071) -0.0086*** (0.0007) -6.3868*** (0.6657) -0.0085*** (0.0008) -6.0060*** (0.6446) -0.0082*** (0.0008) DistShop -2.2e-05*** (7.5e-06) -2.0e-05*** (7.5e-06) -0.0155*** (0.0057) -2.2e-05*** (7.2e-06) -0.0161*** (0.0060) -2.2e-05*** (7.4e-06) -0.0147** (0.0059) -2.1e-05*** (7.3e-06) Pollution -0.0089*** (0.0016) -0.0088*** (0.0016) -8.6286*** (1.6130) -0.0096*** (0.0017) -8.3380*** (1.6270) -0.0093*** (0.0017) -7.6312*** (1.5718) -0.0087*** (0.0016) LandAvailable -0.0005** (0.0002) -0.0005** (0.0002) -0.3868** (0.1751) -0.0005** (0.0002) -0.3095 (0.2007) -0.0005* (0.0002) -0.4519** (0.2007) -0.0006** (0.0002) TaxRate -0.0027*** (0.0006) -0.0026*** (0.0005) -2.6324*** (0.4296) -0.0027*** (0.0005) -2.9114*** (0.5262) -0.0029*** (0.0006) -2.2955*** (0.5167) -0.0024*** (0.0006) ExpAgg 0.0002*** (2.7e-05) 0.0002*** (2.6e-05) 0.1658*** (0.0245) 0.0002*** (2.5e-05) 0.1885*** (0.0286) 0.0002*** (2.7e-05) 0.1856*** (0.0264) 0.0002*** (2.6e-05) DistSchool -4.8e-05** (1.9e-05) -4.6e-05** (1.9e-05) -0.0390*** (0.0140) -4.9e-05*** (1.8e-05) -0.0389** (0.0159) -4.8e-05** (1.9e-05) -0.0350** (0.0155) -4.5e-05** (1.9e-05) ClassSize -0.0060* (0.0036) -0.0061* (0.0034) -1.4313 (3.3456) -0.0053 (0.0036) -0.8806 (3.5568) -0.0048 (0.0037) -2.1335 (3.2621) -0.0059* (0.0035) NoSchoolComm -0.0019 (0.0122) 0.0016 (0.0123) -0.7945 (11.3264) -0.0047 (0.0121) 3.1826 (12.0494) -0.0009 (0.0126) 3.8519 (11.3655) -0.0004 (0.0120) Intercept 7.1681*** (0.1086) 7.1384*** (0.1033) 1292.06*** (98.8924) 7.1926*** (0.1048) 1350.71*** (101.8907) 7.2344*** (0.1075) 1240.14*** (93.7093) 7.1432*** (0.1017) R2 0.8816 0.8835 0.8878 0.8910 0.8695 0.8797 0.8774 0.8846 n. Obs. 169 169 169 169 169 169 169 169
Notes: The left-hand-side variable in all regressions is the price of a standardized and comparable single family house across 169 municipalities. Log indicates that the dependent variable is on a logarithmic scale. Robust standard errors using a White-Huber heteroskedasticity adjusted sandwich estimator in parenthesis. * * * indicates significance levels of below 1 percent; * * indicates significance levels between 1 and 5 percent; * indicates significance levels between 5 and 10 percent.
In specifications (3) and (4) we estimate models using municipal self-financing capacity as an indicator for municipal wealth. Self-financing capacity is a hotly discussed topic in Switzerland. The Statistical Office calculates a self-financing capacity measure for every community. This measure is constructed using a number of different accounts linked to amortization, expenditures and revenues and represents approximately a managerial Cash Flow. Contrary to net funds and municipal equity, self-financing capacity depends strongly on the current income tax rate. Additional reservations apply for this measure as financial equalization transfers depend on the self-financing capacity. Consequently, the measure might be biased downward for all communities. Specification (3) presents results of the simple amenity model, and in specification (4) we estimate a semi-logarithmic form. In both cases the self-financing capacity capitalizes positively and is statistically significant at the 1% level.
In specifications (5) and (6) we consider a new measure of municipal assets and debts. The Statistical Office of the Canton of Zurich reports a net funds measure which includes accruals, deferrals and provisions. It is a rather volatile measure when analyzed on a yearly basis. Accruals and deferrals especially tend to change from December 31 to January 1, depending on bookkeeping practices. Net funds reported by the Statistical Office do not necessarily represent the long-term value of the assets a community has at its disposal and communal obligations are biased by differences between communities when treating deferrals. The net funds measure is widely used inside the office itself and also for its reports on communal finances, which makes it a widely-applied and recognized indicator in the Canton of Zurich. Thus, we use it for robustness tests. Net funds still capitalize positively and significantly as shown in specifications (5) and (6).
To determine whether these four indicators of the communal financial situation have a multidimensional character, we employ principal component analysis. It turns out that the four variables – real net funds, net funds, self-financing, and debt repayment – can be represented as a one-dimensional construct (see Appendix Figure A1 for a factor map). The first component explains over 70% of the total variance, which indicates that the different indicators provide similar information on the latent variables concerning the financial situation of a community. We construct one principal component and use it as an independent variable in specifications (7) and (8). The results show that in both cases the component for net funds influences house prices positively and significantly.
5. CONCLUSION
Federalism is usually seen as a protector of the present generation. But does federalism also protect future generations from public debts? Debt capitalization represents a new and so far neglected constraint for sub-national government debts. It introduces a natural debt brake for local governments. While many citizens fear that debt financing of government expenditures burdens future generations, debt capitalization indicates that jurisdictions with larger net debts exhibit, ceteris paribus, lower property prices. Debt capitalization in property values is the more pronounced the less elastic land supply is and the more mobile the other factors of production are, i.e. capitalization is more important for local than for national debts.
While the assumptions for the standard type of Ricardian equivalence to hold are quite demanding (see Barro, 1974, and the resulting discussion), we argue that debt capitalization in federal systems ensures a similar equivalence which works also with non-altruistic individuals. Non-altruistic individuals are not able to accumulate debts at the expense of future generations because real estate persists over time. The value of property depends on current and future taxes and public services as well as on a number of location-specific amenities. Individuals bid high prices for real estate in communities with persistently low taxes and high quality public goods. They know that low municipal net funds and low equity lead to higher taxes in the future as debts have to be repaid and reserves have to be replenished. Jurisdictions with larger net debts exhibit, ceteris paribus, lower property prices. Thus, the burden of local government debts is shouldered by current property owners.
Using data for municipalities in the Swiss metropolitan district of Zurich, we test whether debt capitalization exists. Switzerland with its strong federal system is an ideal laboratory for this test. The Swiss federal court has ruled out the possibility of a municipal bail-out by higher government levels in the well-publicized case of the community of Leukerbad. Moreover, Swiss municipalities have the option to levy income taxes via a municipal tax multiplier on the cantonal income tax, and they have free access to capital markets. Communal property management is a sacred issue of federalism as communities link it with sovereignty. A system of fiscal equalization exists in Switzerland as in most other developed federations, but compared to other countries fiscal equalization grants are relatively small. Finally, all municipalities in the Canton of Zurich use a modern and comparable harmonized accounting system which provides high quality measures for municipal debts, assets, and equity.
Our empirical results confirm that local public assets and debts capitalize into property prices. Municipalities with higher debts also have lower property
values. The effect is stable even when considering a large array of independent controls and differential hypotheses. In robustness tests we show that a number of other measures indicating a community’s financial situation capitalize positively, too. These results make a strong argument for the equivalence of taxes and debts at the local level in a federal system.
The existence of debt capitalization has important implications for the theory of federalism. It provides a new and so far neglected argument in favor of federalism. Debt capitalization is likely to be more complete at the local than at the central level as labor is more mobile at the local than at the central level, thus leaving the burden of debts to present land owners, i.e. to members of the current generation. Therefore, debt capitalization provides for a natural and more effective brake for government debts at the local than at the central level. Thus, decentralized countries with a larger local budget share can be assumed to be less prone to opt for deficits and debts than centralized countries.
APPENDIX: Figure A1. Factor Map of Variables Measuring Financial Situation of Community
Notes: Four variables are employed in the Principal Component Analysis: RealNetFunds, Equity, NetFunds, SelfFinancing. The factor map indicates how variables used in the Principal Component Analysis load on the first two dimensions. The first component explains 72.1% of the observed variance and the four variables can be summarized by this component.
APPENDIX: Table A1. Data Description and Sources
Variable Description and Source Mean Std.
HousePrice Price in 1000 Swiss Francs of standardized and comparable single family house. Cantonal Bank of Zurich.
804.5000 133.5991 RealNetFunds Value in 1000 Swiss Francs of liquidities, assets and equipment
minus regular obligations, short-term debts and long-term debts per capita from municipal balance sheets. GEFIS Financial Statistics; Statistical Office, Canton of Zurich.
4.3770 2.5651
Equity Equity per capita from municipal balance sheets. GEFIS Financial Statistics; Statistical Office, Canton of Zurich.
4.1180 2.0131 NetFunds As RealNetFunds but including accruals, deferrals and provisions
(official indicator). GEFIS Financial Statistics; Statistical Office, Canton of Zurich.
2.1070 3.0102 SelfFinancing Official indicator for municipal self-financing capacity per capita.
GEFIS Financial Statistics; Statistical Office, Canton of Zurich.
672.4000 327.2910 Lake View on lake in number of hectares. Cantonal Bank of Zurich; Statistical
Office, Canton of Zurich (GIS system).
362.1000 871.8137 SWExposure Percentage of hectares with south and west exposure. Cantonal Bank
of Zurich; Statistical Office, Canton of Zurich (GIS system).
0.4283 0.2752 DistCenter Average time in minutes to Zurich main station.Cantonal Bank of Zurich;
Statistical Office, Canton of Zurich (GIS system).
26.8100 8.5909 DistShop Average distance to next shopping facility in meters. Cantonal Bank
of Zurich; Statistical Office, Canton of Zurich (GIS system).
1220.00 724.1391 Pollution Environmental damage as NO2 in microgram per cubic meter.
Cantonal Bank of Zurich; Statistical Office, Canton of Zurich (GIS system).
17.7700 4.1814 LandAvailable Unused construction area in square meters per capita. Statistical
Office, Canton of Zurich.
50.0100 23.0831 TaxRate Mean income tax rate (without churches). Statistical Office, Canton of
Zurich.
113.9000 14.0860 ExpAgg Aggregated expenditures for culture, health, administration and
social well-being per capita. GEFIS Financial Statistics; Statistical Office, Canton of Zurich.
541.2000 219.8125
DistSchool Average class size in primary school. Secretary for Education of the Canton of Zurich.
864.7000 227.0660 ClassSize Average distance to schools in meters. Cantonal Bank of Zurich;
Statistical Office, Canton of Zurich (GIS system).
19.9000 1.4855 NoSchoolComm Dummy whether the school is managed by the community itself or a
separate school community.Secretary for Education of the Canton of Zurich.
0.1970 0.3934 Commuters Fraction of commuters outgoing over labor force in community.
Statistical Office, Canton of Zurich.
0.6890 0.0689 Density Population per square kilometer. Statistical Office, Canton of Zurich. 597.7000 599.1876 Unemployment Unemployment rate. Statistical Office, Canton of Zurich. 2.2310 0.8059 Income25 25th quartile income to tax of natural persons. Statistical Office,
Canton of Zurich.
26370.00 3523.24 Elderly Fraction of population over 65 years. Statistical Office, Canton of Zurich. 0.1258 0.0292 Employed3sector Percentage of labor force employed in third sector. Statistical Office,
Canton of Zurich.
0.6515 0.1234 Notes: Sources for variables are mentioned in the table. Means and standard deviations are based on 169 averaged observations over 1998 to 2004.
APPENDIX: Table A2. Public Debts and Property Prices – Additional Robustness Tests Spec. (1) Spec. (2) Spec. (3) Spec. (4) Spec. (5) Spec. (6) Spec. (7) Spec. (8) Spec. (9) Spec. (10) Spec. (11) Spec. (12) RealNetFunds 4.4239** (2.1275) 4.4029** (2.1245) 4.4452** (2.0361) 4.2953** (2.1267) 4.8533** (2.0235) 4.3618** (2.0761) Equity 7.6637*** (2.6579) 7.6843*** (2.6631) 7.5902*** (2.5535) 7.4609*** (2.6687) 8.1335*** (2.5418) 7.6405*** (2.6155) Location Controls
YES YES YES YES YES YES YES YES YES YES YES YES
TaxRate -2.5694*** (0.5085) -2.4749*** (0.4835) -2.6151*** (0.5057) -2.4905*** (0.4903) -2.3638*** (0.4989) -2.2617*** (0.4733) -2.4482*** (0.5295) -2.3763*** (0.5081) -2.2502*** (0.5245) -2.1461*** (0.5027) -2.5917*** (0.5124) -2.4795*** (0.4925) ExpAgg 0.1918*** (0.0315) 0.1871*** (0.0312) 0.1896*** (0.0307) 0.1854*** (0.0297) 0.2078*** (0.0273) 0.2060*** (0.0266) 0.1934*** (0.0296) 0.1902*** (0.0293) 0.1360*** (0.0252) 0.1342*** (0.0246) 0.1854*** (0.0282) 0.1841*** (0.0274) DistSchool -0.0359** (0.0159) -0.0347** (0.0157) -0.0387** (0.0162) -0.0357** (0.0160) -0.0367** (0.0161) -0.0345** (0.0161) -0.0349** (0.0156) -0.0333** (0.0154) -0.0358** (0.0154) -0.0334** (0.0154) -0.0381** (0.0158) -0.0357** (0.0157) ClassSize -2.0908 (3.3787) -2.2395 (3.1891) -2.3840 (3.3547) -2.3407 (3.1815) -4.4337 (3.7070) -4.4545 (3.5127) -1.9612 (3.3092) -2.0877 (3.1434) -3.9071 (3.4435) -3.9388 (3.2541) -2.3229 (3.4369) -2.3727 (3.2338) NoSchool Comm 2.2348 (11.5539) 6.1510 (11.5685) 2.5912 (11.6847) 6.2325 (11.6267) 5.4613 (11.2891) 9.3170 (11.3078) 2.8056 (11.6776) 6.4944 (11.6810) 0.2564 (11.6423) 4.4411 (11.6800) 2.0984 (11.6123) 6.0491 (11.6100) Commuters 28.4212 (62.9221) 12.6098 (63.8728) Density -0.0030 (0.0152) -0.0007 (0.0151) Unemployment -21.3044*** (6.7999) -21.0129*** (6.8230) Income25 0.0015 (0.0016) 0.0011 (0.0017) Elderly 560.4224*** (161.3782) 561.8883*** (158.5434) Employed 3sector 9.7840 (36.8520) 6.6610 (37.5438) Intercept 1234.00*** (120.3316) 1217.39*** (112.4670) 1259.71*** (99.8505) 1228.78*** (93.4412) 1219.08*** (103.8016) 1189.47*** (96.2732) 1203.23*** (116.4568) 1186.17*** (111.9656) 1164.21*** (105.9194) 1134.00*** (99.5960) 1253.93*** (108.1336) 1223.66*** (100.0190) R2 0.8731 0.8763 0.8730 0.8762 0.8814 0.8844 0.8737 0.8766 0.8796 0.8830 0.8730 0.8763 n. Obs. 169 169 169 169 169 169 169 169 169 169 169 169
Notes: The left-hand-side variable in all regressions is the price of a standardized and comparable single family house across 169 municipalities. Robust standard errors using a White-Huber heteroskedasticity adjusted sandwich estimator in parenthesis. *** indicates significance levels of below 1 percent; ** indicates significance levels between 1 and 5 percent; * indicates significance levels between 5 and 10 percent.
References
Bajari, P., and M.E. Kahn. 2005. “Estimating Housing Demand with an Application to Explaining Racial Segregation in Cities,” 23(1) Journal of Business & Economic Statistics 20-33.
Banzhaf, H.S., and W.E. Oates. 2008. “On Ricardian Equivalence in Local Public Finance,” available at SSRN: http://ssrn.com/abstract=1248002.
Barro, R.J. 1974. “Are Government Bonds Net Wealth?” 82(6) Journal of Political Economy 1095-1117.
_______. 1989. “The Ricardian Approach to Budget Deficits,” 3(2) Journal of Economic Perspectives 37-54.
Black, S.E. 1999. “Do Better Schools Matter? Parental Valuation of Elementary Education,” 114(2) Quarterly Journal of Economics 577-599.
Brasington, D.M. 1999. “Which Measures of School Quality Does the Housing Market Value?” 18(3) Journal of Real Estate Research 395-414.
_______. 2001. “Capitalization and Community Size,” 50(3) Journal of Urban Economics 385-395.
_______. 2002. “The Demand for Local Public Goods: The Case of Public School Quality,” 30(3) Public Finance Review 163-187.
Brueckner, J.K. 1979. “Property Values, Local Public Expenditure and Economic Efficiency,” 11(2) Journal of Public Economics 223-245.
_______. 1982. “A Test for Allocative Efficiency in the Local Public Sector,” 19(3) Journal of Public Economics 311-331.
Buchanan, J.M. 1964. “Public Debt, Cost Theory, and the Fiscal Illusion,” in J.M. Ferguson, ed. Public Debt and Future Generations. Chapel Hill, NC: University of North Carolina Press.
_______. 1976. “Barro on the Ricardian Equivalence Theorem,” 84(2) Journal of Political Economy 337-342.
Chay, K.Y., and M. Greenstone. 2005. “Does Air Quality Matter? Evidence from the Housing Market,” 113(2) Journal of Political Economy 376-424.
Chinloy, P.T. 1978. “Depreciation, Adverse Selection and Housing Markets,” 5(2) Journal of Urban Economics 172-187.
Church, A.M. 1974. “Capitalization of the Effective Property Tax Rate on Single Family Residence,” 27(1) National Tax Journal 113-122.
Dafflon, B. 2006. “Real Property Management in the Swiss Communes,” in O. Kaganova and J. McKellar, eds. Managing Government Property Assets: International Experiences, pp. 201-230. Washington, DC: Urban Institute Press.
Daly, G.G. 1969. “The Burden of the Debt and Future Generations in Local Finance,” 36(1) Southern Economic Journal 44-51.
Davison, A.C., and D.A. Hinkley. 1997. Bootstrap Methods and Their Application. Cambridge, MA: Cambridge University Press.
Deller, S.C. 1990. “An Application of a Test for Allocative Efficiency in the Local Public Sector,” 20(3) Regional Science and Urban Economics 395-406.
Edel, M., and E. Sclar. 1974. “Taxes, Spending, and Property Values: Supply Adjustment in a Tiebout-Oates Model,” 82(5) Journal of Political Economy 941-954.
Eichenberger, R. 2007. “Schnitt ins eigene Fleisch,” 9(10) Schweizer Monatshefte 28-29. _______ and M. Schelker. 2006. “Independent and Competing Agencies: An Effective
Way to Control Government,” 130(1) Public Choice 79-98.
_______ and D. Stadelmann. 2009. “Consequences of Debt Capitalization: Property Ownership and Debt/Tax Choice,” CREMA Working Paper Series 2009-08, Center for Research in Economics, Management and the Arts (CREMA). Epple, D., and K. Schipper. 1981. “Municipal Pension Funding: A Theory and Some
Evidence,” 37(1) Public Choice 179-187.
_______ and H. Sieg. 1999. “Estimating Equilibrium Models of Local Jurisdictions,” 107(4) Journal of Political Economy 645-681.
_______ and A. Zelenitz. 1981. “The Implications of Competition Among Jurisdictions: Does Tiebout Need Politics?” 89(6) Journal of Political Economy 1197-1217. _______, _______, and M. Visscher. 1978. “A Search for Testable Implications of the
Tiebout Hypothesis,” 86(3) Journal of Political Economy 405-425.
Figlio, D.N., and M.E. Lucas. 2004. “What’s in a Grade? School Report Cards and the Housing Market,” 94(3) American Economic Review 591-604.
Fischel, W.A. 2001. The Homevoter Hypothesis: How Home Values Influence Local Government Taxation, School Finance, and Land-Use Policies. Cambridge, MA: Harvard University Press.
Frey, B.S., and R. Eichenberger. 2002. The New Democratic Federalism for Europe: Functional, Overlapping, and Competing Jurisdictions. Cheltenham, UK: Edward Elgar Publishing Limited.
Hamilton, B.W. 1976. “Capitalization of Intrajurisdictional Differences in Local Tax Prices,” 66(5) American Economic Review 743-753.
Ketkar, K. 1992. “Hazardous Waste Sites and Property Values in the State of New Jersey,” 24(6) Applied Economics 647-59.
Leeds, M.A. 1985. “Property Values and Pension Underfunding in the Local Public Sector,” 18(1) Journal of Urban Economics 34-46.
Oates, W.E. 1969. “The Effects of Property Taxes and Local Public Spending on Property Values: An Empirical Study of Tax Capitalization and the Tiebout Hypothesis,” 77(6) Journal of Political Economy 957-971.
_______. 1973. “The Effects of Property Taxes and Local Public Spending on Property Values: A Reply and Yet Further Results,” 81(4) Journal of Political Economy 1004-1008.
Oster, R. 2006. “Aktueller Stand der Gesetzgebung in den Ländern und ausgewählte Fragen des neuen Rechnungswesens,” in J.L. and M. Junkernheinrich, eds. Doppelt gebucht hält besser? Loccum: Rehburg-Loccum.
Palmon, O., and B.A. Smith. 1998. “New Evidence on Property Tax Capitalization,” 106(5) Journal of Political Economy 1099-1111.
Polinsky, M.A., and S. Shavell. 1976. “Amenities and Property Values in a Model of an Urban Area,” 5(1-2) Journal of Public Economics 119-129.
Pollakowski, H.O. 1973. “The Effects of Property Taxes and Local Public Spending on Property Values: A Comment and Further Results,” 81(4) Journal of Political Economy 994-1003.
Reback, R. 2005. “House Prices and the Provision of Local Public Services: Capitalization under School Choice Programs,” 57(2) Journal of Urban Economics 275-301. Reinhard, R.M. 1981. “Estimating Property Tax Capitalization: A Further Comment,”
89(6) Journal of Political Economy 1251-1260.
Rohe, W.M., and L.S. Stewart. 1996. “Homeownership and Neighborhood Stability,” 7(1) Housing Policy Debate 37-81.
Stadelmann, D., and R. Eichenberger. 2008. “Debt Capitalization: A New Perspective on Ricardian Equivalence,” CREMA Working Paper Series, WP 2008-30, Center for Research in Economics, Management and the Arts (CREMA). Starrett, D.A. 1981. “Land Value Capitalization in Local Public Finance,” 89(2) Journal
of Political Economy 306-327.
Stull, W.J., and J.C. Stull. 1991. “Capitalization of Local Income Taxes,” 29(2) Journal of Urban Economics 182-190.
Tiebout, C.M. 1956. “A Pure Theory of Local Expenditures,” 64(5) Journal of Political Economy 416-424.
Yinger, J. 1981. “Capitalization and the Median Voter,” 71(2) American Economic Review, Papers and Proceedings 99-103.
_______. 1982. “Capitalization and the Theory of Local Public Finance,” 90(5) Journal of Political Economy 917-943.
_______, H.S. Bloom, A. Börsch-Supan, and H.F. Ladd. 1988. Property Taxes and House Values: The Theory and Estimation of Intrajurisdictional Property Tax Capitalization. Boston, MA: Academic Press.