INFECTION CONTROL A N D HOSPITAL EPIDEMIOLOGY FEBRUARY 2 0 1 3 , VOL. 3 4 , NO. 2
O R I G I N A L A R T I C L E
Burden of Bloodstream Infection Caused by Extended-Spectrum
/3-Lactamase-Producing Enterobacteriaceae Determined Using
Multistate Modeling at a Swiss University Hospital and
a Nationwide Predictive Model
Andrew Stewardson, MBBS;1 Carolina Fankhauser, MS;1 Giulia De Angelis, MD;2 Peter Rohner, PhD;3
Edith Safran, MD;3 Jacques Schrenzel, MD;4 Didier Pittet, MD;1 Stephan Harbarth, MD1
OBJECTIVE. To obtain an unbiased estimate of the excess hospital length of stay (LOS) and cost attributable to extended-spectrum j3-lactamase (ESBL) positivity in bloodstream infections (BSIs) due to Enterobacteriaceae.
DESIGN. Retrospective cohort study.
SETTING. A 2,200-bed academic medical center in Geneva, Switzerland. PATIENTS. Patients admitted during 2009.
METHODS. We used multistate modeling and Cox proportional hazards models to determine the excess LOS and adjusted end-of-LOS hazard ratio (HR) for ESBL-positive and ESBL-negative BSI. We estimated economic burden as the product of excess LOS and average bed-day cost. Patient-level accounting data provided a complementary analysis of economic burden. A predictive model was fitted to national surveillance data.
RESULTS. Thirty positive and 96 negative BSI cases were included. The excess LOS attributable to positive and ESBL-negative BSI was 9.4 (95% confidence interval [CI], 0.4-18.4) and 2.6 (95% CI, 0.7-5.9) days, respectively. ESBL positivity was therefore associated with 6.8 excess days and CHF 9,473 per BSI. The adjusted end-of-LOS HRs for ESBL-positive and ESBL-negative BSI were 0.62 (95% CI, 0.43-0.89) and 0.90 (95% CI, 0.74-1.10), respectively. After reimbursement, the average financial loss per acute care episode in ESBL-positive BSI, ESBL-negative BSI, and control cohorts was CHF 48,674, 48,131, and 13,532, respectively. Our predictive model estimated that the nationwide cost of third-generation cephalosporin resistance would increase from CHF 2,084,000 in 2010 to CHF 3,526,000 in 2015.
CONCLUSIONS. This is the first hospital-wide analysis of excess LOS attributable to ESBL positivity determined using multistate modeling to avoid time-dependent bias. These results may inform health-economic evaluations of interventions targeting ESBL control.
Infect Control Hosp Epidemiol 2013;34(2):133-143
The past 2 decades have witnessed a rapid global increase in is the key driver of its cost from the hospital perspective.7"9 extended-spectrum /3-lactamase (ESBL) production by En- Estimation of this figure, however, is hampered by several terobacteriaceae causing both healthcare- and community- methodological challenges.410 An accurate estimation must associated infections.1,2 ESBLs threaten the utility of com- account for the competing risks of death and increased LOS511 monly used empiric antibiotic therapy and have been and for time-dependent bias.12 Failing to explicitly address associated with both delayed initiation of appropriate anti- the timing and onset of infection will always result in an biotic therapy and excess mortality.3"6 It is important to gain overestimation of the attributable hospital LOS and therefore an accurate appreciation of the economic burden of ESBL- of cost.101314 Multistate models account for competing out-producing bacteria to justify the prioritization of infection comes and time-dependent bias1115 and have not been used control and antibiotic stewardship interventions required to to evaluate the burden of infection by ESBL-positive
organ-confront this problem.7 isms outside the intensive care context.16
The excess length of stay (LOS) associated with an infection The primary aim of this study was to quantify the economic
Affiliations: 1. Infection Control Program, University of Geneva Hospitals and Faculty of Medicine, Geneva, Switzerland; 2. Division of Infectious Diseases, Universita Cattolica Sacro Cuore, Rome, Italy, 3. Health-Economic Unit, University of Geneva Hospitals and Faculty of Medicine, Geneva, Switzerland; 4. Clinical Microbiology Laboratory, Service of Infectious Diseases, University of Geneva Hospitals, Geneva, Switzerland.
Received July 2, 2012; accepted September 24, 2012; electronically published December 18, 2012.
134 INFECTION CONTROL A N D HOSPITAL EPIDEMIOLOGY FEBRUARY 2 0 1 3 , VOL. 3 4 , N O . 2 0. Admission / 1. BSI due to Enterobacteriaceae (ESBL positive or negative)
/ \
2. Discharge or deathFIGURE i. Representation of the multistate model adopted for this analysis. Every patient enters the model at state 0 (hospital admission, no bloodstream infection [BSI] detected). Death or final discharge from acute care is modeled by transition into state 2, which can occur with or without transition through state 1 (onset of BSI). ESBL, extended-spectrum /3-lactamase.
burden attributable to ESBL production among Enterobac-teriaceae by using multistate modeling to estimate excess LOS associated with bloodstream infection (BSI) due to ESBL-positive and ESBL-negative isolates and then to extrapolate the excess cost due to ESBL positivity from the hospital per-spective by using the average bed-day cost. The secondary aim was to develop a predictive model for the burden of third-generation cephalosporin resistance among Enterobac-teriaceae causing BSIs throughout Switzerland.
M E T H O D S
Setting and Study Design
The University of Geneva Hospitals (HUG), a 2,200-bed pri-mary and tertiary center, is the only major public hospital in the Swiss canton of Geneva and provides both acute and nonacute care to a population of 450,000 people. We studied 3 parallel cohorts of patients admitted between January 1 and December 31, 2009: (1) those with BSI due to ESBL-positive Enterobacteriaceae, (2) those with BSI due to ESBL-negative Enterobacteriaceae, and (3) those without BSI due to Entero-bacteriaceae. This was a retrospective, observational cohort study incorporating data from a prospective hospital-based BSI surveillance system.1718 Approval was granted by the In-ternal Medicine Ethics Committee (HUG 11-022R). Definitions
An inpatient episode was defined as the period of continuous hospitalization from admission from outside HUG (or birth for newborns) until the last day of acute care (terminated by discharge, transfer, or death) and could include days in acute and nonacute care. Inpatient episodes consisting entirely of nonacute or psychiatric care were excluded. A BSI was defined as culture of any Enterobacteriaceae from at least 1 blood culture bottle and was designated primary or secondary ac-cording to Centers for Disease Control and Prevention def-initions.19 The date of infection was defined as the first day the BSI criteria were met. ESBL-positive BSI and neg-ative BSI were defined, respectively, as BSI due to
ESBL-positive and ESBL-negative Enterobacteriaceae. Inadequate initial antimicrobial therapy was defined as the failure to prescribe an antimicrobial agent that was appropriate for the treatment of BSI and to which the infecting organism was susceptible within 24 hours of the time of the BSI. Healthcare-associated and community-acquired infections were distin-guished as defined elsewhere.20
Patient Populations and Data Collection
The first cohort consisted of all inpatients with an ESBL-positive BSI during the study period. For each ESBL-ESBL-positive patient, 3 patients with ESBL-negative BSI from the same ward were selected for inclusion in the second cohort. Mul-tiple episodes of BSI for the same patient were included only if subsequent infections were not considered a relapse or the persistence of a previous episode. Patients were excluded if treatment with curative intent was not undertaken. For all patients with BSI, data on the following potential confound-ing covariates were collected: age, sex, hospital location at date of infection, healthcare-associated or community-acquired infection, infection site, bacterial species, adequacy of initial antibiotic treatment, intensive care unit (ICU) ad-mission, and comorbid conditions on hospital admission. All ESBL-positive BSIs and all healthcare-associated ESBL-neg-ative BSIs were prospectively included in a hospital-based BSI surveillance system. For patients with non-healthcare-asso-ciated ESBL-negative BSI, data were obtained retrospectively from electronic patient records.
The third cohort consisted of all patients with inpatient episodes commencing in 2009 during which a BSI due to Enterobacteriaceae did not occur. Data on age, sex, dates of discharge from acute ward or death, ICU admission, and surgical procedures were extracted retrospectively from elec-tronic hospital records. This method was also used to validate surveillance data for the 2 BSI cohorts.
Three predefined outcomes were examined: in-hospital mortality, excess LOS, and hospitalization costs measured from the hospital perspective. All included patients were ob-served until discharge or in-hospital death.
TABLE i. Baseline Characteristics of Patients Experiencing Bloodstream Infections (BSIs) due to Enterobacteriaceae
Characteristic Demographics
Male sex
Age, median ± SD, years Comorbidities
Cardiovasular disease COPD
Peripheral vascular disease Cerebrovascular disease Renal insufficiency Liver disease
Diabetes without end-organ damage Diabetes with end-organ damage HIV
Cancer
Immunosuppression Peptic ulcer disease Connective tissue disease N o commorbidity Epidemiological category
Healthcare associated Community acquired Ward at BSI onset
Medicine Surgery ICU Pediatrics Rehabilitation/geriatrics Gynecology/obstetrics Emergency Origin of infection Primary BSI Secondary BSI
Bone and joint Cardiovascular system Gastrointestinal system Pneumonia or LRTI Reproductive tract Skin a n d soft tissue Surgical site infection Urinary tract ICU admission Pathogen Escherichia coli Klebsiella species Proteus species Enterobacter species Other Enterobacteriaceae ESBL production
Inadequate initial antimicrobial therapy
Infection Patients with ESBL BSI (« = 30) 21 (70.0) 62 ± 16 3 (10.0) 1 (3.3) 3 (10.0) 8 (26.7) 2 (6.7) 3 (10.0) 10 (33.3) 3 (10.0) 0 (0) 8 (26.7) 7 (23.3) 2 (6.7) 0 (0) 8 (26.7) 16 (53.3) 14 (46.7) 7 (23.3) 7 (23.3) 1 (3.3) 1 (3.3) 3 (10.0) 1 (3.3) 10 (33.3) 10 (33.3) 20 (66.7) 0 (0) 0 (0) 2 (6.7) 0 (0) 1 (3.3) 0 (0) 1 (3.3) 17 (56.7) 8 (26.7) 25 (83.3) 2 (6.7) 0 (0) 1 (3.3) 2 (6.7) 14 (46.7) Non-ESBL BSI (n = 96) 60 (62.5) 67 ± 19 17 (17.7) 4 (4.2) 3 (3.1) 11 (11.5) 10 (10.4) 14 (14.6) 9 (9.4) 4 (4.2) 1 (1.0) 33 (34.4) 15 (15.6) 1 (1.0) 2 (2.1) 28 (29.2) 42 (43.8) 54 (56.2) 17 (17.1) 20 (20.8) 5 (5.2) 2 (2.1) 7 (7.3) 4 (4.2) 41 (42.7) 23 (24.0) 73 (76.0) 1 (1.0) 1 (1.0) 13 (13.5) 3 (3.1) 1 (1.0) 2 (2.1) 3 (3.1) 49 (51.0) 21 (21.9) 59 (61.5) 18 (18.8) 4 (4.2) 8 (8.3) 7 (7.3) 24 (25.0) P .454 .364 .400 .999 .146 .075 .730 .761 .003 .356 .999 .432 .332 .141 .999 .999 .358 .938 .308 .308 .999 .999 .519 .999 .421 .999 .999 .590 .586 .027 .155 .572 .685 .999 .024 Source Patients with HCA BSI (n = 58) 36 (62.1) 67 ± 13 11 (19.0) 3 (5.2) 4 (6.9) 9 (15.5) 6 (10.3) 4 (6.9) 11 (19.0) 4 (6.9) 0 ( 0 ) 25 (43.1) 14 (24.1) 0 (0.0) 2 (3.5) 12 (20.7) 18 (31.0) 21 (36.2) 4 (6.9) 0 ( 0 ) 10 (17.2) 1 (1.7) 4 (6.9) 24 (41.4) 34 (58.6) 0 ( 0 ) 0 ( 0 ) 5 (8.6) 2 (3.5) 0 ( 0 ) 1 (1-7) 4 (6.9) 22 (37.9) 18 (31.0) 35 (60.3) 12 (20.7) 2 (3.5) 5 (8.6) 4 (6.9) 16 (27.6) 18 (31.0) CABSI (n = 68) 45 (66.2) 63 ± 21 9 (13.2) 2 (2.9) 2 (2.9) 10 (14.7) 6 (8.8) 13 (19.1) 8 (11.8) 3 (4.4) 1 (1.5) 16 (23.5) 8 (11.8) 3 (4.4) 0 ( 0 ) 24 (35.3) 6 (8.8) 6 (8.8) 2 (2.9) 3 (4.4) 0 (0.0) 4 (5.9) 47 (69.1) 9 (13.2) 59 (86.8) 1 (1.5) 1 (1.5) 10 (14.7) 1 (1.5) 2 (2.9) 1 (1.5) 0 ( 0 ) 44 (64.7) 11 (16.2) 49 (72.1) 8 (11.8) 2 (2.9) 4 (5.9) 5 (7.4) 14 (20.6) 20 (29.4) P .632 .008 .380 .661 .413 .899 .772 .045 .260 .702 .999 .019 .068 .249 .210 .070 <.001 <.001 < 0 0 1 .999 .999 .293 .594 .499 .999 .042 .003 .048 .164 .172 .999 .731 .999 .358 .843 NOTE. Data are no. (%), unless otherwise indicated. CA, community acquired; COPD, chronic obstructive pulmonary disease; ESBL, extended-spectrum /3-lactamase; HCA, healthcare associated; HIV, human immunodeficiency virus; ICU, intensive care unit; LOS, length of stay; LRTI, lower respiratory tract infection; SD, standard deviation.
136 INFECTION CONTROL AND HOSPITAL EPIDEMIOLOGY FEBRUARY 2 0 1 3 , VOL. 3 4 , NO. 2
TABLE
2. Excess Length of Stay (LOS) and Hazard Ratios (HRs) for End of LOS Associated with Bloodstream
Infection (BSI) due to Extended-Spectrum ^-Lactamase (ESBL)-Positive and ESBL-Negative Enterobacteriaceae
HR (95% CI)
Excess LOS (95% CI), days Univariate Adjusted*
ESBL-positive BSI (compared with no BSI) 9.4 (0.4-18.4)" 0.52 (0.36-0.76) 0.62 (0.43-0.89)
ESBL-negative BSI (compared with no BSI) 2.6 (-0.7 to 5.9)
c0.75(0.62-0.92) 0.90(0.74-1.10)
NOTE. CI, confidence interval.
* Adjusted for age, sex, intensive care unit admission, and surgery.
bIn total, 30 ESBL-positive BSIs versus 96 ESBL-negative BSIs (censored at time of infection) and 42,476 patients
without BSI due to Enterobacteriaceae.
c
In total, 96 ESBL-negative BSIs versus 30 ESBL-positive BSIs (censored at time of infection) and 42,476 patients
without BSI due to Enterobacteriaceae.
Microbiological Testing
During the study period, blood culture specimens were
in-oculated into BACTEC Aerobic Plus/F and Lytic Anaerobic/
F vials and then incubated and monitored with the BACTEC
9240 system (BD Diagnostic Systems). Microorganisms were
identified using standard laboratory procedures.
Antimicro-bial susceptibilities and ESBL status were determined by the
disk diffusion method, in accordance with Clinical and
Lab-oratory Standards Institute guidelines.
21ESBL confirmation
was performed using a combination of 4 disks: cefotaxime
versus cefotaxime/clavulanate and ceftazidime versus
cefta-zidime/clavulanate. Isolates were declared ESBL positive
whenever the inhibition zone around the disk containing
clavulanate was at least 5 mm larger than that of the disk
containing the same cephalosporin but without clavulanate.
Excess LOS Estimation
A multistate model approach was used to estimate the excess
LOS due to ESBL-positive BSI and ESBL-negative BSI, with
excess LOS attributable to ESBL positivity then computed as
the difference between the outputs of these 2 analyses. The
occurrence of BSI was the time-dependent exposure, while
final discharge from acute care (or in-hospital death) was the
study end point (Figure 1). Patients with ESBL-negative BSI
were administratively censored from the date of their
infec-tion when assessing LOS due to ESBL-positive BSI.
15Likewise,
patients with ESBL-positive BSI were censored at infection
onset when assessing LOS due to ESBL-negative BSI.
Non-parametric estimation of transition probabilities was
per-formed using the Aalen-Johansen estimator to provide the
matrix of transition probabilities, as described elsewhere.
11,15'
22The mean difference in LOS (in days) was computed for each
day as the difference between the predicted LOS given the
intermediate state ("onset of BSI") being reached or not
reached on that day. The overall change in LOS was then
computed as an average of these quantities, weighted by the
time to BSI among infected patients. Standard errors and
confidence intervals (CIs) were derived by 500 bootstrap
re-sampling runs.
15To compare the instantaneous risk of the 2 BSI cohorts
reaching the end point (discharge from acute care or death),
the end-of-LOS hazards over the course of time were
cal-culated. End-of-LOS hazard was defined as the number of
discharged patients (dead or alive) on a given day divided by
the number of patients still hospitalized at the beginning of
that day. The Nelson-Aalen estimator was used to describe
the cumulative transition hazards over the course of time.
23To assess the independent effect of positive and
ESBL-negative BSI on LOS, they were evaluated as time-dependent
covariates using Cox proportional hazards models to estimate
the end-of-LOS hazard ratio (HR). Variables for adjustment
included age, sex, ICU admission, and surgery during the
current hospitalization.
LOS analysis was performed using R, version 2.10.1 (R
Development Core Team), an open-source language for
sta-tistical computing and graphics. All other analyses were
per-formed using Stata, version 11 (StataCorp).
Cost Estimation
Total cost accounting charges were divided by the number of
bed-days in acute and nonacute care to obtain an average
cost of a hospital bed-day in 2009, excluding psychiatry. The
excess cost due to ESBL positivity from the hospital
per-spective was estimated as the product of this average
bed-day cost and the excess LOS attributed to ESBL positivity
during the study period.
7Costs were computed in 2009 Swiss
francs (CHF).
A concurrent patient-level cost analysis was performed. In
2009, HUG used a microcosting system that identified and
aggregated the variable- and fixed-cost components of patient
activities, hospital services, and products according to the date
of service.
24,25Each acute care episode was assigned a
diag-nosis-related group (DRG) according to the Swiss adaptation
of the All Patient DRG system based on International
Statis-tical Classification of Diseases and Related Health Problems,
10th Revision diagnostic codes,
26Classification Suisse des
In-terventions Chirurgicales (CHOP) intervention codes,
27and
administrative data. Each DRG had an assigned "cost
weight-ing," a factor by which the base rate (approximately CHF
12,000 for HUG in 2009) was multiplied to calculate the
BURDEN OP ESBL-POSITIVE BSI I 3 7
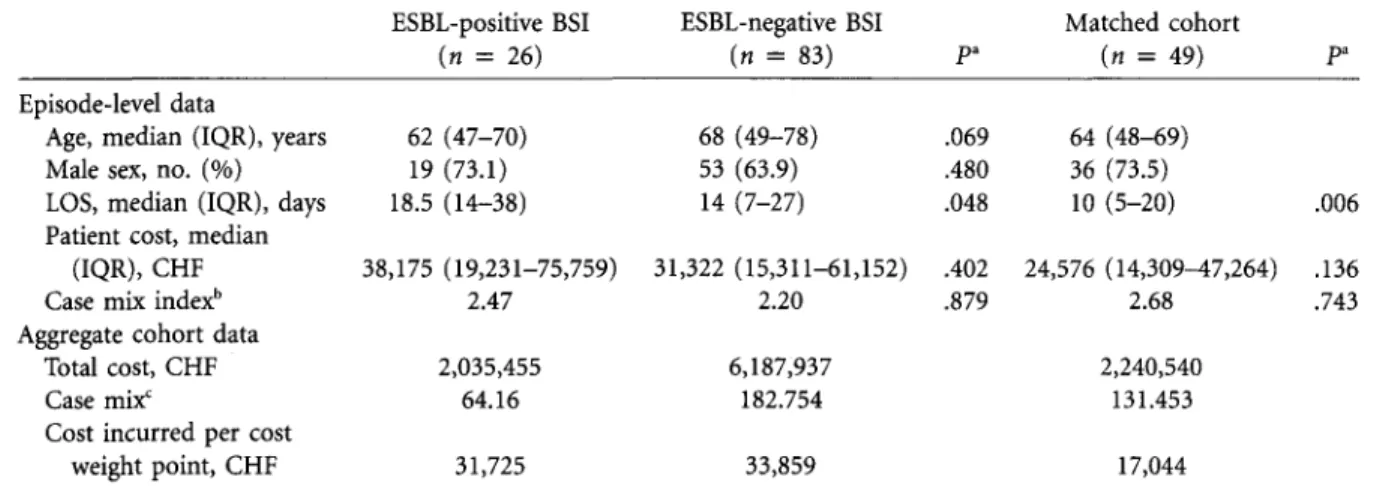
TABLE 3. Nested Patient-Level Analysis of Costing and Coding Data for the Acute Care Stay of Patients with Extended-Spectrum /3-Lactamase (ESBL)-Positive Bloodstream Infection (BSI), Patients with ESBL-Negative BSI, and Patients Matched with the ESBL-Positive Cohort on the Basis of Age, Sex, and Diagnosis-Related Group
ESBL-positive BSI ESBL-negative BSI Matched cohort
(n = 26) (n = 83) Pa (« = 49) Pa
Episode-level data
Age, median (IQR), years 62 (47-70) 68 (49-78) .069 64 (48-69) Male sex, no. (%) 19 (73.1) 53 (63.9) .480 36 (73.5)
LOS, median (IQR), days 18.5 (14-38) 14 (7-27) .048 10 (5-20) .006 Patient cost, median
(IQR), CHF 38,175 (19,231-75,759) 31,322 (15,311-61,152) .402 24,576 (14,309^7,264) .136
Case mix indexb 2.47 2.20 .879 2.68 .743
Aggregate cohort data
Total cost, CHF 2,035,455 6,187,937 2,240,540 Casemix' 64.16 182.754 131.453 Cost incurred per cost
weight point, CHF 31,725 33,859 17,044 NOTE. IQR, interquartile range; LOS, length of stay.
" Testing the null hypothesis that there is no difference compared with the ESBL-positive BSI cohort.
b Average cost weight points for episodes in cohort. c
Sum of cost weight points for all episodes in cohort.
amount potentially billable for that acute care episode.28 For each patient in acute care at the time of BSI detection, we extracted the individual, itemized costs and the cost weighting of their acute care stay. We also selected an alternate com-parator group by matching each ESBL-positive patient with 2 patients from the non-BSI cohort on the basis of sex, age, and identical DRG. The case mix (sum of cost weights) and case mix index (average cost weight) for each cohort was calculated. Two measures were used to compare the economic burden of each cohort from the hospital perspective: (1) the difference between costs incurred and the potentially billable amount and (2) the costs incurred per cost weight unit.
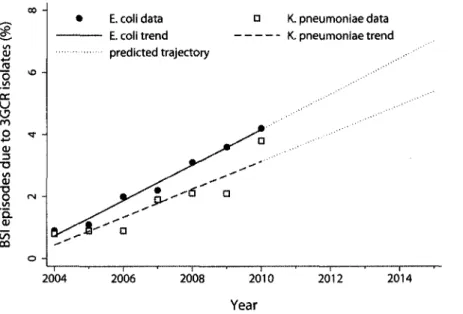
Predictive Model
On the basis of data from 2004-2010 published by Anresis.ch, the Swiss center for surveillance of antibiotic resistance, we used linear regression to fit a predictive model for the burden of BSI due to third-generation cephalosporin-resistant Esch-erichia coli and Klebsiella pneumoniae throughout Switzer-land.29 After extrapolating available data nationally, we used this model to estimate the number of BSIs due to these isolates from 2011 to 2015. This figure was then multiplied by our estimate of the excess LOS attributable to ESBL positivity to derive the national burden of resistance from the hospital perspective. The average cost of a bed-day in Switzerland was estimated from Swiss Federal Office of Statistics reports for 2010 by dividing the total charges for hospital care by the total number of bed-days, after excluding psychiatric care.30 This model incorporates 3 main assumptions: (1) that the excess LOS attributable to ESBL positivity among Entero-bacteriaceae in our institution was equivalent to that of third-generation cephalosporin resistance among E. coli and K. pneumoniae throughout Switzerland, (2) that the number of
BSIs due to these 2 bacteria each year will remain constant, and (3) that diagnostic testing and empiric antibiotic treat-ment remain constant.
R E S U L T S
Thirty-nine patients with ESBL-positive BSI and 113 patients with ESBL-negative BSI were initially included. After exclud-ing episodes without acute care admission and 1 patient treated without curative intent, 30 ESBL-positive and 96 ESBL-negative inpatient episodes remained. These involved 124 patients, with 2 patients included twice. The median age was 68 (interquartile range [IQR], 55-78) years, 81 (64%) were male, and 68 (54%) of the infections were community acquired. The proportion of infections that were healthcare associated was similar for ESBL-negative and ESBL-positive infections (P = .36). Notably, 47% of patients with ESBL-positive BSI received inappropriate initial antibiotic treat-ment, compared with 25% of those with ESBL-negative BSI (P = .024). In each group, 3 patients never received appro-priate antibiotic treatment. For those who did, the median delay from BSI until appropriate antibiotic therapy was 15 (IQR, 3-43) and 11 (IQR, 4-23) hours for ESBL-positive and ESBL-negative BSI, respectively (P = .186). Characteristics of patients with BSI are shown in Table 1. The non-BSI cohort consisted of 42,476 patients; their median age was 49 (IQR, 27-71) years, and 19,455 (45%) were male.
In-Hospital Mortality
Six patients (20%) with ESBL-positive BSI and 10 patients (10%) with ESBL-negative BSI died (P = .17). When ad-justed for baseline characteristics (sex, age, healthcare or com-munity attribution, and department at time of BSI were
re-TABL E 4 . Studie s Examinin g th e Exces s Lengt h o f Sta y (LOS ) an d Cos t Associate d wit h Extended-Spectru m j3-Lactamas e (ESBL ) Productio n (o r Third-Generatio n Cephalospori n Resistanc e [3GCR] ) i n Bloodstrea m Infection s (BSIs ) Method s Effect s attribute d t o resistanc e Stud y Lautenbac h e t al 3 8 Blo t e t al 3 9 Schwabe r e t al 3 Melze r an d Petersen 5 Mauldi n e t al 1 3 Design , setting , stud y period , countr y Matche d case-contro l study" ' 725-be d academi c tertiar y cente r Ju n 1997-Ma y 199 8 US A Retrospectiv e cohor t Single-cente r IC U Ja n 1992-De c 200 0 Belgiu m Retrospectiv e cohor t 1,200-be d academi c tertiar y cente r Ja n 2000-De c 200 3 Israe l Prospectiv e cohor t Singl e cente r Ju n 2003-No v 200 5 U K Retrospectiv e cohor t Singl e cente r Ja n 2000-Ju n 200 8 US A Infection , bacteria , resistanc e Al l infection s E. colt, K. pneumoniae ESB L Nosocomia l BS I Gram-negativ e bacteri a Ceftazidime 0 BS I E. coli, Klebsiella spp. , Proteus spp . ESB L BS I E. coli ESB L HA I Gram-negativ e bacteri a Nonsusceptibl e t o quinolones , pi -peracillin , carbapenems , o r ex -tended-spectru m cephalosporin s No . resistant ; no . susceptibl e Tim e dependenc e Exces s LOS * Exces s cos t 33 ; 6 6 120 ; 20 8 99 ; 9 9 46 ; 30 8 193 ; 46 9 No t addresse d Media n LO S 1.2 3 time s greate r 1.7 1 time s highe r fo r No t addresse d Partiall y accounte d for* 1 No t addresse d No t addresse d fo r case s tha n fo r control s afte r adjustmen t (95 % CI , 0.81-1.87) ; P = .3 4 Media n LO S afte r BSI : 1 1 (IQR , 5-20 ) v s 1 0 (IQR , 3-19) ; P = .32 1 Multiplicativ e effect : 1.56 ; P < .00 1 Media n LOS : 9 v s 12 ; P = .11 1 Additiona l 23.8 % afte r adjust -men t (IQR , 11.0%-36.6%) ; P = .0003 . case s afte r adjustmen t (95 % CI , 1.01-2.88) ; P = .0 4 N A Multiplicativ e effect : 1.57;P<.00 3 N A Additiona l 29.3 % afte r adjustmen t (IQR , 16.2-42.4) ; P -c.0001 .
Tumbarell o e t al 3 5 Yan g e t al * d e Krake r e t al 3 * Lamber t e t al " Thi s stud y Retrospectiv e cohor t 1,600-be d academi c hospita l Ja n 2006-De c 200 6 Ital y Retrospectiv e cohor t 2,000-be d medica l cente r Ja n 2006-Ju n 200 8 Taiwa n Prospectiv e paralle l matche d cohor t 1 3 tertiar y car e center s Ju l 2007-Ju n 200 8 1 3 Europea n countrie s Prospectiv e cohor t stud y 53 7 ICU s Ja n 2005-De c 200 8 10 Europea n countrie s Retrospectiv e cohor t stud y 2,200-be d universit y hospita l Ja n 2009-De c 200 9 Switzerlan d BS I E. coli ESB L Community-onse t E . coli, K. pneumot ESB L BS I E. coli 3GC R BS I E. coli 3GC R BS I Enterobacteriacea e ESB L 37 ; 9 7 No t addresse d Mea n ± SD : 2 0 ± 1 7 v s 13 ± 9 ; P = .0 2 €5,02 6 attributabl e t o ESB L 12 ; 4 6 No t addresse d Mea n ± SD : 16. 3 ± 9. 3 v s US D 615. 1 ± 423. 5 v s 7. 9 ± 5.2 ; P = .01 0 252. 8 ± 269.2 ; P = .014 e 111 ; 1,11 0 Partiall y Adjuste d extr a LOS : 5. 0 day s N A accounte d foi ^ (95 % CI , 0.4-10.2 ) 42 ; 21 8 Accounte d fo r Adjuste d end-of-LO S HR : 1.0 9 N A (95 % CI , 0.76-1.58 ) 30 ; 9 6 Accounte d fo r Adjuste d end-of-LO S HR : 0.6 2 CH F 9,47 3 (95 % CI , 0.43-0.89 ) Extr a LOS : 6. 8 day s NOTE . CI , confidenc e interval ; HAI , healthcare-associate d infection ; ICU , intensiv e car e unit ; IQR , interquartil e range ; NA , no t assessed ; SD , standar d deviation ; UTI , urinar y trac t infection . * Univariat e compariso n o f LO S i n day s afte r BS I onse t (resistan t v s susceptible) , unles s otherwis e stated . Whe n multivariabl e analysi s wa s performed , onl y th e adjuste d resul t i s presented . b Matche d b y infectin g organism , anatomi c sit e o f infection , an d dat e o f isolation . c Resistanc e amon g Pseudomonas specie s wa s define d b y resistanc e t o on e o f piperacillin , ciprofloxacin , ceftazidime , o r imipenem . d Outcome s adjuste d fo r LO S prio r t o bacteremia . e Cos t o f antibioti c therap y only . ' Patient s wit h BS I wer e matche d fo r LO S befor e BS I wit h control s withou t BSI .
1 4 0 INFECTION CONTROL AND HOSPITAL EPIDEMIOLOGY FEBRUARY 2 0 1 3 , VOL. 3 4 , NO. 2 01 4-» JS o .— cc u <J m o +-» 01 3 "O wi O) T5 O '5. 01 en oo VO t (N o -• i ' E. coli data E. coli trend predicted trajectory a i • i a D " a .** * i K. pneumoniae data K. pneumoniae trend i i • 2004 2006 2008 2010 2012 2014 Year
FIGURE 2. Trends in the estimated number of bloodstream infections (BSIs) due to third-generation cephalosporin-resistant (3GCR)
Escherichia coli and Klebsiella pneumoniae in Switzerland. Extrapolated from Anresis.ch data for 2004-2010, with future trajectories for
2011-2015 based on linear regression analysis.
tained), the independent effect of ESBL production on inpatient mortality was not significant (odds ratio, 2.8 [95% CI, 0.7-11.5]; P = .15).
LOS
The median total LOS for patients with ESBL-positive BSI and ESBL-negative BSI was 22.5 (IQR, 14-61) and 14.5 (IQR, 7-32.5) days, respectively (P = .04). The results of multistate modeling for excess LOS are presented in Table 2. Compared with negative controls, BSI due to Enterobacteriaceae was associated with an excess LOS whether due to ESBL-positive or ESBL-negative isolates. BSI due to ESBL-negative bacteria did not significantly decrease the hazard of discharge after adjustment for confounding (HR, 0.90 [95% CI, 0.74-1.10]). However, ESBL positivity was associated with 6.8 days of excess LOS compared with ESBL-negative BSI and a signif-icantly reduced hazard of discharge (HR, 0.62 [95% CI, 0.43-0.89]).
Cost
The estimated cost for provision of an occupied bed-day in 2009 was CHF 1,391 on average for all acute care and non-acute care beds. This means that ESBL positivity leads to an excess cost of CHF 9,473 per BSI due to Enterobacteriaceae. For the 30 patients with ESBL-positive BSI in 2009, this amounts to a total burden of CHF 284,190 from the hospital perspective.
For patient-level cost analysis, 26 and 83 patients were included from the ESBL-positive and ESBL-negative cohorts, respectively. In addition, 51 patients from the non-BSI cohort were matched with the ESBL-positive patients on the basis
of age, sex, and DRG. The costs, case mix index, and cost per cost weight for these cohorts are presented in Table 3. The average loss, calculated as the difference between costs incurred in the provision of care and the amount potentially billable from health insurance companies per acute care ep-isode for patients in the ESBL-positive BSI, ESBL-negative BSI, and control cohorts, was CHF 48,674, 48,131, and 13,532, respectively. The cost incurred per cost weight point for the ESBL-positive BSI, ESBL-negative BSI, and DRG-matched groups were CHF 31,725, 33,859, and 17,044, re-spectively, demonstrating that both BSI cohorts represent resource-intensive subgroups from a hospital accounting per-spective. As a benchmark, the average cost incurred per cost weight point for public patients admitted to HUG in 2009 was CHF 12.708.31
Predictive Model
Both visual inspection and the coefficients of determination
(R2) supported application of a linear regression model: 98%
and 83% of the variation in the number of BSIs due to third-generation cephalosporin-resistant E. coli and K. pneumoniae, respectively, could be explained by the year alone during the period 2004-2010 (Figure 2). For E. coli and K. pneumoniae, the regression coefficients were 0.57 and 0.45, respectively. This model estimated that the proportion of third-generation cephalosporin-resistant isolates causing BSI would increase from 4.0% in 2010 to 6.7% in 2015. During the same period, the number of bed-days attributable to third-generation cephalosporin resistance nationally would increase from 1,300 in 2010 to 2,200 in 2015, equivalent to an accounting cost increase from CHF 2,084,000 to 3,526,000.
B U R D E N OF E S B L - P O S I T I V E BSI 141
D I S C U S S I O N
In patients experiencing BSI due to Enterobacteriaceae, we
found that ESBL production is associated with a significant
excess LOS and, hence, economic burden from the hospital
perspective. To our knowledge, this is the first study to employ
multistate modeling in the estimation of excess LOS
attrib-utable to ESBL production outside the ICU setting. The
strength of this approach is that it accounts for time
depen-dency and competing outcomes. In contrast, neither
adjust-ment for time to infection as baseline covariate or matching
for time to infection can adequately account for
time-dependent bias while still including all eligible patients.
7,12There are several possible explanations why antimicrobial
resistance could be associated with increased LOS.
32The first
is inadequate controlling for confounding covariates intrinsic
to either the patient, such as severity of illness and comorbid
conditions, or the infecting agent, such as the presence of a
hypervirulent ESBL-positive clone.
33The second is treatment
related, such as delay of appropriate antimicrobial therapy,
6,34increased treatment toxicity (such as renal impairment
sec-ondary to aminoglycosides), need for surgery, or lack of an
active oral agent to facilitate early discharge with outpatient
completion of antibiotic therapy. In our study, patients with
ESBL-positive BSI were less likely to receive appropriate
an-tibiotic treatment within 24 hours (Table 1).
The key features and results of recent studies reporting the
excess LOS and cost associated with ESBL-production or
third-generation cephalosporin resistance among
Enterobac-teriaceae are listed in Table 4. In a single-center retrospective
study, Tumbarello et al
35found that ESBL production in E.
coli causing BSI was associated with an excess LOS of 7 days
and a cost of €5,026 (CHF 7,634 in 2009). De Kraker et al
36performed a multicenter prospective matched cohort study
involving 13 European hospitals and estimated an excess LOS
of 5 days attributable to third-generation cephalosporin
re-sistance in BSIs caused by E. coli. While both are otherwise
robust studies, we would contend that neither the direct
com-parison of post-BSI-onset LOS between ESBL and non-ESBL
BSI used by the former study or the matching and adjustment
used by the latter adequately account for time-dependent bias.
Regardless, the estimates of excess LOS attributable to
ESBL-producing bacteria in those studies are close to ours (Table
4). Interestingly, data from the latter study were used to
in-form a recent estimate of the cost of BSI due to ESBL-positive
E. coli in Europe as €18.1 million.
37This study has several limitations. First, the single-center
setting limits external validity. Generalizability would be
sen-sitive, for example, to local variation in empiric antibiotic
therapy for sepsis and frequency of inadequate initial
anti-microbial therapy. Second, we did not take into account
in-fections other than BSI. This increased the specificity of true
infection among included patients but underestimated the
total burden of infections caused by ESBL-positive
Entero-bacteriaceae. Third, we estimated the economic burden of
ESBL production as the product of the excess LOS attributed
to ESBL positivity and the average accounting cost of a
bed-day, including fixed and variable costs.
7This standard
tech-nique does not account for the fact that fixed costs cannot
be regained by the hospital in the short term and may
thefore provide an overestimate of the economic burden of
re-sistance.
7,8In contrast, episodes of readmission were not
ex-amined and costs from patient and community perspectives
were not considered, thereby underestimating the total
burden.
In summary, this study found that ESBL positivity
con-ferred a significant health and economic burden among
pa-tients with BSI caused by Enterobacteriaceae. Future research
should test the generalizability of this result and advance the
techniques used to estimate the opportunity cost of
anti-microbial resistance. Regardless, this study provides useful
information for those seeking financial support for
interven-tions to reduce the dissemination of ESBL-positive
Entero-bacteriaceae.
A C K N O W L E D G M E N T S
We gratefully acknowledge the contribution to this study by Marie-Noelle Chrai'ti and members of the Infection Control Program, University of Geneva Hospitals. This work was performed during the PhD of A.S. at the Depart-ment of Medicine, University of Melbourne.
Financial support. This investigator-initiated project was supported by
Pfizer. The sponsor did not interfere with study design, analysis, and pub-lication of the results. A.S., C.F., G.D.A., J.S., and S.H. received funding from the European Commission (FP7-HEALTH-2009-SINGLE STAGE-SATURN contract 241796, MOSAR network contract LSHP-CT-2007-037941, and R-Gnosis contract 282512).
Potential conflicts of interest. S.H. reports that he has received consultant
and speaker honoraria from bioMerieux, Da Volterra, and Destiny Pharma. J.S. reports that he is chief medical advisor for bioMerieux. All other authors report no conflicts of interest relevant to this article. All authors submitted the ICMJE Form for Disclosure of Potential Conflicts of Interest, and the conflicts that the editors consider relevant to this article are disclosed here. Address correspondence to Stephan Harbarth, MD, Service de Prevention et Contrdle de lTnfection, H6pitaux Universitaires de Geneve, Rue Gabrielle-Perret-Gentil 4, CH-1211 Geneve 14, Switzerland (stephan.harbarth@hcuge .ch).
Presented in part: 22nd European Congress of Clinical Microbiology and Infectious Diseases; London, United Kingdom; March 31—April 3, 2012 (Ab-stract P-1863).
R E F E R E N C E S
1. Livermore DM, Canton R, Gniadkowski M, et al. CTX-M: changing the face of ESBLs in Europe. / Antimicrob Chemother 2007;59:165-174.
2. Hawkey PM, Jones AM. The changing epidemiology of resis-tance. J Antimicrob Chemother 2009;64(suppl I):i3-il0. 3. Schwaber MJ, Navon-Venezia S, Kaye KS, Ben-Ami R, Schwartz
D, Carmeli Y. Clinical and economic impact of bacteremia with extended-spectrum-/3-lactamase-producing Enterobacteriaceae.
Antimicrob Agents Chemother 2006;50:1257-1262.
142 INFECTION CONTROL A N D HOSPITAL EPIDEMIOLOGY FEBRUARY 2 0 1 3 , VOL. 3 4 , N O . 2
associated with extended-spectrum /3-lactamase production in Enterobacteriaceae bacteraemia: a systematic review and meta-analysis. JAntimicrob Chemother 2007;60:913-920.
5. Melzer M, Petersen I. Mortality following bacteraemic infection caused by extended spectrum beta-lactamase (ESBL) producing E. coli compared to non-ESBL producing E. coll J Infect 2007; 55:254-259.
6. Hyle EP, Lipworth AD, Zaoutis TE, Nachamkin I, Bilker WB, Lautenbach E. Impact of inadequate initial antimicrobial therapy on mortality in infections due to extended-spectrum /3-lacta-mase-producing Enterobacteriaceae: variability by site of infec-tion. Arch Intern Med 2005;165:1375-1380.
7. Graves N, Harbarth S, Beyersmann J, Barnett A, Halton K, Cooper B. Estimating the cost of health care-associated infec-tions: mind your p's and q's. Clin Infect Dis 2010;50:1017-1021. 8. Graves N. Economics and preventing hospital-acquired
infec-tion. Emerg Infect Dis 2004;10:561-566.
9. Brun-Buisson C, Roudot-Thoraval F, Girou E, Grenier-Sennelier C, Durand-Zaleski I. The costs of septic syndromes in the in-tensive care unit and influence of hospital-acquired sepsis. In-tensive Care Med 2003;29:1464-1471.
10. Maragakis LL, Perencevich EN, Cosgrove SE. Clinical and eco-nomic burden of antimicrobial resistance. Expert Rev Anti Infect Ther 2008;6:751-763.
11. Beyersmann J, Wolkewitz M, Allignol A, Grambauer N, Schu-macher M. Application of multistate models in hospital epi-demiology: advances and challenges. Biom J 2011;53:332-350. 12. Beyersmann J, Kneib T, Schumacher M, Gastmeier P. Noso-comial infection, length of stay, and time-dependent bias. Infect Control Hosp Epidemiol 2009;30:273-276.
13. Mauldin PD, Salgado CD, Hansen IS, Durup DT, Bosso JA. Attributable hospital cost and length of stay associated with health care-associated infections caused by antibiotic-resistant gram-negative bacteria. Antimicrob Agents Chemother 2010;54: 109-115.
14. Barnett AG, Beyersmann J, Allignol A, Rosenthal VD, Graves N, Wolkewitz M. The time-dependent bias and its effect on extra length of stay due to nosocomial infection. Value Health 2011;
14:381-386.
15. De Angelis G, Allignol A, Murthy A, et al. Multistate modelling to estimate the excess length of stay associated with meticillin-resistant Staphylococcus aureus colonisation and infection in sur-gical patients. / Hosp Infect 2011;78:86-91.
16. Lambert ML, Suetens C, Savey A, et al. Clinical outcomes of health-care-associated infections and antimicrobial resistance in patients admitted to European intensive-care units: a cohort study. Lancet Infect Dis 2011;11:30-38.
17. Eggimann P, Harbarth S, Constantin MN, Touveneau S, Chev-rolet JC, Pittet D. Impact of a prevention strategy targeted at vascular-access care on incidence of infections acquired in in-tensive care. Lancet 2000;355:1864-1868.
18. Harbarth S, Rohner P, Auckenthaler R, Safran E, Sudre P, Pittet D. Impact and pattern of gram-negative bacteraemia during 6 y at a large university hospital. Scand J Infect Dis 1999;31:163-168. 19. Horan TC, Andrus M, Dudeck MA. CDC/NHSN surveillance definition of health care-associated infection and criteria for specific types of infections in the acute care setting. Am J Infect Control 2008;36:309-332.
20. Friedman ND, Kaye KS, Stout JE, et al. Health care-associated bloodstream infections in adults: a reason to change the accepted
definition of community-acquired infections. Ann Intern Med 2002;137:791-797.
21. Clinical and Laboratory Standards Institute (CLSI). Performance Standards for Antimicrobial Susceptibility Testing: Approved Stan-dard M7-A7. Wayne, PA: CLSI, 2006.
22. Aalen O, Johansen S. An empirical transition matrix for non-homogeneous Markov chains based on censored observations. Scand J Stat 1978;5:141-150.
23. Andersen PK, Borgan O, Gill RD, Keiding N. Statistical models based on counting processes. New York: Springer, 1993. 24. Hdpitaux universitaires de Geneve. Guide pratique de
comp-tabiliti analytique pour les hdpitaux latins compatible avec REKOLE®. http://comptabilite-analytique.hug-ge.ch/_library /pdf/GUIDE_PRATIQUE_CAE.pdf. Published 2009. Accessed July 19, 2012.
25. Hugonnet S, Eggimann P, Borst F, Maricot P, Chevrolet JC, Pittet D. Impact of ventilator-associated pneumonia on resource uti-lization and patient outcome. Infect Control Hosp Epidemiol 2004;25:1090-1096.
26. World Health Organization (WHO). International Statistical Classification of Diseases and Related Health Problems, 10th Re-vision. Geneva: WHO, 2007.
27. Swiss Federal Office of Statistics. Classification Suisse des Inter-ventions Chirurgicales (CHOP) version 11. http://www.bfs.admin .ch/bfs/portal/fr/index/infothek/nomenklaturen/blank/blank /chop/02.html#parsys_50214. Published 2008. Accessed July 19, 2012.
28. Club d'utilisateurs APDRG Suisse. APDRG Suisse website. http://www.apdrgsuisse.ch. Published 2004. Accessed July 14, 2012.
29. Kronenberg A, Hilty M, Muhlemann K. Temporal trends of Enterobacteriaceae with resistance to higher generation cepha-losporines in Switzerland, 2004 to 2010. In: Program and Ab-stracts of the 21st European Congress of Clinical Microbiology and Infectious Diseases. May 7-10, 2011; Milan, Italy. Abstract P657. 30. Swiss Federal Office of Statistics. Statistique des hdpitaux
2010—tableaux standard, http://www.bfs.admin.ch/bfs/portal /fr/index/themen/14/03/01/data/01.html. Published 2012. Ac-cessed April 26, 2012.
31. Department of Regional Affairs, Economy, and Health, State Council (Geneva). Suivi des prestations de sante a Geneve, Decembre 2011, N°10. http://ge.ch/dares/les-couts-de-la-sante -a-geneve/couts_sante_aujourd_hui_geneve-899.html. Published 2011. Accessed April 26, 2012.
32. Cosgrove SE. The relationship between antimicrobial resistance and patient outcomes: mortality, length of hospital stay, and health care costs. Clin Infect Dis 2006;42(suppl 2):S82-S89. 33. da Silva GJ, Mendonca N. Association between antimicrobial
resistance and virulence in Escherichia coli. Virulence 2012;3: 18-28.
34. Harbarth S, Ferriere K, Hugonnet S, Ricou B, Suter P, Pittet D. Epidemiology and prognostic determinants of bloodstream in-fections in surgical intensive care. Arch Surg 2002;137:1353-1359.
35. Tumbarello M, Spanu T, Di Bidino R, et al. Costs of blood-stream infections caused by Escherichia coli and influence of extended-spectrum-/3-lactamase production and inadequate initial antibiotic therapy. Antimicrob Agents Chemother 2010; 54:4085-4091.
an-B U R D E N OF E S an-B L - P O S I T I V E an-BSI 143
timicrobial resistance in European hospitals: excess mortality and length of hospital stay associated with bloodstream infec-tions due to Escherichia coli resistant to third-generation ceph-alosporins. J Antimicrob Chemother 2011;66:398-407.
37. de Kraker ME, Davey PG, Grundmann H. Mortality and hospital stay associated with resistant Staphylococcus aureus and Esche-richia coli bacteremia: estimating the burden of antibiotic resis-tance in Europe. PLoS Med 2011;8:el001104.
38. Lautenbach E, Patel JB, Bilker WB, Edelstein PH, Fishman NO. Extended-spectrum /3-lactamase-producing Escherichia coli and
Klebsiella pneumoniae: risk factors for infection and impact of resistance on outcomes. Clin Infect Dis 2001;32:1162-1171. 39. Blot S, Vandewoude K, De Bacquer D, Colardyn F. Nosocomial
bacteremia caused by antibiotic-resistant gram-negative bacteria in critically ill patients: clinical outcome and length of hospi-talization. Clin Infect Dis 2002;34:1600-1606.
40. Yang YS, Ku CH, Lin JC, et al. Impact of extended-spectrum 18-lactamase-producing Escherichia coli and Klebsiella pneumo-niae on the outcome of community-onset bacteremic urinary tract infections. / Microbiol Immunol Infect 2010;43:194-199.
![FIGURE i. Representation of the multistate model adopted for this analysis. Every patient enters the model at state 0 (hospital admission, no bloodstream infection [BSI] detected)](https://thumb-eu.123doks.com/thumbv2/123doknet/14926021.663964/2.864.204.684.111.279/representation-multistate-analysis-hospital-admission-bloodstream-infection-detected.webp)


![TABLE 4. Studies Examining the Excess Length of Stay (LOS) and Cost Associated with Extended-Spectrum j3-Lactamase (ESBL) Production (or Third-Generation Cephalosporin Resistance [3GCR]) in Bloodstream Infections (BSIs) Methods Effects attributed to resi](https://thumb-eu.123doks.com/thumbv2/123doknet/14926021.663964/6.864.320.778.57.1092/examining-associated-production-generation-cephalosporin-resistance-bloodstream-infections.webp)