HAL Id: inserm-00580954
https://www.hal.inserm.fr/inserm-00580954
Submitted on 29 Mar 2011
HAL is a multi-disciplinary open access
archive for the deposit and dissemination of
sci-entific research documents, whether they are
pub-lished or not. The documents may come from
teaching and research institutions in France or
abroad, or from public or private research centers.
L’archive ouverte pluridisciplinaire HAL, est
destinée au dépôt et à la diffusion de documents
scientifiques de niveau recherche, publiés ou non,
émanant des établissements d’enseignement et de
recherche français ou étrangers, des laboratoires
publics ou privés.
sub-network motifs in a meta-regulation network model.
Antony Le Béchec, Elodie Portales-Casamar, Guillaume Vetter, Michèle Moes,
Pierre-Joachim Zindy, Anne Saumet, David Arenillas, Charles Theillet, Wyeth
Wasserman, Charles-Henri Lecellier, et al.
To cite this version:
Antony Le Béchec, Elodie Portales-Casamar, Guillaume Vetter, Michèle Moes, Pierre-Joachim Zindy,
et al.. MIR@NT@N: a framework integrating transcription factors, microRNAs and their targets
to identify sub-network motifs in a meta-regulation network model.. BMC Bioinformatics, BioMed
Central, 2011, 12 (1), pp.67. �10.1186/1471-2105-12-67�. �inserm-00580954�
S O F T W A R E
Open Access
MIR@NT@N: a framework integrating transcription
factors, microRNAs and their targets to identify
sub-network motifs in a meta-regulation network
model
Antony Le Béchec
1, Elodie Portales-Casamar
2, Guillaume Vetter
1, Michèle Moes
1, Pierre-Joachim Zindy
3,
Anne Saumet
4, David Arenillas
2, Charles Theillet
4, Wyeth W Wasserman
2, Charles-Henri Lecellier
5,
Evelyne Friederich
1*Abstract
Background: To understand biological processes and diseases, it is crucial to unravel the concerted interplay of transcription factors (TFs), microRNAs (miRNAs) and their targets within regulatory networks and fundamental sub-networks. An integrative computational resource generating a comprehensive view of these regulatory molecular interactions at a genome-wide scale would be of great interest to biologists, but is not available to date.
Results: To identify and analyze molecular interaction networks, we developed MIR@NT@N, an integrative approach based on a meta-regulation network model and a large-scale database. MIR@NT@N uses a graph-based approach to predict novel molecular actors across multiple regulatory processes (i.e. TFs acting on protein-coding or miRNA genes, or miRNAs acting on messenger RNAs). Exploiting these predictions, the user can generate networks and further analyze them to identify sub-networks, including motifs such as feedback and feedforward loops (FBL and FFL). In addition, networks can be built from lists of molecular actors with an a priori role in a given biological process to predict novel and unanticipated interactions. Analyses can be contextualized and filtered by integrating additional information such as microarray expression data. All results, including generated graphs, can be visualized, saved and exported into various formats. MIR@NT@N performances have been evaluated using published data and then applied to the regulatory program underlying epithelium to mesenchyme transition (EMT), an evolutionary-conserved process which is implicated in embryonic development and disease.
Conclusions: MIR@NT@N is an effective computational approach to identify novel molecular regulations and to predict gene regulatory networks and sub-networks including conserved motifs within a given biological context. Taking advantage of the M@IA environment, MIR@NT@N is a user-friendly web resource freely available at http://mironton.uni.lu which will be updated on a regular basis.
Background
The cells of an organism harbor a common set of genes which are differentially regulated in time and space by various factors allowing them to adopt distinct phenotypes and to exert various functions. Among the regulators, transcription factors (TFs) and microRNAs
(miRNAs) which are small 21-23-nucleotide-long, non-coding RNAs, play a cardinal role in the determination of cell fate and homeostasis, in physiological and disease conditions. While TFs act at the DNA level by binding to cis-regulatory elements of genes, termed Transcrip-tion Factor Binding Sites (TFBSs) [1-3], miRNAs regu-late gene expression at the post-transcriptional level by binding to the 3’-untranslated region (3’-UTR) of mes-senger RNAs [4]. They thereby inhibit protein synthesis by triggering the degradation of the target messenger or
* Correspondence: evelyne.friederich@uni.lu
1
Cytoskeleton and Cell Plasticity lab, Life Sciences Research Unit-FSCT, University of Luxembourg, L-1511 Luxembourg, Luxembourg Full list of author information is available at the end of the article
© 2011 Le Béchec et al; licensee BioMed Central Ltd. This is an Open Access article distributed under the terms of the Creative Commons Attribution License (http://creativecommons.org/licenses/by/2.0), which permits unrestricted use, distribution, and reproduction in any medium, provided the original work is properly cited.
by inhibiting its translation, contributing to the fine-tuning of gene expression [5,6]. Rather than acting inde-pendently or in parallel, it is now well established that TFs and miRNAs act in concert in networks to regulate target genes in a coordinated manner [7,8]. TFs and miRNAs are in turn regulated, in part, at transcriptional and post-transcriptional levels. In line, regulatory nodes may comprise TFs and miRNAs that form sub-networks including fundamental, evolutionary conserved regula-tory motifs such as feedback or feedforward loops (FBL, FFL) [8-12], contributing to the modulation of gene expression and the adaptation of cells to changes in their environment. For example, these regulatory schemes play an important role in cell fate determina-tion during embryonic development and during the differentiation/dedifferentiation processes of cells, con-ferring them genetic plasticity [13-15].
Potentially, a TF binds to the regulatory motifs of thousands of genes while a miRNA may target several hundreds of messenger RNAs. Consequently, in silico predictions of binding sequences of these regulators require additional filtering to identify those with poten-tial biological relevance. In line, recent studies have demonstrated that combining binding site predictions with context-linked, experimental genome-wide co-expression data, is a powerful approach to identify bio-logically meaningful molecular interactions [7,12,16,17].
To date, databases and tools have been established which compile and explore experimentally supported and predictive data from TF regulations on coding genes (TF®Gene) [3,18,19], TF regulations on miRNA genes (TF®miRNA) [20-23] and miRNA regulations on messenger RNAs (miRNA® gene), [21,24,25]. While these resources and associated tools are useful to predict TF or miRNA binding sites and associated molecular interactions, an approach which integrates this informa-tion at a genome-scale level to identify miRNA, TF and target gene regulatory sub-networks is still not available. Thus, a resource dedicated to the reconstitution of meta-regulation networks guided by ‘-omics’ data would be of great interest to users to better understand how these regulations contribute to biological processes in normal and pathological conditions.
Here, we have developed MIR@NT@N (MIRna @Nd Transcription factor @nalysis Network), based on a graph-theoretical method to integrate multiple regula-tion levels into a unified model (Figure 1). MIR@NT@N predicts novel molecular actors and the form of their interplay. Based on these predictions or on lists of known molecular actors, users can generate regulatory networks and extract FBL and FFL sub-networks. Ana-lyses can be contextualized and filtered by associating, for example, large-scale co-expression data. Collectively, MIR@NT@N offers novel applications to gain insight
into the potential mechanisms of action of molecular regulators and their targets, in a given biological context.
Implementation
The MIR@NT@N application
The MIR@NT@N application is an open-access web interface, which can be accessed as a standalone module or through the workflow of M@IA, an environment dedi-cated to integrative biology analyses [26]. MIR@NT@N is built in the PHP programming language for database generation, data integration, analysis scripts (including graph construction and FBL and FFL detection) and interface. It also uses applications included in M@IA: R language (http://www.r-project.org) for statistical com-puting and Graphviz tool (http://www.graphviz.org) for interaction graph generation. Data can be further processed using any other module of M@IA, such as automatic gene annotation and data mining based on ontology or metabolic/signaling pathways. The MIR@NT@N application is connected to a MySQL rela-tional database integrating information on biological
JASPAR PAZAR oPOSSUM miRBase MicroCosm microRNA.org Ensembl UniHI TFBS predictions on miRNA PAZAR|JASPAR|miRBase|Ensembl
Figure 1 Meta-regulation network model. The MIR@NT@N meta-regulation network model illustrates interactions between three biological entities, transcription factors (TF), non coding microRNA genes (miRNA) and coding-genes (Gene). This Gene entity represents a target at multiple levels: a DNA sequence (TF regulations), a messenger RNA (miRNA regulations), or a protein (protein-protein interactions). Similarly, edges describe TF regulations (arrows) at DNA level, and miRNA regulations (blunt arrows) at RNA level. Squares represent TFs, diamonds miRNAs and circles coding-gene targets. The MIR@NT@N database is a large-scale resource which integrates information from multiple available databases: PAZAR, JASPAR and oPOSSUM (for TF regulations), miRBase, MicroCosm and microRNA.org (for miRNA target predictions), UniHI (for protein-protein interactions) and Ensembl (for gene annotations). Based on these resources, the MIR@NT@N database also integrates large-scale information about TF
regulations on miRNAs through the prediction of TFBS on upstream sequences of miRNA precursors.
entities and their regulations and interactions. The MIR@NT@N help main page includes an overall descrip-tion of each secdescrip-tion, including a quick tutorial and exam-ple files. To guide users in their analysis, MIR@NT@N also provides a contextual help available within each sec-tion, by explaining parameters, checking loaded data, and suggesting analysis refinement.
Results and Discussion
The MIR@NT@N database
Biological entities were identified and annotated in the MIR@NT@N database using three source databases: PAZAR (Release 2010, January 2010), which includes JASPAR (Release 2009, October 2009) [18,27,28], for TF annotations, including TFBS profiles as Position Fre-quency Matrices (PFMs); miRBase (Release 14, April 2010) [25] for the miRNA annotations including locali-zation on genome sequence; and Ensembl (Release 56, October 2009) [29] for TF and coding-gene identifier mapping.
To integrate TF regulations on coding-genes (TF®Gene), we combined PAZAR [28] which provides public TF regulatory data, and oPOSSUM (Release 2.0, January 2007) [19], a large scale database which among other features, predicts TFBSs conserved between spe-cies, using TFBS profiles from the JASPAR database. Further, we extracted from oPOSSUM all TF®Gene regulations predicted in the 10 kb upstream and 5 kb downstream region of genes, with a score threshold of 0.85, and a high conservation level (top percentile of 0.010 and minimum identity of 80%). For each of the JASPAR profiles, we calculated the correspondence of the scores with empirically derived p-values for a com-mon reference DNA sequence (see “Motif Scoring Pro-cedure and Computation of JASPAR Profile Matrix Score p-values” section on MIR@NT@N website for more details) and established that, for 97% (127 of 130) of the binding site profiles, the applied 0.85 threshold corresponds to a p-value no more permissive than p < 0.01. Present databases [21-23] do not provide sufficient information about TFBSs within genes encoding miR-NAs (TF®miRNA) required for building a large-scale meta-regulation model. TransmiR provides a limited number of experimentally validated regulations for mul-tiple species [20,22]. MiRGen offers the downloading of large-scale predicted regulations, but only for Human and Mouse, and without TFBS scores and locations [21], whereas PuTmiR provides scores only for Human [23]. Regulation of transcription of coding and miRNA genes has been proposed to be similar. This is based on the observation that promoter regions of both share com-mon features such as the presence of CpG islands and specific histone modification markers [30]. In further support of common regulatory mechanisms, it has been
shown that a same transcription factor can regulate both, protein-encoding and miRNA genes [31]. Thus, we have used a standard TFBS detection algorithm [3] and TFBS profiles from the JASPAR database to predict TF®miRNA regulations on a large scale. PFMs were converted into Position Weight Matrices (PWMs) and used to predict potential TFBSs in 10 kb sequences located upstream of miRNA precursors, extracted from Ensembl database, according to pre-miRNA localization provided by miRBase. To limit the noise of false predic-tions, only predicted TFBSs with a score higher than 0.65 were integrated into MIR@NT@N database.
To refine the TFBS prediction on the miRNA upstream sequences, we provide additional information on TFBS location within “CpG islands” (CGI), regions which are frequently associated with promoter regions [30,32]. CGI were predicted (for Human, Mouse and Rat) with CpGcluster [33], a distance-based CGI-finder algorithm, and CpGProd [34], a tool that identifies pro-moter regions associated with CGI.
To integrate miRNA-dependent regulations (miRNA®-gene) into MIR@NT@N database, we combined the miR-Base Targets database, rebranded as MicroCosm (Release 5, September 2009) and hosted at the EBI (release 5), and microRNA.org (Release September 2008) [35]. Each resource can be used, through the MIR@NT@N applica-tion, separately with scores (from the minimum score of 13 to maximum score of 23 for MicroCosm, and from the minimum score of 140 to the maximum score of 205 for microRNA.org) derived from the miRanda algorithm (John et al., 2004), or simultaneously with a unified score (derived by a non-linear transformation and distributed uniformly between 0 and 1).
In addition, we integrated protein-protein interactions from the UniHI database [36], motivated by the idea that clustered miRNAs can coordinately regulate pro-tein-protein interaction networks [37].
Thereby, for 7 species (Caenorhabditis elegans, Danio rerio, Drosophila melanogaster, Gallus gallus, Homo sapiens, Mus musculus and Rattus norvegicus), MIR@NT@N database contains 3 638 miRNAs, 335 TFs, 68 202 coding-genes as well as a large number of predicted interactions for a common standard score threshold of 0.85 (211 783 miRNA®Gene, 32 224 TF®miRNA and 273 264 TF®Gene).
The MIR@NT@N database is publically available on the website, which proposes 1) a dump file of the data-base in a SQL format, 2) a file (tab-delimiter format) with all TFBS scores calculated from miRNA upstream sequences and TF profiles from PAZAR, and 3) a file (tab-delimiter format) of the meta-regulation network, combining all regulations (TF®miRNA, miRNA®Gene and TF®Gene) for a common standard score threshold of 0.85.
Overview on MIR@NT@N
The MIR@NT@N application works within a meta-regu-lation network model (Figure 1) in order to a) identify novel major regulators and targets based on an input list of actors, through interaction graph analysis and sub-net-work detection; and b) construct netsub-net-works with well-defined actors with a presumed role in a given context.
Thus, two types of queries are involved. The first type allows searching for novel key actors in a biological con-text, using TF/gene/miRNA lists as input (including quan-titative expression profiles generated by transcriptomics/ proteomics experiments). This query includes three sec-tions: (i) “Transcription Factor regulation” which statisti-cally predicts potential TFs regulating a list of miRNAs, or conversely miRNAs regulated by a list of TFs; (ii) “miRNA regulation” which statistically predicts the significant tar-gets of a list of miRNAs or the miRNAs targeting a list of genes; and (iii) “Regulation Network” which combines both TF and miRNA regulation predictions to reconstitute meta-regulation networks and allows detection of regula-tory motifs such as FBL or FFL. The second type of query provides an overview on any TF, gene or miRNA, includ-ing their interactions: The “Quick Search” rapidly retrieves
information on any actor, its regulators and/or targets, while the “Quick Network” generates regulation networks from a list of actors presumed to be involved in a particu-lar biological context, and also allows the extraction of sub-networks including regulatory motifs.
As described below, the performance of MIR@NT@N was evaluated with published, experimentally validated data and further highlighted in a biological case study on epithelium to mesenchyme transition (EMT). EMT is an evolutionary conserved biological process involving the reprogramming of regulatory networks, including TFs, miRNAs and their targets, in epithelial cells during gastrulation, neural crest cell migration in embryogen-esis. In adults EMT is reactivated in pathological situa-tions such as wound healing, carcinoma progression, and fibrosis [14,38,39].
Transcription Factor regulation
This section reports potential TF®miRNA regulation given a list of TFs or miRNAs to identify novel TF regulators and miRNA targets. The result is a table of TFs or miRNAs, filtered and ranked by their relevance according to several criteria (Figure 2A) including: the
A B
C
Figure 2 Output of “Transcription Factor regulation”. (A) Result of the query predicting TFs which potentially regulate the miR-200 family (cluster of down-regulated hsa-mir-200a, hsa-mir-200b, hsa-mir-429 represented here as down-regulated, green color code) with stringent criteria: quality score ≥ 0.85, number of miRNA by TF ≥ 3, and Fisher test p-value ≤ 0.05. The four predicted TFs are shown. Results are sorted by the quality score (lower panel). Information on all TF scores, including targeted miRNAs and the number of potential TFBS in a frame are given (shown only for ZEB2). All results, including generated graphs, can be visualized, memorized and exported in various formats. (B) Generated regulation graph with all input miRNAs shown here as down-regulated (diamonds in green) and predicted TFs (squares in gray). Edges represent regulations, and the gray canonical color code corresponds to the quality score. (C) Detail result interface showing the hsa-mir-200b upstream sequence (black line) with all TFBS (black boxes) predicted for ZEB2 and predicted promoter sequences (yellow or orange bar below the black line). A table ranks TFBS by quality score, and includes: “ID” (corresponding to the position in the sequence), sequence size, binding sequence, quality score, localization (within the upstream sequence and the genome through a hypertext link), and potential localization within a predicted promoter (orange boxes).
quality score, the Fisher test p-value, the number of TFBSs and TF®miRNA regulations. Results can be visualized through an interaction graph (Figure 2B) using a gray scale canonical color code to convey pre-diction scores. To facilitate the detection of regulatory clusters, the graph includes expression information (if provided as input) using the green/red canonical color code. In addition, to identify clusters of miRNAs regulated by the same TFs, or clusters of TFs which regulate the same miRNAs, an analysis of the interac-tion graph provides “square” and “curvature” graphs [26]. To refine the prediction analysis, all correspond-ing TFBSs can be visualized through a user-friendly interface (Figure 2C) which provides the binding sequence, its length, the quality score, the localization on the miRNA upstream sequence and in the genome (with a link to Ensembl), and information about pre-dicted promoters using a canonical color code for prediction scores (from yellow to red). All results (tables and graphs) provide links to external knowl-edge sources (PAZAR for TFs, miRBase for miRNAs, Ensembl for genes and TFBS localization). Results can be exported and stored for further analysis, using for instance the M@IA environment [26] or external applications.
To illustrate the performances of these functions, we identified TFs predicted to regulate the miR-200 family, including miR-200a, miR-200b and miR-429, which are important for the maintenance of the epithelial pheno-type and in the prevention of EMT [40]. Using stringent criteria we identified four TFs (Figure 2AB) including ZEB2 which has recently been reported to directly inter-act with E-boxes of the miR-200 promoter [14]. The predicted TFBSs of ZEB2 can be located on the miR-200 promoter by clicking on the ZEB2 table, yielding 1 to 9 sites with the criteria 0.9 and 0.65, respectively (Figure 2C). Interestingly, one of the predicted TFBSs is located within the experimentally identified region of the miR-200 promoter (Bracken et al., 2008) shown to be negatively regulated by the related transcription fac-tor ZEB1, mediated through paired E-boxes.
miRNA regulation
This section determines potential miRNA®Gene regula-tions from a list of miRNAs or other genes to identify novel actors, i.e. miRNA regulators and targeted genes. The result is a table of genes filtered and ranked by their relevance to the input list of miRNA, using alter-native criteria (Figure 3A): MicroCosm and/or micro-RNA.org scores (or corresponding unified score), Fisher
A B
Figure 3 Output of “miRNA regulation”. (A) Result of the prediction of target genes for the miRNA 200 family (cluster of down-regulated hsa-mir-200a, hsa-mir-200b, hsa-mir-429) with medium stringency criteria (miRBase score ≥ 16 and p-value ≤ 0.05, microRNA.org score ≥ 150, at least two miRNAs per gene). The output list was filtered with a list of 132 up-regulated genes. The 20 predicted target genes presented in the table (lower panel) were sorted by the Fisher test p-value. Information can be obtained for each target gene, including its miRNA regulators and unified prediction scores (panels for the first gene is shown). (B) Generated regulation graph with all input miRNAs shown as down-regulated (diamonds in green) and predicted target genes shown as up-regulated (ellipses and square in red). Edges represent regulations, and the gray canonical color code corresponds to the quality score.
test p-values, number of targets per miRNA and the number of targeted sequences (boxes) per gene. Inver-sely, this section can provide, using the same para-meters, a list of miRNAs predicted to regulate a given list of genes.
As described above in the “TF regulation” section, results can also be filtered using a specific list of data to contextualize the study, visualized through the same type of interaction graphs (Figure 3B). We illustrated this feature by predicting genes that are potentially tar-geted by three miR-200 family members. MIR@NT@N predicted 934 genes to be at least targeted by two miR-200 family members, using the criteria described in legend of Figure 3. As these miRNAs are known to be down-regulated in EMT [40], we contextualized the study with a biological filter using a list of 132 genes found to be up-regulated in experimentally induced EMT [17,41], reasoning that messengers with negatively correlated expression levels may be targets of the miR-200 family [17,41]. Twenty genes were predicted to be targeted by miR-200 family members (Figure 3A and 3B). The list included FN1, an experimentally validated target of miR-200 [42], genes reported to play an impor-tant role in EMT [43,44] as well as genes with so far no described role in this process, yielding valuable hypoth-eses for experimental investigations.
Regulation network generation
This section combines “TF regulation” and “miRNA reg-ulation” interfaces to allow the construction of meta-regulation networks (Figure 4A), with an orientation towards the detection of network motifs and the identi-fication of multiple target genes, for both TFs and miR-NAs. Within a specific context, the user may identify, from a list of miRNAs, both novel molecular actors and the nature of the regulation, highlighting fundamental regulatory motifs [10]. These motifs include FBLs con-sisting in a reciprocal regulation of a TF and a miRNA (Figure 4B), the TF controlling the miRNA and the miRNA regulating the TF [45]. The FBL modulates the activity of regulators, which is crucial for the spatio-temporal control of their function. On the other hand, a FFL is a regulatory system in which a regulator A regu-lates another regulator B, and both regulators regulate a common target C [10,11,46]. In MIR@NT@N, FFLs can involve a miRNA regulator (FFL-miRNA, Figure 4C) or a TF regulator (FFL-TF, Figure 4D). In addition, MIR@NT@N includes the concept of indirect FFLs (Figure 4E) in which the regulation of the miRNA by the TF is exerted by an intermediate TF.
Users can inform the system by providing a list of molecular interactions. For example, the user can use a list of miRNA®gene interactions experimentally inferred from microarray data combining genes and
miRNA expression or a list of published TF®miRNA interactions. For this purpose, published and experimen-tally validated TF®miRNA interactions [20,22,23] are provided and can be used as a filter.
To demonstrate regulatory motif detection, we ana-lyzed TF®miRNA regulations from published data by Qui et al., including TransmiR data [20,22]. For the 19 human TFs found in common within the MIR@NT@N and Qiu databases, we observed that 81% of the interac-tions listed in the Qiu database were predicted by MIR@NT@N with a TFBS score higher than 0.65, and 43% with a TFBS score higher than 0.85 (Additional file 1). Using entire MIR@NT@N database, we extracted putative FBLs (Figure 5A) and FFLs (Figure 5B),
C D
E A
B
Figure 4 Meta-regulation Network motifs. (A) The meta-regulation network model integrates TFs, miRNAs and target genes with their regulations. This model allows describing two biologically relevant systems (FBL and FFL) that can be modelled as “network motifs”. (B) The FBL “network motif” model describes a reciprocal regulation between a TF and a miRNA. (C, D, E) The FFL “network motif” model that includes additional target genes, can be illustrated as three distinct models: the FFL-miRNA model describes the regulation of a TF and a targeted gene by the same miRNA (C), the FFL-TF model describes the regulation of a miRNA and a targeted gene by the same the TF (D) and the FFL-indirect model integrates an additional TF in the FFL-TF (E).
B
A
Figure 5 Validation of FBL and FFL motif predictions. 108 published TF®miRNA regulations (Human) were identified from Qiu and colleagues [22] for the 19 TFs in common with MIR@NT@N database. FBL (A) and FFL motifs B) were identified from the input list of miRNAs included in Qiu database, and by filtering actors with the 19 common TFs and with the 108 published TF®miRNA regulations. Non stringent criteria were used for TF regulation predictions (TFBS score ≥ 0.65, TFBS length ≥ 6, number of miRNA per TF ≥ 1, genes targeted by at least 1 TF), and to filter miRNA regulation predictions we used criteria corresponding to a unified score ≥ 0.8 (miRBase score ≥ 17 and p-value ≤ 0.01, and MicroRNA.org score ≥ 152), and 1 gene per miRNA. Squares represent TFs, diamonds represent miRNAs, and edges represent predicted regulations (blue scale color code used for the prediction score). For FBL sub-network, edges represent double regulations.
including well-documented FBLs implicating an E2F TF family member and several miRNA families [47,48], the ZEB “Zinc Finger E-Box” TF family and the miR-200 family [49,50], and YY1 and hsa-mir-29a [51]. Moreover, we predicted hsa-mir-29a to be regulated by NFKB1 and MYC (Figure 5B), consistent with previous reports [51,52] and only recently identified to be co-regulators of their common target mir-29a [53].
Collectively, these results underline the efficiency of MIR@NT@N to generate an overview of a regulatory network and to detect core sub-networks within a biolo-gical system.
Quick Search and Quick Network interfaces
Quick search and Quick network interfaces allow searching for regulations between known or assumed actors of a biological context. The “Quick Search” sec-tion is a full text search engine that provides data perti-nent to specific entities (miRNA, TF or target gene). Information about each biological item is available through hypertext links to external data sources (Ensembl for genes, PAZAR for TFs and miRBase for miRNAs). Potential TF/miRNA regulations and pre-dicted TFBSs are accessible through an internal MIR@NT@N application pipeline.
The “Quick network” is a powerful application to extract information from a list of TFs, miRNAs and other genes with a presumed function within a biologi-cal context, as supported by literature or experimental data. The user can retrieve corresponding regulatory predictions and generate a network of predicted interac-tions as a comprehensive graph, yielding information on the interaction mechanisms of the analyzed actors. Functional motifs (FFL and FBL) can be detected to identify major actors and targets organized into regula-tory sub-networks. The respective quality score thresh-olds of TF and miRNA regulations can be modulated through a cursor and information about protein interac-tions can be integrated into the network (described as experimentally validated in UniHI). A cross-species net-work analysis is possible by selecting different species associated with the input symbol (e.g. the input symbol “hsa-mir-200a” will be changed into “mmu-mir-200a” if the “Mus musculus” species is selected). The output is an exportable interaction graph recapitulating all pre-dicted interactions and which is linked to external resources (Figure 6).
The miR-200 family served as an example to illustrate how the “Quick Network” interface generates regulatory networks in a given context (Figure 6). The generated network recapitulates the results described above and integrates the predictions of the TFBS on coding genes (Figure 6A). The FBL function suggests the presence of a double negative FBL between mir-200a, mir-200b,
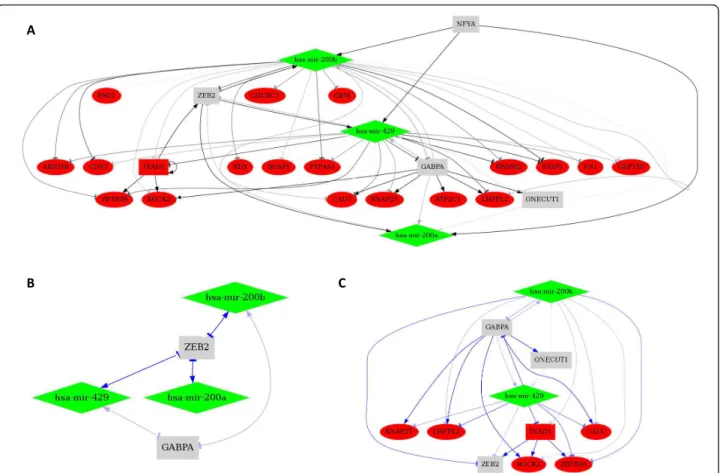
mir-429 and ZEB2 (Figure 6B), as is described in the lit-erature [54]. Target genes already described in EMT, such as ROCK2 [44] and TEAD1 [55] were highlighted from the FFL network (Figure 6C).
Future extensions of MIR@NT@N
MIR@NT@N, which takes advantage of the M@IA envir-onment [26], can be readily extended to include additional miRNA target prediction databases (such as TargetScan [56] or PicTar [57]) or more TF binding profiles from col-lections that use a standard PFM format. The PWM meth-ods utilized within MIR@NT@N are well-established, but likely to be replaced with more advanced models in the near future. High-throughput sequencing coupled to chro-matin immunoprecipitation now routinely generates collections of ~103 binding sites, providing richer descrip-tions of binding properties of TFs. New algorithms are emerging which build on such data to describe patterns using higher-order models to account for interactive effects between positions. However, the rapidly emerging changes have not stabilized, so we applied the established methodology within the source database in the oPOSSUM system. We intend to upgrade MIR@NT@N when a new motif scoring procedure is supported by the JASPAR data-base of binding profiles.
Moving forward, novel data classes will be implemen-ted into MIR@NT@N, such as histone modifications or alternative splicing that play central roles in gene expression and for which databases are already available [58,59]. We will incorporate more knowledge sources, such as known promoter sequences and experimentally validated TF-miRNA regulations [20,22,60].
Conclusions
Here, we described MIR@NT@N, available as an open-access web application at http://mironton.uni.lu, which identifies meta-regulation networks implicating TFs, miRNAs and target genes. The possibility to predict TF-and miRNA-mediated regulations at a genome-wide scale is an important novel feature of MIR@NT@N. MIR@NT@N facilitates the analyses of “-omics” data (i.e. any experiment made at a genome scale such as tran-scriptomics and proteomics analyses) and allows detec-tion of relevant molecular interacdetec-tions and associated regulatory motifs (e.g. FFL). Users analyzing complex spatio-temporal gene regulation data can obtain experi-ment-suitable insights into the regulatory mechanisms governing cellular processes.
Availability and requirements
Project name: MIR@NT@N
Project home page: http://mironton.uni.lu Operating system(s): Platform independent Programming language: PHP, HTML, Javascript, R
Other requirements: M@IA environment including Apache 1.3 or higher, MySQL 4.0 or higher, R 2.0 or higher, Graphviz
License: GNU GPL
Any restrictions to use by non-academics: licence needed
Additional material
Additional file 1: MIR@NT@N predictions for TF®miRNA regulations in Qiu et al. Table providing MIR@NT@N database predictions (maximum score, maximum length and number of TFBS) for TF®miRNA regulations described in Qiu et al., for the 19 human TFs found in common.
List of Abbreviations
TF: Transcription Factor; PFM: Position Frequency Matrices; PWM: Position Weight Matrices; TFBS: Transcription Factor Binding Site; miRNA: microRNA; CGI: CpG Island; FBL: Feedback loop; FFL: Feedforward loop; EMT: Epithelium to Mesenchyme Transition.
Acknowledgements
This work has been supported by the National Research Fund, Luxembourg (BIOSAN 07/12, AFR fellowship to A.L.B, TR-PDR BFR08-084), the “Fondation
Luxembourgeoise Contre le Cancer”, the CNRS, MSFHR, CICHR and the French Embassy in Canada. A.S. is a recipient of a BFR fellowship (08/046) from the Ministère de la Culture, de l’Enseignement Supérieur et de la Recherche of Luxembourg. W.W.W. was supported as Scholar of the Michael Smith Foundation. We especially thank E Schaffner-Reckinger, Jean Muller and Christian Delamarche for critical reading of the manuscript and their helpful comments, and Matthias E. Futschik for providing us UniHI database. Author details
1Cytoskeleton and Cell Plasticity lab, Life Sciences Research Unit-FSCT,
University of Luxembourg, L-1511 Luxembourg, Luxembourg.2Centre for
Molecular Medicine and Therapeutics, Child and Family Research Institute, University of British Columbia, 950 West 28th Avenue, Vancouver, BC V5Z 4H4, Canada.3Structure and Function of the Cell Nucleus, Institute for
Research in Immunology and Cancer (IRIC), Université de Montréal, Montréal (Québec), Canada.4Institut de Recherche en Cancérologie de Montpellier
INSERM U896, Université Montpellier1, CRLC Val d’Aurelle Paul Lamarque, Montpellier, F-34298, France.5Institut de Génétique Moléculaire de
Montpellier UMR 5535 CNRS, 1919 route de Mende, F-34293 Montpellier cedex 5, France.
Authors’ contributions
ALB designed the MIR@NT@N approach and the software. EP-C and WWW helped in JASPAR/PAZAR incorporation and TFBS predictions, contributed constructive suggestions to the study and to the manuscript. C-HL, GV, and MM contributed knowledge on the molecular biology of TF/miRNA regulations and EMT. DA and WWW contributed to the computation of JASPAR profile matrix score p-values. AS, EF, P-JZ and CT provided
A
B C
Figure 6 Regulatory networks in EMT generated by the Quick Network interface. (A) Networks were generated using the down-regulated miR-200 family (diamonds in green), the four TFs (squares in gray) predicted to regulate these miRNAs and the twenty predicted up-regulated target gene list (ellipses in red) predicted to be regulated by these miRNAs. Scores of 0.85 or 0.8 were used for TF regulations or miRNA regulations, respectively. (B) FBL extracted from the previous network (A), showing a regulation loop between ZEB2 and miR-200 family. (C) FFL detected from the previous network (A), focusing on genes targeted by both, TFs and miRNAs.
intellectual support and discussed the results. ALB, EF and C-HL wrote the manuscript. All authors read and approved the final manuscript. Received: 27 July 2010 Accepted: 4 March 2011
Published: 4 March 2011 References
1. Pan Y, Tsai CJ, Ma B, Nussinov R: Mechanisms of transcription factor selectivity. Trends Genet 2010, 26(2):75-83.
2. Meireles-Filho AC, Stark A: Comparative genomics of gene regulation-conservation and divergence of cis-regulatory information. Curr Opin Genet Dev 2009, 19(6):565-570.
3. Wasserman WW, Sandelin A: Applied bioinformatics for the identification of regulatory elements. Nat Rev Genet 2004, 5(4):276-287.
4. Siomi H, Siomi MC: Posttranscriptional regulation of microRNA biogenesis in animals. Mol Cell 2010, 38(3):323-332.
5. Pillai RS, Bhattacharyya SN, Artus CG, Zoller T, Cougot N, Basyuk E, Bertrand E, Filipowicz W: Inhibition of translational initiation by Let-7 MicroRNA in human cells. Science 2005, 309(5740):1573-1576. 6. Fabian MR, Sonenberg N, Filipowicz W: Regulation of mRNA translation
and stability by microRNAs. Annu Rev Biochem 2010, 79(2010):351-379. 7. Bandyopadhyay S, Bhattacharyya M: Analyzing miRNA co-expression
networks to explore TF-miRNA regulation. BMC Bioinformatics 2009, 10:163.
8. Martinez NJ, Walhout AJ: The interplay between transcription factors and microRNAs in genome-scale regulatory networks. Bioessays 2009, 31(4):435-445.
9. Re A, Cora D, Taverna D, Caselle M: Genome-wide survey of microRNA-transcription factor feed-forward regulatory circuits in human. Mol Biosyst 2009, 5(8):854-867.
10. Shalgi R, Lieber D, Oren M, Pilpel Y: Global and local architecture of the mammalian microRNA-transcription factor regulatory network. PLoS Comput Biol 2007, 3(7):e131.
11. Tsang J, Zhu J, van Oudenaarden A: MicroRNA-mediated feedback and feedforward loops are recurrent network motifs in mammals. Mol Cell 2007, 26(5):753-767.
12. Tsang JS, Ebert MS, van Oudenaarden A: Genome-wide dissection of microRNA functions and cotargeting networks using gene set signatures. Mol Cell 2010, 38(1):140-153.
13. Egli D, Birkhoff G, Eggan K: Mediators of reprogramming: transcription factors and transitions through mitosis. Nat Rev Mol Cell Biol 2008, 9(7):505-516.
14. Cano A, Nieto MA: Non-coding RNAs take centre stage in epithelial-to-mesenchymal transition. Trends Cell Biol 2008, 18(8):357-359.
15. Wang Y, Russell I, Chen C: MicroRNA and stem cell regulation. Curr Opin Mol Ther 2009, 11(3):292-298.
16. Malhotra D, Portales-Casamar E, Singh A, Srivastava S, Arenillas D, Happel C, Shyr C, Wakabayashi N, Kensler TW, Wasserman WW, et al: Global mapping of binding sites for Nrf2 identifies novel targets in cell survival response through ChIP-Seq profiling and network analysis. Nucleic Acids Res 2010. 17. Vetter G, Saumet A, Moes M, Vallar L, Le Bechec A, Laurini C, Sabbah M,
Arar K, Theillet C, Lecellier CH, et al: miR-661 expression in SNAI1-induced epithelial to mesenchymal transition contributes to breast cancer cell invasion by targeting Nectin-1 and StarD10 messengers. Oncogene 2010. 18. Portales-Casamar E, Thongjuea S, Kwon AT, Arenillas D, Zhao X, Valen E,
Yusuf D, Lenhard B, Wasserman WW, Sandelin A: JASPAR 2010: the greatly expanded open-access database of transcription factor binding profiles. Nucleic Acids Res 2010, , 38 Database: D105-110.
19. Ho Sui SJ, Fulton DL, Arenillas DJ, Kwon AT, Wasserman WW: oPOSSUM: integrated tools for analysis of regulatory motif over-representation. Nucleic Acids Res 2007, , 35 Web Server: W245-252.
20. Wang J, Lu M, Qiu C, Cui Q: TransmiR: a transcription factor-microRNA regulation database. Nucleic Acids Res 2010, , 38 Database: D119-122. 21. Alexiou P, Vergoulis T, Gleditzsch M, Prekas G, Dalamagas T, Megraw M,
Grosse I, Sellis T, Hatzigeorgiou AG: miRGen 2.0: a database of microRNA genomic information and regulation. Nucleic Acids Res 2010, , 38 Database: D137-141.
22. Qiu C, Wang J, Yao P, Wang E, Cui Q: microRNA evolution in a human transcription factor and microRNA regulatory network. BMC Syst Biol 2010, 4(1):90.
23. Bandyopadhyay S, Bhattacharyya M: PuTmiR: a database for extracting neighboring transcription factors of human microRNAs. BMC Bioinformatics 2010, 11:190.
24. Griffiths-Jones S, Grocock RJ, van Dongen S, Bateman A, Enright AJ: miRBase: microRNA sequences, targets and gene nomenclature. Nucleic Acids Res 2006, , 34 Database: D140-144.
25. Griffiths-Jones S, Saini HK, van Dongen S, Enright AJ: miRBase: tools for microRNA genomics. Nucleic Acids Res 2008, , 36 Database: D154-158. 26. Le Bechec A, Zindy P, Sierocinski T, Petritis D, Bihouee A, Le Meur N,
Leger J, Theret N: M@IA: a modular open-source application for microarray workflow and integrative datamining. In Silico Biol 2008, 8(1):63-69.
27. Sandelin A, Wasserman WW: Prediction of nuclear hormone receptor response elements. Mol Endocrinol 2005, 19(3):595-606.
28. Portales-Casamar E, Arenillas D, Lim J, Swanson MI, Jiang S, McCallum A, Kirov S, Wasserman WW: The PAZAR database of gene regulatory information coupled to the ORCA toolkit for the study of regulatory sequences. Nucleic Acids Res 2009, , 37 Database: D54-60.
29. Hubbard TJ, Aken BL, Ayling S, Ballester B, Beal K, Bragin E, Brent S, Chen Y, Clapham P, Clarke L, et al: Ensembl 2009. Nucleic Acids Res 2009, , 37 Database: D690-697.
30. Marson A, Levine SS, Cole MF, Frampton GM, Brambrink T, Johnstone S, Guenther MG, Johnston WK, Wernig M, Newman J, et al: Connecting microRNA genes to the core transcriptional regulatory circuitry of embryonic stem cells. Cell 2008, 134(3):521-533.
31. Schanen BC, Li X: Transcriptional regulation of mammalian miRNA genes. Genomics 2010.
32. Ozsolak F, Poling LL, Wang Z, Liu H, Liu XS, Roeder RG, Zhang X, Song JS, Fisher DE: Chromatin structure analyses identify miRNA promoters. Genes Dev 2008, 22(22):3172-3183.
33. Hackenberg M, Previti C, Luque-Escamilla PL, Carpena P, Martinez-Aroza J, Oliver JL: CpGcluster: a distance-based algorithm for CpG-island detection. BMC Bioinformatics 2006, 7:446.
34. Ponger L, Mouchiroud D: CpGProD: identifying CpG islands associated with transcription start sites in large genomic mammalian sequences. Bioinformatics 2002, 18(4):631-633.
35. Betel D, Wilson M, Gabow A, Marks DS, Sander C: The microRNA.org resource: targets and expression. Nucleic Acids Res 2008, , 36 Database: D149-153. 36. Chaurasia G, Malhotra S, Russ J, Schnoegl S, Hanig C, Wanker EE,
Futschik ME: UniHI 4: new tools for query, analysis and visualization of the human protein-protein interactome. Nucleic Acids Res 2009, , 37 Database: D657-660.
37. Yuan X, Liu C, Yang P, He S, Liao Q, Kang S, Zhao Y: Clustered microRNAs’ coordination in regulating protein-protein interaction network. BMC Syst Biol 2009, 3:65.
38. Kalluri R, Weinberg RA: The basics of epithelial-mesenchymal transition. J Clin Invest 2009, 119(6):1420-1428.
39. Thiery JP, Acloque H, Huang RY, Nieto MA: Epithelial-mesenchymal transitions in development and disease. Cell 2009, 139(5):871-890. 40. Gregory PA, Bracken CP, Bert AG, Goodall GJ: MicroRNAs as regulators of
epithelial-mesenchymal transition. Cell Cycle 2008, 7(20):3112-3118. 41. Vetter G, Le Bechec A, Muller J, Muller A, Moes M, Yatskou M, Al Tanoury Z,
Poch O, Vallar L, Friederich E: Time-resolved analysis of transcriptional events during SNAI1-triggered epithelial to mesenchymal transition. Biochem Biophys Res Commun 2009, 385(4):485-491.
42. Cochrane DR, Spoelstra NS, Howe EN, Nordeen SK, Richer JK: MicroRNA-200c mitigates invasiveness and restores sensitivity to microtubule-targeting chemotherapeutic agents. Mol Cancer Ther 2009. 43. Wellner U, Schubert J, Burk UC, Schmalhofer O, Zhu F, Sonntag A,
Waldvogel B, Vannier C, Darling D, zur Hausen A, et al: The EMT-activator ZEB1 promotes tumorigenicity by repressing stemness-inhibiting microRNAs. Nat Cell Biol 2009, 11(12):1487-1495.
44. Zhao Z, Rivkees SA: Rho-associated kinases play a role in endocardial cell differentiation and migration. Dev Biol 2004, 275(1):183-191.
45. Baitaluk M: System biology of gene regulation. Methods Mol Biol 2009, 569:55-87.
46. Hornstein E, Shomron N: Canalization of development by microRNAs. Nat Genet 2006, 38(Suppl):S20-24.
47. Emmrich S, Putzer BM: Checks and balances: E2F-microRNA crosstalk in cancer control. Cell Cycle 2010, 9(13).
48. Sylvestre Y, De Guire V, Querido E, Mukhopadhyay UK, Bourdeau V, Major F, Ferbeyre G, Chartrand P: An E2F/miR-20a autoregulatory feedback loop. J Biol Chem 2007, 282(4):2135-2143.
49. Bracken CP, Gregory PA, Kolesnikoff N, Bert AG, Wang J, Shannon MF, Goodall GJ: A double-negative feedback loop between ZEB1-SIP1 and the microRNA-200 family regulates epithelial-mesenchymal transition. Cancer Res 2008, 68(19):7846-7854.
50. Bendoraite A, Knouf EC, Garg KS, Parkin RK, Kroh EM, O’Briant KC, Ventura AP, Godwin AK, Karlan BY, Drescher CW, et al: Regulation of miR-200 family microRNAs and ZEB transcription factors in ovarian cancer: evidence supporting a mesothelial-to-epithelial transition. Gynecol Oncol 2010, 116(1):117-125.
51. Wang H, Garzon R, Sun H, Ladner KJ, Singh R, Dahlman J, Cheng A, Hall BM, Qualman SJ, Chandler DS, et al: NF-kappaB-YY1-miR-29 regulatory circuitry in skeletal myogenesis and rhabdomyosarcoma. Cancer Cell 2008, 14(5):369-381.
52. Chang TC, Yu D, Lee YS, Wentzel EA, Arking DE, West KM, Dang CV, Thomas-Tikhonenko A, Mendell JT: Widespread microRNA repression by Myc contributes to tumorigenesis. Nat Genet 2008, 40(1):43-50. 53. Mott JL, Kurita S, Cazanave SC, Bronk SF, Werneburg NW,
Fernandez-Zapico ME: Transcriptional suppression of mir-29b-1/mir-29a promoter by c-Myc, hedgehog, and NF-kappaB. J Cell Biochem 2010.
54. Burk U, Schubert J, Wellner U, Schmalhofer O, Vincan E, Spaderna S, Brabletz T: A reciprocal repression between ZEB1 and members of the miR-200 family promotes EMT and invasion in cancer cells. EMBO Rep 2008, 9(6):582-589.
55. Liu Y, Xin Y, Ye F, Wang W, Lu Q, Kaplan HJ, Dean DC: Taz-tead1 links cell-cell contact to zeb1 expression, proliferation, and dedifferentiation in retinal pigment epithelial cells. Invest Ophthalmol Vis Sci 2010, 51(7):3372-3378.
56. Tan LP, Seinen E, Duns G, de Jong D, Sibon OC, Poppema S, Kroesen BJ, Kok K, van den Berg A: A high throughput experimental approach to identify miRNA targets in human cells. Nucleic Acids Res 2009, 37(20):e137. 57. Krek A, Grun D, Poy MN, Wolf R, Rosenberg L, Epstein EJ, MacMenamin P,
da Piedade I, Gunsalus KC, Stoffel M, et al: Combinatorial microRNA target predictions. Nat Genet 2005, 37(5):495-500.
58. Koscielny G, Le Texier V, Gopalakrishnan C, Kumanduri V, Riethoven JJ, Nardone F, Stanley E, Fallsehr C, Hofmann O, Kull M, et al: ASTD: The Alternative Splicing and Transcript Diversity database. Genomics 2009, 93(3):213-220.
59. Zhang Y, Lv J, Liu H, Zhu J, Su J, Wu Q, Qi Y, Wang F, Li X: HHMD: the human histone modification database. Nucleic Acids Res 2010, , 38 Database: D149-154.
60. Hu M, Yu J, Taylor JM, Chinnaiyan AM, Qin ZS: On the detection and refinement of transcription factor binding sites using ChIP-Seq data. Nucleic Acids Res 2010, 38(7):2154-2167.
doi:10.1186/1471-2105-12-67
Cite this article as: Le Béchec et al.: MIR@NT@N: a framework
integrating transcription factors, microRNAs and their targets to identify sub-network motifs in a meta-regulation network model. BMC Bioinformatics 2011 12:67.
Submit your next manuscript to BioMed Central and take full advantage of:
• Convenient online submission
• Thorough peer review
• No space constraints or color figure charges
• Immediate publication on acceptance
• Inclusion in PubMed, CAS, Scopus and Google Scholar
• Research which is freely available for redistribution
Submit your manuscript at www.biomedcentral.com/submit


![Figure 5 Validation of FBL and FFL motif predictions. 108 published TF ® miRNA regulations (Human) were identified from Qiu and colleagues [22] for the 19 TFs in common with MIR@NT@N database](https://thumb-eu.123doks.com/thumbv2/123doknet/14523719.531958/8.892.86.805.132.955/figure-validation-predictions-published-regulations-identified-colleagues-database.webp)