Climate business for poverty reduction? The role
of the World Bank
Axel Michaelowa&Katharina Michaelowa
Abstract The World Bank is increasingly active in the area of climate change mitigation. While it justifies this engagement with its poverty reduction objective and its capacity to pave the way for new business activities in developing countries, critics blame the World Bank as a“climate profiteer” and as an unfair competitor in private markets. Our econometric analysis of over 2,000 projects registered until May 2010 under the Clean Development Mechanism (CDM) of the Kyoto Protocol allows us to compare the activities of the Bank with those of other, primarily private actors. The results indicate that hardly any of the CDM projects can be considered as strongly pro-poor. Nevertheless, in comparison to the rest of the CDM projects, the Bank’s portfolio shows a relatively clearer orientation towards poor countries. Within these countries, however, the Bank does not show any particular pro-poor focus, and tends to implement those projects that are commercially most attractive. Moreover, there is no evidence of the Bank phasing out its activities once the market becomes fully operational, which goes against its professed pioneering and catalytic role in carbon markets.
Keywords Clean Development Mechanism (CDM) . World Bank . Climate policy . Carbon market . Poverty reduction . Allocation of resources . Competition . Political economy . Recipient need versus donor interest
JEL codes O13 . O19 . Q54 . Q56
1 Introduction
Environmental objectives have first been officially adopted by the World Bank in 1970. In response to pressure by NGOs and member governments, notably by the DOI 10.1007/s11558-011-9103-z
Electronic supplementary material The online version of this article (doi:10.1007/s11558-011-9103-z) contains supplementary material, which is available to authorized users.
A. Michaelowa
:
K. Michaelowa (*)Center for Comparative and International Studies (CIS), University of Zurich, Zurich, Canton of Zurich, Switzerland
e-mail: katja.michaelowa@pw.uzh.ch A. Michaelowa
e-mail: axel.michaelowa@pw.uzh.ch
Received: 5 August 2010 / Revised: 15 January 2011 / Accepted: 8 February 2011 / Published online: 23 February 2011
United States, the World Bank’s environmental objectives were restructured in the late 1980s and early 1990s (Nielson and Tierney 2003, 2005; Gutner 2005a, b). While mainstreaming environmental objectives within the Bank has proven to be a very difficult task, they were quickly adopted in its rhetoric (Weaver2009, pp. 21ff.; World Bank 2001; Gutner 2005a). In addition, the Bank started a number of separate, new, activities directly focusing on environmental policy.
Recognizing the political dynamics of the development and environment nexus in the aftermath of the Rio Summit in 1992, the Bank seized the opportunity to position itself as a central global player in this field, notably in the area of international climate policy. In particular, it ensured considerable influence on the Global Environment Facility (GEF), created in 1994 on the basis of the Rio decisions, by hosting the GEF on the Bank’s premises and becoming its trustee. Since 2000, the Bank has strongly engaged in developing projects in the market mechanisms created by the Kyoto Protocol, setting up a range of different trust funds to procure emission credits—mainly from developing countries—for industrialized country governments and private companies (World Bank2009a). Moreover, in 2008 the Bank set up the Climate Investment Funds (CIF), which are to channel“fast track” donor finance into mitigation and adaptation in developing countries, partly targeting areas such as avoided deforestation that are not (yet) covered by the existing market mechanisms. In December 2010, the World Bank was also appointed to manage the financial resources of the UN Framework Convention on Climate Change (UNFCCC’s) newly established Green Climate Fund. Moreover, according to the World Bank’s website, over 74% of all IBRD Country Assistance or Partnership Strategies in 2009 “substantively address climate-change related issues” (World Bank2010a, p. 2).
The Bank’s role in financing climate change mitigation has not remained undisputed. Critics argue that, on the one hand, the Bank extends considerable loans for greenhouse gas emitting projects such as fossil fuel exploration and coal power plants, while on the other hand it charges high overheads for managing trust funds that then“clean up the mess” (Redman2008, p. 4, see also Bank Information Center
2009). Vallette et al. (2004) quote a 1997 World Bank paper where the Bank projected generating revenues of 100 million US$ from a 2 billion US$ turnover on the carbon market. Moreover, the Bank’s activities in the carbon market mechanisms largely overlap with the activities of private consultancies and privately managed trust funds, which voice concerns about unfair competition (Benecke et al. 2008; Bretton Woods Project 2008). A prominent example is the Spanish Carbon Fund, originally proposed by Spanish consultants and project developers, but finally implemented by the World Bank because the latter was considered as “more experienced” by the Spanish government (World Bank2005; Government of Spain
2004).
As World Bank hypocrisy with respect to environmental objectives is already well treated elsewhere (see e.g., Weaver 2009), this paper will concentrate on the second aspect of the above critique, i.e., on the overlap of its activities with private competitors. More specifically, we will examine the following questions: What is the role of the Bank in a by-and-large well functioning private carbon market? Does the Bank tend to specialize in areas neglected by private market participants? Or do the activities of the Bank provide substantial externalities that can justify its role?
The Bank itself justifies its engagement with its central poverty reduction objective and its capacity to actually open up those markets that only later attract further private business activities (World Bank 2003). On its webpage “News & Broadcast: Carbon Finance” the World Bank (2010c) states:
The World Bank aims to effectively support sustainable development and poverty reduction in developing countries as climate risks and climate-related economic opportunities arise. […] Catalyzing the global market for carbon emission reductions was the World Bank’s role in carbon finance.
This would indeed imply a specialization on neglected areas and the generation of externalities to the benefit of all market participants.
We assess these claims using data on over 2,000 projects registered up to May 2010 under the Clean Development Mechanism (CDM) of the Kyoto Protocol. These data allow us to compare the activities of the Bank with those of other, primarily private actors. In this comparison, we consider the expected development benefits of different project types as well as the poverty orientation in the selection of host countries. By tracing the development of World Bank activities over time, we also try to see whether the Bank actually took a pioneering role in market development, crowding in the private sector rather than crowding it out. To assess commercial profitability we further consider the expected volume of certified emission reductions (CERs) and related indicators of project size.
By distinguishing between the different (commercial or poverty related) objectives of the World Bank’s activities, this paper relates to the aid allocation literature on donor interest versus recipient need. For recent studies in this tradition that specifically focus on the World Bank, see Kilby (2009), Dreher et al. (2009b), and Fleck and Kilby (2006). In this literature, comparisons of different bi- and multilateral donors have also been relatively frequent (see e.g., Berthélemy2006). Recent work also evaluates the aid allocation decisions of bilateral donor agencies as compared to those of development NGOs (Dreher et al.2009a).
In a similar way, this paper will compare the World Bank’s selection of CDM projects with the selection of CDM projects by other carbon market participants. Of course, the context of carbon market transactions is quite different from the traditional context of “recipient need versus donor interest.” In particular, in this area, the World Bank does not act as a“donor.” In Section2, we will clarify what role the World Bank actually plays on the carbon market, and to what extent it can or cannot be considered as a competitor to private companies in this field. Section3
then theoretically discusses an adapted model of “need versus interest” that is empirically assessed in Section 4. Section 5 draws some conclusions and derives policy recommendations for an adjusted role of the Bank.
2 The Role of the World Bank in Carbon Finance
The idea to create a global market for carbon credits as a way to increase efficiency in climate change mitigation efforts was born in the early 1990s, and tested in a pilot phase starting in 1995. It subsequently led to the integration of market mechanisms in the Kyoto Protocol in 1997. These market mechanisms include (1) emission
trading among industrialized countries, (2) certified project-based emission reductions in developing countries, and (3) project-based emission reductions in other countries (notably countries in transition). The project-based mechanisms should enable governments and private firms in industrialized countries to fulfill their emission reduction targets in a more cost-effective way by reducing emissions in developing and transition countries, and receiving carbon credits in return. Especially for developing countries, a global carbon market was also expected to generate much-needed technology transfer, and to become an important source of additional financial resources.
Emissions credits—Certified Emission Reductions (CERs)—from projects in developing countries could be generated from the year 2000 by a so-called“Clean Development Mechanism” (CDM), which should be governed by an Executive Board (EB). However, in the Kyoto Protocol, no detailed rules were established for the CDM, and it took until 2001 for this to happen in the Marrakech Accords. The Marrakech Conference established the EB as an institution of the UNFCCC and elected its first members. Nevertheless, even at this stage, monitoring requirements as well as transaction cost were considered as almost insurmountable barriers to the functioning of the CDM (Lecocq2003, p. 703). Indeed the first CDM project was not formally registered by the EB until December 2003.
While a definitive, internationally accepted mechanism for carbon finance involving developing countries thus became effective only in 2003, the World Bank started much earlier to build up a position as a major player in this promising new field of activities. As early as in 1996, during the pilot phase mentioned above, the IBRD’s Environment Department suggested a 100 million USD fund for project-based mechanisms. The Bank’s President James Wolfensohn approved the Bank’s strategic move into this area on the recommendation of the New Products Committee in February 1997. In addition, the Bank’s Environment Department received 3.2 million USD in New Products funding under the Strategic Compact for design and marketing. In June 1997, Wolfensohn presented the Bank’s new “Global Carbon Initiative” at the UN General Assembly Special Session (OED2004, p. 3).
However, the strong involvement of the Bank at this early stage of the international process was seen as unwarranted by both the Bank’s own Executive Board and by international NGOs. They feared that the Bank would preempt the results of the negotiation process that had been set up under the UNFCCC (OED
2004, p. 3f.).
While the UNFCCC was thus backed in its role as the responsible agency for the advancement of carbon finance related rules and regulations in general, and the governance of project-based mechanisms such as the CDM in particular, the IBRD continued to act in parallel through the mobilization of finance from individual industrialized countries and through consulting activities. To further amplify its financial resources for this purpose, the IBRD attempted to obtain co-financing through the GEF, but this was opposed by the United States, which did not want to finance Kyoto Protocol-related instruments through its GEF contributions (Dutschke
2003, p. 10).
Right from the beginning, the engagement of the IBRD was intended to be far more than just opening a single pilot fund. To this purpose, a new“Carbon Finance Group” (later called “Carbon Finance Unit”) was founded under the Environmentally
and Socially Sustainable Development (ESSD) Vice-Presidency. This laid the ground for further expansion of activities and personnel. Already in 2003 it had a staff of over 33 (the last number provided before it stopped reporting details on staff expansion). Today, the Carbon Finance Unit is an established part of the Bank publishing its own annual report. Its work is supported by other parts of the IBRD. There is some evidence, for instance, that the East Asia and Pacific Region (EAP) Vice Presidency requested all task managers to systematically screen projects for carbon finance opportunities (OED2004, p. vii–viii).
In parallel to the IBRD, within the World Bank Group, the International Finance Corporation (IFC) also saw some opportunity to diversify into the new market. In 2004, the World Bank’s Operations Evaluation Department reported about competition between the two agencies over the management of a trust fund for the Netherlands (OED 2004, p. 7). The report called for a high level strategy on the division of labor within the World Bank Group (p. viii). In this particular context, a compromise was found through an agreement with the IBRD and the IFC as co-managers of the fund. Eventually, the IBRD seems to have dominated because the IFC never got involved in more than two funds, and, after a few years, also stopped accepting new financing into these existing funds (IFC2010).
This brief historical overview shows that, in fact, when we speak of“the Bank” in the context of carbon finance, this essentially means the IBRD, or, more precisely, its Carbon Finance Unit specifically created for this purpose.
How did the Bank’s actual activities evolve since the mid-1990s? In 1999, still far ahead of any formal agreement on the CDM and in the midst of the pilot period, the World Bank established the Prototype Carbon Fund (PCF) as an initial instrument to channel northern funding into climate change mitigation projects in developing countries. In 2002/2003, the Bank further launched the Netherlands Clean Development Mechanism Facility, the Italian Carbon Fund, the Community Development Carbon Fund (CDCF), and the BioCarbon Fund. These were followed by the Spanish Carbon Fund (2004), the Danish Carbon Fund (2005), the Umbrella Carbon Facility (2005), the Carbon Fund for Europe (2007), and the Carbon Partnership Facility (2009). These funds are either trust funds for public and private entities in specific industrialized countries, or open World Bank funds tailored to specific project types (e.g., small projects in least developed countries for the CDCF, or, in contrast, very large projects for the Umbrella Carbon Facility).1In addition, the World Bank is active on carbon markets not covering developing countries, but countries in transition, e.g., through the Netherlands European Carbon Facility created in 2004.
In May 2010, the World Bank administered 11 out of 96 funds managing carbon finance (Alberola and Stephen2010). With 1.6 billion€, the total volume of these funds corresponded to roughly one sixth of total demand in the market.
In addition to managing funds generating CERs for projects within accepted carbon market mechanisms, the Bank makes use of development aid for complementary activities. In particular, development aid is used to finance capacity building that later leads to CDM project development. Development finance is also used for areas not (yet) covered by existing market mechanisms. This is the case for
1
activities in the context of the Climate Investment Funds (CIF) set up by the Bank in 2008, and also for parts of the activities covered by the Forest Carbon Partnership Facility (FCPF) established by the Bank in 2010 to combine carbon finance and development aid for forestry projects.
As noted by Newell (2009, p. 426) these activities at the borderline of agreed market mechanisms also provide an opportunity for the Bank to expand existing markets, to create new markets, and to contribute to shaping the governance mechanisms that will then be adopted internationally at a later stage. This is in line with the Bank’s strategy ever since the creation of the Prototype Carbon Fund in 1999.
Finally, the World Bank also directly acts as a project developer, broker and consultant for both the supply and the demand side of the market. In doing so, it competes with numerous national and international consultancy firms, which are gaining increasing experience in the market. According to the UNEP Riso Centre (2010) database, until May 2010, more than 200 different consultancies were involved in the development of at least five CDM projects.
The multi-faceted role of the Bank may enter as a distorting factor into this competition with consultants, as well as into the competition with other carbon funds. This problem may be reinforced through the Bank’s traditional role as a multilateral aid agency. In particular, the close cooperation between the Bank and developing country governments in the context of general lending agreements, and influence exerted in the framework of aid-financed capacity building, may enable the Bank to obtain contracts for the most commercially interesting CDM projects. Anecdotal evidence even suggests that established contacts with developing country governments have sometimes been used by the Bank to obtain CERs below market value. A note from the World Bank published on their website in late 2005 (but not dated) implicitly acknowledges that such things did happen (World Bank2011b).2 This leads to increased return on investments into the Bank’s CDM funds, and strengthens the Bank’s market position both as a manager of these funds and as a CDM consultant and project developer. In addition, the Bank traditionally carries out highly subsidized events for capacity building and information sharing, notably the annual carbon market trade fair “Carbon Expo,” where the Bank pays the travel expenses for a significant number of developing country participants through the “Carbon Finance Assist” program. Total subsidies for Carbon Expo for the years 2005– 2009 reached 2.5 million US$, i.e., 0.5 million US$ per event (Carbon Finance Assist
2007). This cannot be matched by other carbon market participants organizing similar events on a commercial basis (e.g., the Carbon Markets Insights fair).
In the area of CDM consultancy and project development, the Bank also competes with private firms, since the Bank’s internal staff writes the same type of project documentation that is otherwise provided by third parties. The question again
2
In his contribution to this volume, Mosley (2011) provides a comprehensive discussion of the way trust
builds up between donors and recipients. Under particular consideration of the World Bank as a“lead
donor,” he shows how important this long-term relationship is for both sides. This strengthens our
argument on the Bank’s competitive advantage through its long-term relationships with many developing
country governments. Moreover, it points at the problematic long-term consequences of betraying this
trust in the above-mentioned way—over and above the directly adverse developmental impact of a deal
arises whether there is unfair competition due to direct or indirect subsidies. While no detailed information on World Bank staff funding is available, it seems highly plausible that, at least initially, this staff was paid like any other World Bank staff, i.e., from the interest rate margin charged on the Bank’s loans, rather than by specific external funding. Scattered information such as on the 3.2 million USD in New Products funding for design and marketing already mentioned above points in the same direction. Similarly, scattered evidence on cross-support of the Carbon Finance Unit by staff of other departments is available, for instance, in the above-quoted OED (2004) assessment and in several other sources, such as the Unit’s vacancy notes (World Bank2011a).
In addition, the scant information available on administrative cost shows that the World Bank does not work at generally lower cost than private companies (see Table 1). This also indicates that the Bank might not be competitive without the advantages in terms of access to decision makers, co-financing through aid and cross-subsidization.
To compare the administrative costs presented in Table1, we made an in-depth review of annual reports by the Bank’s Carbon Finance Unit and private CDM project developers quoted at stock exchanges. This exercise was complicated by the lack of financial reporting on the administrative costs of the World Bank’s carbon funds. The only information available covers the PCF and ends in 2005. This makes it impossible to make a direct comparison of the costs accruing for project portfolios developed by the Bank and private companies during the same period. Thus, we have to resort to a comparison of the administrative costs of the PCF during 1999–2005 with three stock exchange quoted companies for the period 2005–2009. This comparison shows that costs per project tend to be higher for the PCF than for competing private firms, although the former did not actually develop projects itself and did not have to bear the organizational burden of getting the projects up and running. Even when looking at the costs per CER, the advantage of the PCF is limited given the significantly larger project size in terms of CERs per project (see also the discussion in Sections3and4d).
The same arguments hold with respect to the management of CDM investment funds. However, here the Bank competes with both private financial companies and a number of other public organizations (such as the European Bank for Reconstruction and Development, EBRD, or the German Development Bank, KfW, and the European Investment Bank, EIB). For an overview of different types of such private and/or public carbon funds and their governance structures, see Gosh (2010).3
As a whole, we can conclude that the World Bank has appeared as a major player on a market that also attracts a number of private companies. However, the Bank’s traditional aid-related relationships with developing country governments, and its ability to combine carbon finance and development aid to support its activities, clearly put it at an advantage over its competitors.
3In the light of Marchesi and Sirtori’s (2011) results in this volume, it is interesting to note that in the
future, the IMF may also enter this area of activities (Bredenkamp and Pattillo2010). In particular, it will
be interesting to observe whether the two Bretton Woods institutions will then look for complementarities or compete, and how this will affect the development impact of the CDM.
Considering these issues from a more systematic normative perspective, we may ask whether a multilateral public agency should take up such an active role in a predominantly private market. From a similar perspective, Vaubel (1985, p. 28ff.,
1988) analyzes the activities of the World Bank Group’s Multilateral Investment Guarantee Agency (MIGA) and finds that it benefits from a rather unjustified competitive advantage based on (partially hidden) subsidies, which eventually implies a misallocation of resources.
In our context, one economic argument for the activities of the Bank could be economies of scale. It could be that to be efficient in the field of the CDM, one does need important experience and networks in developing as well as industrialized countries. For this reason, the World Bank could be simply the“best” actor on the market, with a competitive advantage due to its previously acquired knowledge in related fields and its capacity to carry out large-scale activities. Eventually, such economies of scale might even lead to a natural monopoly. The evidence on administrative costs in Table1 does not support this argument, and private players have been able to successfully enter the market. Generally, the experts involved in the design of the carbon market at the UNFCCC did not seem to believe in significant economies of scale. The monitoring and control instruments of the CDM Table 1 Administration costs of different entities involved in the CDM/JI
Entity Item PCF Ecosecurities Tricorona Camco
CER/ERU volume of portfolio (million) 31.1 144 176 81
Number of projectsa 24 447 >200 >98
Average CERs per project (million) 1.3 0.3 <0.9 <0.8
Administration costs (million€) 8.5b 105.3c 39.3d 30.1e
Cost per CER (€) 0.27 0.73 0.22 0.37
% of PCF 100% 270% 81% 137%
Cost per project (million€) 0.35 0.24 <0.20 <0.31
% of PCF 100% 69% <57% <89%
a
Tricorona and Camco do not publish full project numbers. The Tricorona number is derived from a press
release of March 2010 (Tricorona2010b) and the Camco number is taken from the URC CDM and JI
pipelines of December 1, 2010. The actual number is likely to be significantly higher, which also implies that our calculation of costs per project is an upper bound of actual cost
b
Million€, 1999–2005 (using the exchange rate of 1 $=1 €) . This is an underestimate as the World Bank
has not reported any administration costs in the PCF reports after 2005, while costs are still accruing until the end of the contract periods
c
Million€, 2004–2008. Staff costs reached 54.8 million, “other” administrative costs 46.5 million
d
Million€, 2005–2009 (using the exchange rate of 10 SEK=1 €). Staff costs reached 25.7 million, “other
external” costs 13.6 million
eMillion€, 2006–2009. Gross staff costs reached 38.6 million, “other” administrative costs 21.5 million. It
should be noted that Camco has a large non-CDM-related consulting division (47% of staff in 2009 and 52% in 2008) and thus costs listed in the table have been reduced by 50%
Own calculations based on IBRD (2001,2002), Prototype Carbon Fund (2004), Carbon Finance Unit
(2007), Ecosecurities (2006,2007,2008,2009), Tricorona (2006,2007,2008,2009,2010a,b), Camco
were conceived in a way to oversee a market with many individual private players, and this is precisely what can be observed.
Finally, if the Bank had a natural competitive advantage, there would be no need for subsidies, and it would be able to compete on a purely commercial basis. As mentioned above, the actual amount of direct and indirect subsidies is not clear, but there is reason to believe that at least some subsidies do exist. This is similar to the case of the MIGA where Vaubel (1985, p. 30) also finds evidence for subsidies. Moreover, the choice of the IBRD rather than the IFC as the lead agency for carbon market activities within the World Bank Group points at a deliberate decision not to enter this field on a purely commercial basis. The Bank’s Operations Evaluation Department suggests that the involvement of the IBRD rather than the IFC raises expectations with respect to the generation of positive externalities (OED2004, p. iix). Indeed, positive externalities appear to be the only possible economic argument for the engagement of the IBRD as we observe it today. And it seems that the World Bank itself is well aware of its peculiar situation. It does not try to position itself as a “normal” private carbon market actor. In none of the World Bank carbon market strategy documents are its activities in the area of the CDM simply discussed as an interesting means of income diversification or private investment. In contrast, the strategic objectives mentioned in this context all relate—at least indirectly—to potential externalities.
It should be noted that activities on the carbon market do not have direct environmental externalities, unlike other environmental interventions. They do not directly generate global emission reductions. The carbon market mechanisms of the Kyoto Protocol simply support industrialized countries in finding a cost-efficient way to meet the targets they agreed upon at the international level. Thus carbon finance in itself has no public good character in any way.
Correspondingly, we have to follow a more complex logic to see potential linkages to externalities that may, indeed, be relevant here. The objectives mentioned by the Bank in this context include, in particular (see World Bank2003, p. 19, World Bank2009a, p. 3, World Bank 2010b, and Lecocq2003):
& Supporting market development for the Kyoto Protocol’s existing project-based market mechanisms, and possible future additions (such as new mechanisms in the area of avoided deforestation). This covers pioneering, piloting, capacity building, learning-by-doing, the dissemination of lessons learned, and the general stimulation of demand and supply. Clearly, in this context, positive externalities are not meant to come about through emission reductions by any individual projects, but through the benefits of a functioning market that reduces cost for all participants and, potentially, mobilizing political support for more ambitious reduction targets in the future. The stated objective of the Bank is to contribute to this development.
& Focusing on the development aspect and the pro-poor orientation of carbon finance. This implies reaching out to particularly poor countries and communities within countries. It also implies selecting project types with relatively high development benefits along with their potential to reduce emissions.
Again, it is not the emission reduction potential of the individual project that generates the link to potential externalities. While the argument is at the project
rather than the market level, the link is generated through the general poverty reduction objective. Given that addressing poverty within the CDM does not provide private benefits to the market participants, the potential to combine CDM projects with a pro-poor perspective may be underexplored from a general welfare point of view.
From this perspective, prior contacts with developing country governments and even the possibility of cross-subsidization with development finance may turn into an advantage for all parties. They may in fact be crucial to bringing the market into existence, and to ensuring broad-based participation in demand and supply, including the poorest countries and communities. The Bank’s effort to create new markets, to shape their governance mechanisms, and to be present with many projects as early as possible, now appears as a natural consequence of these objectives, rather then as an undue attempt to acquire market power. Moreover, combining development oriented projects with additional finance for particularly poor countries and communities would clearly be in line with the Bank’s general mission to reduce poverty.
In the following, we will try to assess to what extent World Bank activities on the carbon market are indeed driven by a strong poverty orientation, by the objective of generating new markets, or rather by the Bank’s own commercial interest.
3 Recipient Need or World Bank Interest?
The above discussion directly suggests a“needs versus interest” framework in the context of World Bank carbon finance. The Bank’s own arguments all suggest a motivation by“recipient need.” Let us therefore examine the needs-perspective first. In developing countries, there is need for additional resources, and the poorer they are, the greater the need. This, at least, would correspond directly to the standard argument of the recipient-need literature ever since the 1970s. While recent analysis shows that—largely but not only driven by the rise of a few large developing countries—the majority of the poor today lives in middle-income countries (Sumner
2010), the standard country-level argument may still be valid. This is because within a middle income country like, say, China, we may have many poor, but we may also expect the country itself to solve its internal distribution problem given its overall resources.
At the same time, if resources do flow into more wealthy countries, we may still be interested into where exactly they go. Indeed, if they go to China, but to the more disadvantaged regions within the country, this will certainly provide us with a different impression of the Bank’s poverty orientation than if they do not. As far as possible, we will therefore consider poverty at the national and at the sub-national level. Carbon finance that is effectively oriented towards poor countries or poor areas within given countries suggests a selection of CDM projects driven by recipient need.
In addition, the selection of development-friendly CDM project types is an indication of a need-based orientation. While the primary objective of CDM projects is climate-change mitigation, this effect is irrelevant for the CDM host country, in
the sense that the same emission reduction anywhere else in the world would have made the same effect. Of course, overall, mitigation must be expected to have a very strong effect on developing countries, but the locality of the reduction effort does not matter in this context. What is relevant locally is primarily the development component of the project. This is likely to depend on project types. Project types typically considered as strongly pro-poor and development-friendly are, for instance, the dissemination of improved biomass stoves and solar cookers, which can considerably improve the health status of the family, especially of women, as well as reduce emissions. In contrast, projects related to the destruction of industrial gases (HFC 23 and N2O) usually have no additional development benefit at all as they only require a plant that burns these gases supervised by one or two engineers.
Finally, there is the World Bank’s main argument of its role in generating a functioning market in the first place. From the perspective of both the need to find innovative ways to mitigate climate change (which will eventually benefit poor countries) and the need of poor countries to gain additional sources of income, the development of carbon markets can be interpreted as an effort in line with recipient need. As we have seen, the Bank’s early participation on the market is not a clear signal in this respect. It could stand for both the intention to build up the market, but also the intention to maximize the Bank’s own power over market procedures and participants in order to be in a good starting position for competition once the market mechanisms have become fully operational.
However, if market development and the crowding in rather than the crowding out of private market participants is truly the Bank’s major motivation, we should observe a reduction of the Bank’s activities when private actors increasingly enter the market. The Bank itself acknowledges that the carbon market is now“mature” (World Bank2010c). In the context of the CDM, this implies that we should observe a reduction of World Bank activities.
All in all, if the World Bank is indeed particularly responsive to developing countries’ needs, it should (1) select its CDM projects in particularly poor host countries or regions within countries, (2) select particularly development-oriented project types, and (3) reduce its activities over time.
The World Bank interest perspective focuses on commercial interests as a CDM project buyer, or a project developer and manager for the sake of the industrialized investor countries. Indirectly, this may be related to objectives of staff expansion, or the expansion of resources in general. If the Bank strives to expand and diversify its own income generating activities, and if it wants to appear as a particularly successful broker and attract a maximum of investments from the North, it will look for the most profitable projects. This is primarily related to the expected number of CERs issued per year and overall, until the end of the crediting period under the Kyoto Protocol (2012).4
Usually, the number of CERs is positively correlated with the financial volume of the investment. Large projects typically reduce the administrative burden of achieving CDM registration because CDM transaction costs have a high fixed component (see Michaelowa and Jotzo 2005). This should be an additional
4
As a higher number of CERs does not imply greater overall environmental benefits (cf. Section2), this
advantage for the Bank and reinforce the relationship between project size and World Bank interest.
We can thus conclude that generally, if the World Bank acts from an interest-based motivation, it should tend to focus on projects generating a relatively large number of CERs.
While we have now defined potential indicators of a needs or interest-based orientation of World Bank activities, it should be noted that, just as in the original donor interest versus recipient need model, the two are not mutually exclusive. The typical outcomes of these models related to aid show that donors allocate resources in response to both aspects of need and of donor self-interest. In the following, we will see to what extent this also applies to the World Bank’s engagement in carbon finance, and we can then discuss whether the needs orientation may be considered sufficient to justify the Bank’s special role on a primarily private market.
Since activities on the carbon market happen under certain constraints imposed, for example by limited project choices or by the UNFCCC rules and regulations, we will not assess the project decisions of the Bank independently of the choice of other market participants. In contrast, we will consider how the World Bank chooses its CDM project portfolio in direct comparison to the choices of other market participants.
4 Empirical Evidence
In order to test the relevance of need and interest for the World Bank’s project selection, we use the CDM database provided by UNEP Riso Centre (2010). It includes detailed information on all 2171 CDM projects registered up to May 2010. We merge this information with additional data on the CDM host countries’ level of income (World Bank2009b).5
The dependent variable is a dummy taking the value one if the World Bank is the credit buyer and zero otherwise. It was constructed by screening the CDM database for the World Bank as a credit buyer. As the Bank appears under the names of its multiple funds mentioned above (which in turn use different abbreviations), and as sometimes even the funds are not mentioned but only the country that eventually obtains the CERs, this procedure did not allow us to find all relevant entries. We therefore complemented the search by looking at projects for which the World Bank was documented as the consultant responsible for the project design documents. As we are not aware of any single case in which the Bank acted as a consultant without buying the respective credits, this should be a reasonable approach. All in all, this procedure leads us to identify 65 World Bank CDM projects corresponding to roughly 3% of all registered projects. While this number is lower than the overall number of 202 CDM projects reported in World Bank (2009a, p. 5), the difference can probably be explained by the fact that the majority of projects have not reached
5
Initially, we also considered World Bank aid flows to CDM host countries (AidData2010) to control for
the relationship between the Bank and these countries prior to the CDM. However, as this variable was insignificant in all regressions, it will not be considered further in our analysis.
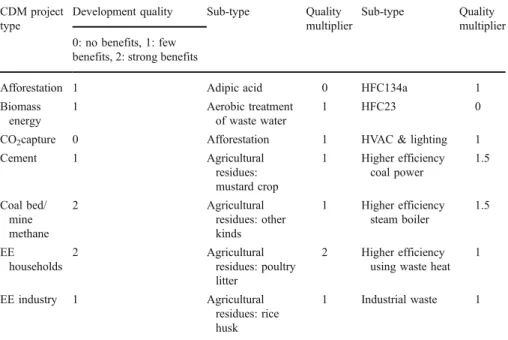
the registration stage yet, i.e., they may be at the planning stage within the Bank and it is not yet clear whether they will ever be effectively accepted and implemented.6,7 Another rather complicated issue was the construction of the indicator for the development quality of project types. Development quality of projects is seen as high if projects provide direct benefits for the population, e.g., by reducing expenditures for energy services, or indirect benefits, such as reducing negative impacts of waste management. The list of all codings can be found in Annex1. Note that the overall project quality index is computed as the product of the value for the broader project type, and the multiplier for the more specific sub-category. The lowest value is zero (no development relevance, or even an expected negative effect), while the highest is four (strong development relevance).
In the following, we will assess the different dimensions of our recipient need versus World Bank interest model using both descriptive statistics and an overall regression analysis. In this context, we need to consider the hierarchical structure of our data where projects from different buyers and over several years (2004–2009 if we refer to the submission date) are nested in CDM host countries. Introducing general host country fixed or random effects does not seem appropriate here, however, as the number of observations per host country is extremely uneven, ranging from just one (in 25% of the hosts), over two (for another 17% of the hosts) to 820, 502 and 171 for the three most attractive host countries, China, India and Brazil respectively. Our solution is to introduce dummy variables for the major host countries, complemented by year dummies wherever this is possible.8In addition, we use clustered standard errors to account for remaining problems of unobserved heterogeneity and related autocorrelation and heteroscedasticity problems.
As our dependent variable is binary (reflecting the coding decision), this approach is not without problems, since binary response models (logit or probit) are
6If we also count all projects submitted for validation, but not yet registered (see Figure1), we can
identify a total of 126 World Bank projects. It appears plausible that the others have not even been submitted so far. In this case, our number of 65 projects correctly covers the totality of actually registered projects. Only if there were a substantial number of registered World Bank projects that we mistakenly interpreted as non-World Bank projects, this would reduce the precision of our empirical estimates. In this case, it would be more difficult to detect significant differences between World Bank and non-World Bank projects, but the plausibility of those effects that we do find would even be higher. If, in addition, those projects that we could not correctly identify as World Bank projects were not random, but systematically related to cases the Bank might have intended to hide, our overall results might be biased towards “recipient need” and against “donor interests,” so that our results would provide only a lower bound for
potential criticism with respect to the Bank’s carbon market activities. However, as stated earlier, given a
typical CDM project cycle, the number of registered projects we could identify appears plausible, and we are confident that such a bias is not relevant here.
7
We could have considered all projects submitted (CDM project proposals) when constituting the database, rather than all registered projects. This would have provided us with a higher number of observations from both the World Bank and other market participants. However, many submitted projects turn out not to be in line with CDM rules and regulations, and they are not validated or effectively rejected. Experience shows that this is rarely the case for World Bank projects, but relatively frequent for project proposals from private actors. Including such project proposals may thus bias any comparisons related to the quality of the projects. Hence, we restrict our sample to registered projects, except for the case where we only look at the mere volume of market activities.
8In two years out of five, no World Bank projects were submitted for validation. Therefore, the respective
dummies lead to full determination of failure in a binary regression model. In our logit model, we thus substitute the year dummies by a single, more fine-grained control variable, reflecting the exact date of submission.
inconsistent in the presence of unobserved heterogeneity and heteroscedasticity (Greene2002, p. 673f.). In other words, if we really need robust estimation to obtain correct estimates of our standard errors, the whole model is incorrectly specified in the first place. Hence, we also present a linear probability model to compare the results, as an additional robustness check.
4.1 Selection of CDM Projects in Poor Countries and Poor Communities
The general literature is rather skeptical about any direct positive impact of the CDM on the poor. The issue has been discussed both from a more abstract perspective (see e.g., Michaelowa and Michaelowa 2007 and Olsen 2007) and in a few detailed country-case studies (see e.g., Sirohi2007).
Using more recent data, we come to a similar conclusion. If we abstract from its general usefulness as a tool to reduce global warming, which can certainly be considered to over-proportionally affect the poor, it seems that the CDM has so far hardly had any specific pro-poor orientation. Looking at the geographic locations that benefit from CDM investments, we note that low-income countries are barely covered. Just as foreign direct investment, the CDM tends to flow into the more advanced developing countries. Table 2 shows the distribution of all projects registered until May 2010 across low- (LICs), lower middle- (LMICs), upper middle- (UMICs), and high-income countries (HICs). The latter category is naturally constrained by the fact the CDM is limited to developing countries by the rules of the Kyoto Protocol. Table 2 also distinguishes between World Bank projects and other projects.
Both World Bank and other projects primarily take place in UMICs. Overall, only about 2% of all CDM projects are hosted in LICs. However, the World Bank’s project share in LICs (7.7%) and LMICs (32.3%) is indeed higher than average. Moreover, the World Bank has no projects in HICs, while other such projects do exist (especially in Korea and Israel, but also in Cyprus, the Emirates, Qatar and Singapore). A more detailed distribution of CDM projects across different levels of GDP per capita is provided in Annex2.
Table 2 CDM projects by host country income level
Host country income level World Bank projects Other projects Total
LIC 5 41 46 7.69% 1.95% 2.12% LMIC 21 487 508 32.31% 23.12% 23.40% UMIC 39 1512 1551 60.00% 71.79% 71.44% HIC 0 66 66 0.00% 3.13% 3.04% Total 65 2106 2171 100.00 100.00 100.00
If we adopt a more specific sub-national perspective, the picture looks less positive for the World Bank. Table3shows the regional break-up for the three major CDM host countries China, India, and Brazil. In all three countries the overall number of projects is large, although only three World Bank projects have been registered in India and Brazil, so that the comparison of the regional distribution between the Bank and other actors makes sense only for the case of China.
Within China, the Bank has a much higher share of projects in economically advanced regions. The few projects it has in India are distributed equally, and in Brazil, two out of three are also in richer states. By comparison, non-World Bank projects are spread much more evenly across different regions, both in China and overall.
Thus while the Bank tends to select more projects in poor countries than other CDM project developers and buyers, it does not appear to focus on poor regions within countries.
In line with these descriptive results, the coefficient of country-level GDP per capita is negative in our multivariate regression model, confirming that Bank projects are found relatively more often in poor countries. However, the marginal effect is extremely small (see Table 4). In fact, even in the model in which the marginal effect is highest (the linear probability model, Regr. 4) a 1000 USD increase in GDP per capita reduces the probability for a World Bank project (as compared to another CDM project) by only 0.5%. Without the introduction of the host country dummies for China, India, and Brazil, GDP per capita is not even significant. But it is noteworthy that the Bank does have significantly less projects in these three most attractive host countries. If a project is in one of these countries, it is between 1 and 9% less likely to be a World Bank project (depending on country and specification).
However, at the regional level, the World Bank does not appear to be more poverty oriented than other CDM buyers when selecting the regions for its activities. Different regression specifications that included some of the regions with numerous projects in China, India or Brazil in the multivariate analysis did not provide any evidence for a pro-poor within-country orientation of the Bank (not shown). This again confirms the descriptive analysis.
4.2 Selection of Development-Oriented Project Types
Poverty or, more generally, development orientation, could also be based on the choice of project types. Careful consideration of the various project categories (and sub-categories) of existing CDM projects (see Annex 1) gives the impression that only few of these really address the needs of the very poor. Of course, improved stoves or solar cooking may improve their health status, but there are very few (2 and 5) projects of this type, probably because they are small, with high transaction cost, and thus commercially not very attractive. However, there are some projects that clearly show developmental benefits, although they are not specifically targeted to the poor, but rather generally improve the living conditions of the urban population. In this category, we have coal mine methane and ventilation air methane (26 projects), composting (37 projects) and landfill power (72 projects), which either improve coal mine safety or improve the management of solid waste. Other relatively frequent project
T able 3 CDM projects by income leve ls w ithin host-countrie s Ch ina India Braz il Re gional per capita inco me level W orld Ba nk Other projects T otal W orld Bank Other proj ects T otal W orld Bank Ot her proj ects T otal H igh 7 210 217 1 158 159 2 60 62 53.8 % 26.0 % 26.5 % 33.3 % 31.7% 31.7% 66.6% 35.7 % 36.3 % A verage 3 288 291 1 194 195 1 92 93 23.1 % 35.7 % 35.5 % 33.3 % 38.9% 38.8% 33.3% 54.8 % 54.4 % Lo w 3 309 312 1 147 148 0 16 16 23.1 % 38.3 % 38.0 % 33.3 % 29.5% 29.5% 0% 9.5% 9.4% T otal 13 807 820 3 499 502 3 168 171 100% 100% 100% 100% 100% 100% 100% 100% 100% Sou rces for regiona l per capita inco me: For Ch ina, U NDP ( 2010 , p. 131f.) prov ides an index valu e for regional GDP per capita, with an ove rall country mean of 0.683. O ur ca tegory “average ” contains provinc es with inde x values in the ran ge 0.63 3– 0.73 3. Provinces falling in the high inco me bra cket are: Beijing, Fuji an, Inner Mongolia , Jiangsu, Li aoning, Shando ng, Shangh ai, T ianjin and Zhejiang. The low inco me bracket con sists of Anhui, Gans u, Guangxi, Guizh ou, Jian gxi, Sichua n and Y unna n . For Indi a, we use 2007 –8 data from MOSPI ( 2009 ). The overall cou ntry mean is 30 ’000 Rs. and we def ine all states falling in the income ran ge 20 ’500 –30 ’500 Rs. as “avera ge. ” Sta tes falling in the high income bracke t are Delhi, Goa, Gujarat, Haryana, Himacha l Pradesh, K erala, Mah arashtr a and Punjab . The low income bracke t consists of Assam , Bihar , Chhattisgarh, Jam mu and K ashmir , Jhar khand, Madhya Pradesh, Orissa , Rajasthan and Uttar Pr adesh. For Braz il, we use data from Instituto Br asileiro de G eografia e E statística ( 2009 ). Mean G DP per capita is 16 ’000 R$ , and the state s we con sider as “avera ge ” are in the range between 12 ’000 –20 ’000 R$. Sta tes falling in the high inco me bracke t are Es pírito Santo, Sa nta Catarina and São Paulo, while the low inco me bracket con tains Alagoas, Bahia , Para íba, Pará, Pe rnambu co, Rio Gran de do N orte and T ocantins. If a single proj ect is ca rried out in multiple regions, the poorest reg ion determines our alloc ation
types such as reforestation or hydro projects may or may not show developmental benefits, depending on project details that are not directly available to us.
The World Bank does relatively well in selecting project categories that do at least have some potential to bring about developmental benefits. This is why in Regression 1 our development quality index has a positively significant coefficient. But again, the difference between the World Bank and other project buyers is not very strong and it is driven, primarily, by a higher share of landfill and reforestation projects (see Regressions 2–4).
As we cannot assess all project details here and have to rely on relatively rough project categories, we also consider the much more profound assessment of the so-called“Gold Standard.” This organization attempts to move carbon markets into a more development friendly orientation by providing labels for CDM projects that fulfill the criteria of developmental sustainability (e.g., projects with proven positive Table 4 Characteristics of World Bank projects
Regr. 1 Regr.2 Regr. 3 Regr. 4
Logita,b cluster p-value Logita,b cluster p-value Logita,b cluster p-value OLS cluster p-value GDP per capita −0.000001 0.55 −0.000001 0.50 −0.000002 0.00 −0.000005 0.00 Development quality 0.009484 0.00 0.003836 0.38 CERs 0.000006 0.00 0.000005 0.00 0.000004 0.00 0.000021 0.00 Submission date −0.000039 0.01 −0.000036 0.01 −0.000025 0.00 −0.000066 0.16 Landfill 0.040282 0.29 0.025869 0.00 0.056675 0.00 Reforestation 0.543211 0.00 0.297926 0.00 0.344487 0.00 China −0.015876 0.00 −0.055938 0.00 India −0.024851 0.05 −0.093497 0.06 Brazil −0.012395 0.01 −0.072884 0.01 2004 0.180630 0.03 2005 0.135554 0.00 2006 0.120086 0.01 2007 0.132059 0.04 2008 0.143890 0.06 2009 0.141993 0.09 Constant 1.106380 0.15 R²/pseudo R² 7% 14% 23% 10% N 2160 2160 2160 2160
The dependent variable in all regressions is a dummy variable indicating World Bank projects. A detailed
list of all variables with descriptions and sources is provided in Annex3
aFor the logit models, the table shows marginal effects (at the mean). For dummy variables the effect
shown is for a discrete change from 0 to 1
b
Results for the logit regressions are virtually identical if carried out with the rare-events adjustment suggested by Tomz et al. (1999)
social or employment effects). If the Bank also focuses on developmental sustainability we should expect it to have many projects with the corresponding label. However, until May 2010, only a single World Bank project (hydro/run of river in Honduras, submitted for validation in 2004) obtained the Gold Standard label. At the same time, 59 non-World Bank projects obtained this label. As a share of all projects, this is not significantly more than for the Bank, but the Bank is the only buyer that claims to have a strong development focus.
If the World Bank really has a strong focus on development oriented projects, the lack of Gold Standard projects is difficult to explain. It is possible, of course, that the Bank refrains from submitting projects to the Gold Standard in the first place. But then, one might again suspect that it has reasons to avoid an in-depth external assessment. Or does it avoid promoting the Gold Standard because it feels that some other institution (perhaps the Bank itself) should have the authority to mark“good” and“bad” CDM projects? Does it conceive the Gold Standard as a competitor in this sense? Of course, this would be at odds with the Bank's official objective to strive for the promotion of innovative market instruments.
4.3 Reduction of Activities Over Time
The above discussion leads us to the general question whether the Bank is serious about its objective of building up the market, and of crowding in private activities rather than crowding them out. As already mentioned above, one way to look at this is to consider the development of the Bank’s activities over time. If the objective is to build up the market, the Bank should reduce its own activities once the market works well. Indeed the negative coefficient of the submission date in Table4 indicates that the Bank was more prominently represented under the early CDM projects than under the projects submitted more recently. For each 100 days, the share of World Bank projects in total projects is reduced by about 0.3%. The coefficients of the year dummies in Regression 4 further indicate that, as compared to the base year 2003, the Bank’s activities have been stronger in subsequent years, but less so after 2004.9
However, this effect does not indicate any systematic trend and is far too small to suggest that the World Bank may indeed consider withdrawing from the market. Moreover, the effect may be driven entirely by the emergence of the high number of private market participants, rather than by a reduction of World Bank projects. The actual reduction of World Bank activities over time can only be measured in absolute terms.
Unfortunately, the fact that many of the projects submitted for validation since 2007 have not yet been registered leads to a general decrease in registered projects in recent years, which does not reflect an actual drop in market activity. We therefore resort to an annual count of all World Bank CDM projects ever submitted, whether they are registered or not, as long as we can detect them in the UNEP Riso Centre’s project database.
Figure1 shows the corresponding project numbers, both for the Bank (left axis) and for other project buyers (right axis). It seems that in terms of CDM projects submitted since 2006, the World Bank has closely followed the general upward trend of the market. There was a certain decrease of projects between 2005 and 2006, but
9
Note that in this regression, which includes both the submission date and the year dummies, the submission date primarily captures the additional time effect within each year.
the 2005 level was reached again in 2009. We thus do not find evidence for a phasing out of World Bank activities.
As a robustness check, the development over time was also considered for diverse sub-categories of projects. It could be that, as a whole, the Bank did not reduce its CDM activities, but that it shifted these activities towards areas into which private market participants were not willing to move. At least for registered projects, the data available do not show any such trends.
4.4 Selection of Commercially Attractive Projects
Let us finally consider whether the Bank favors commercially attractive projects. As mentioned above, commercial attractiveness is largely driven by the number of CERs a project can be expected to generate. Projects that generate many CERs are particularly profitable.
Table5provides some evidence on CERs generated by World Bank projects as compared to non-World Bank projects. It turns out that on average the Bank clearly selects the commercially more interesting projects. The difference is not driven by a few big projects but can be shown for different quantiles of the project distribution. It is visible not only for the CERs generated until the end of the crediting period (where the Bank could have an advantage simply by having been faster on the market), but also for annual CERs.
This observation is in line with the results of our regression analysis. Controlling for all other characteristics such as project submission date, type and location, the number of CERs remains positively related to World Bank projects. In the linear probability model, increasing project size by 1000 kt CO2leads to a 2% higher probability that the project is a World Bank project. In the logit models, marginal effects (at the mean) are smaller, but they are strongly significant throughout. We conclude that at least with respect to this criterion, World Bank project selection is certainly not less interest-oriented than project selection by other carbon market participants.
0 5 10 15 20 25 30 2003 2004 2005 2006 2007 2008 2009 0 200 400 600 800 1000 1200 1400
World Bank projects Other projects
Fig. 1 The development of all CDM project submissions over time. Note: Left axis for number of World Bank projects, right axis for number of non-World Bank projects. As opposed to the rest of this study, we consider all CDM projects submitted, whether they are already registered or not. As many projects developed during the last few years have not yet been registered, looking solely at registered projects does not accurately reflect current activity on the carbon market
5 Conclusion
All in all, our analysis of all projects registered until May 2010 under the Clean Development Mechanism of the Kyoto Protocol suggests that the World Bank's activities on the carbon market are driven both by host country need and by the Bank’s own interest. “The Bank” here stands for the IBRD and its Carbon Finance Unit created under the ESSD Vice-Presidency.
As compared to other, primarily private actors, the Bank shows a tendency to focus more on poor countries and on projects with a higher developmental impact. However, the size of these effects, as measured by our coefficient estimates, is rather small. Moreover, there is no evidence for a pro-poor orientation of the Bank within middle-income countries. In addition, the World Bank has only a single project with a Gold Standard label for sustainable development. If World Bank projects are indeed substantially more development oriented than other projects, one would expect that they should pass this external assessment far more often.
Observing World Bank activities over time, we do not observe a reduction of project numbers once other participants have become active on the market. This is somewhat inconsistent with the Bank’s claim to only take up a catalytic role, helping build up the market rather than being a competitor to private firms on the market. Since the Bank remains as active as before, it does appear as a competitor, albeit with a superior level of information, a privileged relationship to donor governments and the possibility to make use of development finance to subsidize some of its carbon market activities (e.g., commercial carbon market fairs). While the Bank may well have had a positive influence on market development in the first place, it seems to make use of it today for its own commercial benefit. This is also in line with the observation that the Bank selects some of the most commercially attractive projects, thereby effectively crowding out other market participants.
Overall, the available evidence clearly shows the ambivalence of the Bank’s role in the carbon market. Whether its impact on market development and poverty alleviation through the CDM is strong enough to justify its presence as a consultant for both buyers and sellers, as a project developer and as the manager of multiple trust funds, is difficult to say. From a poverty-reduction perspective, it is disturbing Table 5 Project size in terms of expected CERs (annual and until 2012)
Annual CERs CERs until 2012
World Bank other projects World Bank other projects
Smallest 5.6 0.5 29 0a 25% 26 23 179 110 50% (median) 67 49.5 341 227 75% 179 118 992 510 Largest 10437 10110 62905 57190 Mean 442 155.8 2524 774.4 In kt CO2 a
that the regional spread is inconsistent with the overall country-level picture. Moreover, much more transparency about the extent of direct and indirect subsidies would be required to assess whether they match the existing (albeit limited) positive externalities, or whether they lead to market distortions, i.e., to a competitive advantage of the Bank that is not effectively justified and crowds out more efficient private market participants. At the least, more transparency over the Bank’s activities in its multiple roles would be desirable (e.g., through a clear statement about World Bank involvement when projects are channeled to investors in World Bank funds). In addition, if the Bank is serious about its pioneering and catalyzing role, we should soon see a clear phasing out of World Bank activities in the CDM, along with its shift towards activities in the framework of the Bank’s new funds covering areas for which carbon credits cannot (yet) be obtained. And finally, as a promoter of innovative market instruments for development friendly carbon trade, the World Bank could be expected to make use of, and even actively support, the Gold Standard as a label for high quality CDM.
Acknowledgements We thank two anonymous referees and the participants of the Egon Sohmen
Memorial Conference on the“Political Economy of International Financial Institutions,” 10–13 June,
2010, Tübingen, for all their helpful and constructive suggestions. Special thanks go to Catherine Weaver
for her detailed and thoughtful comments that led us to dig a little deeper into the“black box” of the World
Bank. Finally, we thank Christopher Humphrey who helped us to improve the writing, and to reflect about some further interpretations of Bank behavior.
Annex 1: CDM Project Type Quality
Table 6 CDM project quality rating CDM project
type
Development quality Sub-type Quality
multiplier
Sub-type Quality
multiplier 0: no benefits, 1: few
benefits, 2: strong benefits
Afforestation 1 Adipic acid 0 HFC134a 1
Biomass energy
1 Aerobic treatment
of waste water
1 HFC23 0
CO2capture 0 Afforestation 1 HVAC & lighting 1
Cement 1 Agricultural residues: mustard crop 1 Higher efficiency coal power 1.5 Coal bed/ mine methane 2 Agricultural residues: other kinds 1 Higher efficiency steam boiler 1.5 EE households 2 Agricultural residues: poultry litter 2 Higher efficiency
using waste heat 1
EE industry 1 Agricultural
residues: rice husk
Table 6 (continued) CDM project type
Development quality Sub-type Quality
multiplier
Sub-type Quality
multiplier 0: no benefits, 1: few
benefits, 2: strong benefits
EE service 1 Bagasse power 1.5 Iron & steel 1
EE supply side
1 Biomass briquettes 2 Iron & steel heat 1
EE own generation
1 Black liquor 2 Klinker
replacement
1.5 Energy
distribution
1 Building materials 2 Landfill flaring 1
Fossil fuel switch
2 Building materials
heat
1 Landfill power 1.5
Fugitive 1 Bus Rapid Transit 2 Machinery 1
Geothermal 1 CMM &
Ventilation Air Methane
2 Manure 1
HFCs 0 CO2capture 0 Mining 1
Hydro 1 Cable cars 2 Natural gas
pipelines
1
Landfill gas 2 Caprolactam 0 New dam 0.5
Methane avoidance
2 Carbon black gas 1 New natural gas
plant
1
N2O 0 Cement 1 New natural gas
plant using LNG 1 PFCs and
SF6
0 Cement heat 1 Nitric acid 0
Reforestation 1 Charcoal
production
2 Non-ferrous
metals
1
Solar 2 Chemicals 1 Non-ferrous
metals heat
1
Tidal 1 Chemicals heat 1 Oil and gas
processing flaring
1
Transport 2 Coal to natural gas 1 Oil field flaring
reduction
1
Wind 1 Cogeneration 1.5 Oil to natural gas 1
Coke oven gas 1 PFCs 0
Combustion of MSW
0 Palm oil solid
waste 1 Composting 1.5 Paper 1 Connection of isolated grid 2 Petrochemicals 1 District heating boilers 1.5 Petrochemicals heat 1
Domestic manure 1.5 Power plant
rehabilitation 1
In this section we outline the arguments on which we base the allocation of projects to the different categories regarding development benefits. First, we distinguish between the general project types. Second, we discuss multipliers for sub-types in order to capture differences within individual project types. In both cases, the value range goes from 0 to 2, with 2 indicating the highest development benefits. When projects are evaluated at the sub-type level this leads to values that effectively range from 0 to 4, because type classifications and type classifications are multiplied. Project sub-types getting the value 1 share the characteristics of their main type.
We structure the following discussion along the major categories for the general project types.
(i) High development quality: category 2
Category 2 is employed for projects with generally high development benefits. Coal mine methane reduction leads to a significant improvement in mine safety and provides energy to remote mining communities. Energy efficiency improvement in households, for example through efficient stoves or lighting, reduces energy bills and therefore frees income for other expenses. The switch from coal to other fuels reduces local pollution, often in locations with Table 6 (continued)
CDM project type
Development quality Sub-type Quality
multiplier
Sub-type Quality
multiplier 0: no benefits, 1: few
benefits, 2: strong benefits
EE new buildings 1 Rail: regenerative
braking
1 EE public
buildings
1 Reforestation 1
Electronics 0 Run of river 1
Existing dam 2 SF6 0
Food 1 Single cycle to
combined cycle 1.5
Forest biomass 0 Solar PV 1
Forest residues: other 0.5 Solar cooking 1.5 Forest residues: sawmill waste 0.5 Solar thermal electric 1 Gasification of biomass 1 Stoves 1.5 Geothermal electricity 1 Textiles 1 Glass 1 Tidal 1
Glass heat 1 Wastewater 1
an above average share of poor population groups, and thereby generates high development benefits, in particular through improved health. Methane avoidance from waste as well as landfill gas collection requires a managed landfill that does not burn or emit leachates that pollute the groundwater. Health benefits for the poor communities living near the landfills are substantial. Solar power is generally utilized in off-grid and rural areas and thus introduces electricity to lagging regions. Projects involving the transport sector improve urban infrastructures. This usually benefits the poor, in particularly in the case of cable cars in slums and of bus lane systems. Within the category biomass power, use of poultry litter and black liquor allows generating energy from a noxious waste that has led to massive pollution. Production of briquettes generates a substantial number of jobs. Energy efficient building materials are also labor-intensive. Improved charcoal production leads to increased revenues for marginalized groups. Connection of isolated electric grids improves reliability of electricity production in remote areas. Building a hydropower plant on an existing dam generates electricity and thereby contributes to development (without the potentially negative impacts of new dams).
(ii) Some development quality: category 1.5
The category 1.5 is used only for sub-types. It is used when these sub-types generate good but not superb development benefits. Bagasse power falls into this category as projects can lead to substantial development benefits if implemented in small sugar mills, whereas large projects provide mainly indirect benefits through their electricity generation. Likewise, benefits of cogeneration and efficient district heating systems depend on the project design. Composting of waste, biogas from domestic manure and landfill gas-to-energy projects are clearly better than pure landfill gas flaring projects. Efficiency improvement of thermal power plants, including conversion of single to combined cycle plants, and industrial boilers reduces local pollution. Substitution of klinker by waste such as fly ash lead to the elimination of pollution linked to the dumping of the waste. Solar cooking as well as distribution of efficient stoves usually benefits poor groups in a similar way as the switch from coal to other fuels discussed above under (i).
(iii) Undetermined development quality: category 1
Projects in category 1 can have development benefits if implemented in a careful manner. However, they can also have negative impacts under certain circumstances. Their effect thus depends effectively on the sub-type multiplier. Afforestation and reforestation projects can have benefits for the local population if organized in a way involving the community. For example, seedling nurseries can generate substantial numbers of jobs and agroforestry activities can increase crop revenues. Forested slopes usually reduce runoff in extreme precipitation events. On the other hand, monoculture projects can lead to decreased runoff, eviction of marginalized people that do not have formal land titles, as well as reduced access to non-timber forest products. Biomass energy can lead to substantial benefits for the local population if implemented in a decentralized way and using crop residues that have not been used so far—therefore giving value to a resource that can be monetized by the rural population and creating jobs. If however projects divert residues from