https://doi.org/10.5194/gi-6-397-2017
© Author(s) 2017. This work is distributed under the Creative Commons Attribution 3.0 License.
Re-establishing glacier monitoring in Kyrgyzstan
and Uzbekistan, Central Asia
Martin Hoelzle1, Erlan Azisov2, Martina Barandun1, Matthias Huss1,3, Daniel Farinotti3,4, Abror Gafurov5, Wilfried Hagg6, Ruslan Kenzhebaev2, Marlene Kronenberg1,7, Horst Machguth1,8, Alexandr Merkushkin10, Bolot Moldobekov2, Maxim Petrov9, Tomas Saks1, Nadine Salzmann1, Tilo Schöne5, Yuri Tarasov10, Ryskul Usubaliev2, Sergiy Vorogushyn5, Andrey Yakovlev11, and Michael Zemp8
1Department of Geosciences, University of Fribourg, Fribourg, Switzerland 2Central Asian Institute for Applied Geosciences, CAIAG, Bishkek, Kyrgyzstan
3Laboratory of Hydraulics, Hydrology and Glaciology (VAW), ETH Zurich, Zurich, Switzerland 4Swiss Federal Institute for Forest, Snow and Landscape Research WSL, Birmensdorf, Switzerland 5GFZ German Research Center for Geosciences, Potsdam, Germany
6Department of Geography, University of Munich, Munich, Germany 7Meteodat GmbH, Zurich, Switzerland
8Department of Geography, University of Zurich, Zurich, Switzerland 9Glacial Geology Laboratory, Tashkent, Uzbekistan
10NIGMI of UzHydromet, Tashkent, Uzbekistan
11Uzbek scientific investigation and design survey institute, UzGIP, Tashkent, Uzbekistan Correspondence to:Martin Hoelzle (martin.hoelzle@unifr.ch)
Received: 10 April 2017 – Discussion started: 15 May 2017
Revised: 26 August 2017 – Accepted: 9 September 2017 – Published: 12 October 2017
Abstract. Glacier mass loss is among the clearest indicators of atmospheric warming. The observation of these changes is one of the major objectives of the international climate mon-itoring strategy developed by the Global Climate Observing System (GCOS). Long-term glacier mass balance measure-ments are furthermore the basis for calibrating and validating models simulating future runoff of glacierised catchments. This is essential for Central Asia, which is one of the dri-est continental regions of the Northern Hemisphere. In the highly populated regions, water shortage due to decreased glacierisation potentially leads to pronounced political insta-bility, drastic ecological changes and endangered food se-curity. As a consequence of the collapse of the former So-viet Union, however, many valuable glacier monitoring sites in the Tien Shan and Pamir Mountains were abandoned. In recent years, multinational actors have re-established a set of important in situ measuring sites to continue the invalu-able long-term data series. This paper introduces the applied monitoring strategy for selected glaciers in the Kyrgyz and Uzbek Tien Shan and Pamir, highlights the existing and the
new measurements on these glaciers, and presents an exam-ple for how the old and new data can be combined to estab-lish multi-decadal mass balance time series. This is crucial for understanding the impact of climate change on glaciers in this region.
1 Introduction
Glacier fluctuations in mountain areas have been monitored in various parts of the world for more than a century (Hae-berli et al., 2007; Zemp et al., 2015), and glacier changes are considered to be reliable indicators of worldwide at-mospheric warming trends (IPCC, 2013). Mountain glaciers and ice caps are important for early-detection strategies in global climate-related observations. Hence, glaciers are one of the “essential climate variables” (ECVs) in the Global Climate Observing System (GCOS). Embedded in GCOS is the Global Terrestrial Network for Glaciers (GTN-G) oper-ated by the World Glacier Monitoring Service (WGMS), the
US National Snow and Ice Data Center (NSIDC), and the Global Land Ice Measurements from Space (GLIMS) initia-tive. These institutions follow the so-called Global Hierar-chical Observing Strategy (GHOST) (WMO, 1997b, 2010) forming the basis for the strategic observation framework. The main objectives of long-term glacier monitoring are related to (1) process understanding, (2) model validation and/or calibration, (3) change detection and (4) impact as-sessment. Furthermore, they play a key role for assessing climate change effects such as estimating sea-level rise, re-gional changes in runoff and impacts of natural hazards. In particular, countries and regions that are vulnerable to climate change rely on a sound and continuous long-term database providing the necessary information to cope with future challenges in different areas such as water manage-ment, irrigation for agriculture, disaster risk reduction and public health.
Continuous in situ monitoring of glaciers in remote areas is a challenging task, and maintaining the necessary measure-ments can be both logistically and economically demanding. Reasons include missing long-term financial and/or human resources as well as general political instability, access to re-mote regions, natural hazards or missing infrastructure. In many countries with glacierised mountain ranges, continuous observations are thus lacking. For these reasons, monitoring strategies need to be improved, and different techniques such as in situ measurements, remote sensing and modelling have to be combined to generate high-quality products.
Currently, a re-establishment of historical monitoring sites in Kyrgyzstan and Uzbekistan is jointly being developed by different international projects including Capacity Building and Twinning for Climate Observing Systems (CATCOS), Central Asian Water (CAWa), Cryospheric Climate Services for improved Adaptation (CICADA) or Contribution to High Asia Runoff from Ice and Snow (CHARIS). In the frame of those projects, the measurement series on selected glaciers (see Fig. 1) in Kyrgyzstan and Uzbekistan are (re-)initiated. The project CATCOS had two phases; the first phase was from 2011 to 2013, which was mainly related to the tech-nical installations; and the second phase from 2014 to 2016 was mainly used for capacity building and twinning activi-ties. The project will be continued within the next years in a cooperative effort between Kyrgyzstan, Uzbekistan, Ger-many and Switzerland.
This paper aims at presenting and discussing the major steps and methodologies developed and applied in Kyrgyzs-tan and UzbekisKyrgyzs-tan to (re-)establish glacier monitoring at the most important sites within the two projects CATCOS and CAWa (Fig. 1). The described methods and experience might be a blue print for similar cases in other parts of the world. The key steps, around which this paper is centred, are the (1) collection, homogenisation and securing of historical data; and (2) the re-establishment of glacier monitoring; and (3) capacity building and twinning.
2 Glaciers in Central Asia
Glaciers in Central Asia constitute an important water stor-age component (e.g. Immerzeel et al., 2010; Kaser et al., 2010; Duethmann et al., 2015), which is of particular impor-tance for different sectors including agriculture and energy production (Siegfried et al., 2012). With the ongoing climate change the corresponding variations in glacier area and vol-ume in this region are considerable. Most studies agree on the general trend of glacier mass loss, including an acceleration since the 1970s (e.g. Sorg et al., 2012; Farinotti et al., 2015). Regarding seasonal changes, however, the studies disagree. In their comprehensive review on past changes in high-altitude areas of Central Asian headwaters, Unger-Shayesteh et al. (2013) conclude that there is (i) a lack of reliable data, especially for the glacio-nival zone; (ii) methodological lim-itation in trend analysis; and (iii) a strong heterogeneity in spatial and temporal extent of the available analyses. These restrictions hamper a sound synthesis for the whole region and limit the understanding of interactions between changes in highly variable climate parameters, the cryosphere and the hydrological response of headwater catchments. Altogether, these shortcomings indicate the importance of high-quality in situ measurements, which are required for a better cali-bration and validation of local to regional-scale models for estimating future glacier mass balance and runoff.
2.1 Tien Shan
Glaciers in the Tien Shan cover around 12 400 km2, of which about 7400 km2 is situated in Kyrgyzstan according to the Randolph Glacier Inventory Version 5.0 (RGIv5.0) and about 117 km2 in Uzbekistan (Arendt et al., 2015). In the Tien Shan, only two continuous long-term glacier mass balance series are presently available (Tuyuksu glacier in Kazakhstan and Urumqi Glacier No. 1 in China). Two long-term mass balance measurements in the Kyrgyz Tien Shan were dis-continued in the 1990s (Golubin and Karabatkak). Whereas glaciers in the western part of the Tien Shan receive winter accumulation, glaciers in the east are summer-accumulation-type glaciers. Furthermore, annual precipitation sums reach a maximum in the northwest and decrease south-eastwards (Voloshina, 1988). This shift goes along with an alteration of the annual precipitation maximum, which is earlier in the west and in summer in the east (Dyurgerov et al., 1994). Kriegel et al. (2013) show a temperature change of 0.1– 0.2◦C per decade for the ablation period (April–September) during 1960–2007 for the Naryn station. The same authors indicate an unequivocal change in precipitation across a few stations in the central Tien Shan. A decrease in snow cover has been observed for the period from 1960 to 2007 in the entire Tien Shan (Chen et al., 2016). Precipitation changes seem to be less important. Higher air temperatures resulted in positive runoff trends in spring and autumn for the Naryn catchment, which is likely to be related to enhanced snow
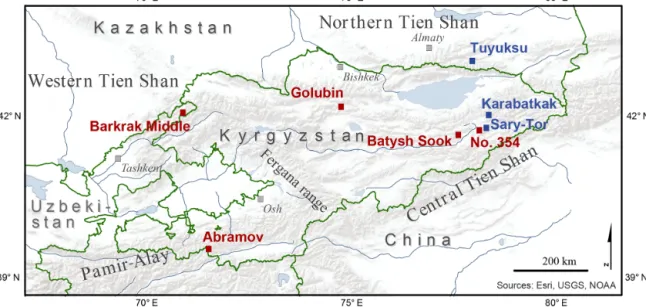
Figure 1. Map of glaciers in Central Asia, where the investigations were gradually re-established starting in 2010. Red symbols show glaciers investigated within the CATCOS and CAWa projects, and blue symbols show glaciers that are covered by other projects such as CHARIS.
and glacier melt corresponding also to the observed annual area shrinkage rates since the middle of the 20th century (e.g. Sorg et al., 2012). For the Small Naryn river, significant neg-ative runoff trends were found, whereas for the Big Naryn river a positive but not significant trend was found for Au-gust, which is the month with the largest glacier runoff con-tribution (Kriegel et al., 2013).
2.2 Pamir-Alay
In the Pamir, glaciers cover approximately 12 100 km2. The subregion Pamir-Alay has a total glacier area of around 1850 km2(both values are based on RGIv5.0). In the Pamir-Alay, direct mass balance measurements only exist for the Abramov glacier (Fig. 1). For the Pamir-Alay, a strong gra-dient in the equilibrium line altitude (ELA) from west to east is observed (Glazirin et al., 1993). This is linked to impor-tant differences in precipitation (Suslov and Akbarov, 1973). According to Suslov and Akbarov (1973) and Glazirin et al. (1993), the maximum annual precipitation in the Pamir-Alay is about 1900 mm a−1in the western part at the border be-tween Kyrgyzstan and Tadjikistan, and about 400 mm a−1in the eastern part. The seasonal precipitation regime also dif-fers from west to east: whilst the west shows a maximum pre-cipitation during autumn and winter, the east is characterised by a maximum during spring and summer. Therefore, both accumulation and ablation are region dependent, resulting in different glacier surface mass balance gradients. This also influences total discharge from glaciers, which is estimated as 1.6 km3a−1, corresponding to about 8 % of the total an-nual runoff of all rivers in Central Asia (Suslov and Akbarov, 1973). Focusing on a region in the eastern Pamir, Khromova et al. (2006) found a reduction in glacier area of 10 % from
1978 to 1990 and of 9 % from 1990 to 2001. Glacier front variations with annual rates of −11.6 m a−1 for very large glaciers, of −7.3 m a−1for valley glaciers and of −3.3 m a−1 for smaller glaciers were observed. The high sensitivity of glaciers to summer temperatures is assumed to be responsible for the long-term retreat (Glazirin et al., 2002). The negative mass budget of the glaciers in this region indicates that in-creased winter and summer precipitation cannot compensate for the increase in air temperature (Khromova et al., 2006). A smaller reduction in glacier area of 3 % a−1for the period 2000 and 2007 was observed by Narama et al. (2010) for a region which is close to the southeastern Fergana mountain range situated in the east of the Pamir-Alay.
3 Instrumentation, methods and data 3.1 Monitoring strategy
The applied strategy to re-establish glacier observation net-works in Central Asia is partly based on tiers 2 and 3 of GHOST (WMO, 1997a, b) and the experience gained in different monitoring projects. For glacier mass balance, the strategy is composed of several components:
1. mass balance measurements using the glaciological method;
2. observation of the transient snow line on photographs from terrestrial automatic cameras and/or on satellite images during the summer months; and
3. a mass balance model driven by nearby automatic weather station data, reanalysis data or climate model results (see Fig. 2).
Direct
measurements
(stakes & snow pits)
Validation
Establish relationship
Reconstruct / model past, current or future
mass balances
Snowline
observations
(in situ cameras / satellite images)
Mass balance
model
CalibrationMeteo
information
Meteostation data ER40 data RCM dataGeodetic
survey
Figure 2. Schematic view of the monitoring strategy applied for re-established measurements in Central Asia.
As an important additional element, geodetic measurements should be integrated for calibration or validation purposes depending on the given objectives. The combination of the different approaches allows producing accurate mass balance estimates with a high temporal and spatial resolution (e.g. Zemp et al., 2013). An important advantage of the described strategy is that all different components can be used indepen-dently (e.g. Huss et al., 2009).
The re-establishment of the in situ glacier monitoring has to obey certain criteria for the selection of the glaciers. These are based on several preconditions such as field-site acces-sibility, availability of historical data, geo-climatic distribu-tion within mountain ranges, suitability for long-term mon-itoring based on glaciological feasibility and the availabil-ity of other measurements. Based on these criteria, the five glaciers Abramov, Golubin, Batysh Sook, Glacier No. 354 and Barkrak Middle were selected within the projects CAT-COS and CAWa (see Fig. 1 and Table 1).
3.2 Implementation
The implementation of the measurement network within the re-establishing activities (in the following referred to as the “new” measurement network) takes advantage of the con-cept described above. Our approach is summarised below to clarify the individual steps during the re-establishment of the mass balance series:
1. Finding appropriate collaboration partners.
2. Collection of all historical mass balance data from dif-ferent sources.
3. Based on a review of these data and expert knowledge, the glacier selection was conducted and accordingly the new mass balance network was designed.
Table 1. Information of observed glaciers and type of measurements currently available from WGMS (2013) for mass balance (mb) and frontal variation (fv), see Fig. 1 for location.
Glacier Type Period Interval Re-start
Golubin mb 32 1968 2016 2010 Golubin fv 30 1861 2016 2011 Abramov mb 36 1967 2016 2011 Abramov fv 17 1850 2016 2011 Batysh Sook mb 11 1970 2016 2010 Batysh Sook fv 17 1975 2016 2010 Glacier No. 354 mb 6 2010 2016 2010 Glacier No. 354 fv 14 1972 2016 2010 Barkrak Middle mb – – – 2016 Barkrak Middle fv 18 1970 1990 2016
4. Set-up of the new glaciological mass balance measure-ment networks on the selected glaciers in the years 2010 (Golubin, Batysh Sook, Glacier No. 354), 2011 (Abramov) and 2016 (Barkrak Middle). In parallel, installation of automatic snow line cameras and new weather stations close to the glaciers in collaboration with partners in the CAWa project from Kyrgyzstan, Uzbekistan, Germany and Switzerland.
5. Selection of satellite images with optimal visibility of melt-out patterns and snow lines.
6. A mass balance model was used as an extrapolation tool to obtain from mass balance point measurements the glacier-wide mass balance. Model validation was per-formed using snow line measurements from the auto-matic cameras or from satellite images. The model also served for reconstructing mass balance for periods with longer data gaps.
7. Comparison of mass balance retrieved by in situ mea-surements and geodetic meamea-surements.
3.3 Glacier observations
3.3.1 Data from WGMS and literature
Glacier monitoring in Central Asia started more than 60 years ago. During this time, several different glaciolog-ical programmes were established in the mountain ranges of Kyrgyzstan, Kazakhstan, Uzbekistan and Tajikistan. We compiled all available glacier data from the WGMS (WGMS, 2013). The total number of past glacier observations are sum-marised in Table 2, delivering basic information related to all existing measurements having an observation period longer than 2 years. For 17 glaciers, mass balance measurements exist with mean observation period lengths close to 20 years. Thickness change measurements for 9 glaciers and repeated front variation measurements for 62 glaciers with measure-ment periods from 9 to 20 years are also available. Most of the mass balance measurements were initiated between 1960 and 1970 and were discontinued in the 1990s. De-tailed description of stake and snow pit measurements for the Abramov glacier were retrieved from Pertziger (1996). 3.3.2 Glaciological measurements
The determination of the mass balance of a glacier using the so-called glaciological method is the standard method used since the earliest times of mass balance measurements (Mercanton, 1916). This robust method is widely used to de-termine the seasonal to annual mass change of individual glaciers. It is based on measurements of ablation at stakes, which are drilled into the ice of the ablation area, and of snow depth and density measured in snow pits in the accumulation area. The advantage of this method is the direct determina-tion of the temporal evoludetermina-tion of mass balance. Calculadetermina-tion of the total mass change derived from point measurements, however, can be challenging since individual stake readings and snow pit data have to be extrapolated over the glacier, thus resulting in considerable uncertainties (for further de-tails, see Østrem and Brugman, 1991; Kaser et al., 2003; Thibert et al., 2008; Cogley et al., 2011).
On the (re-)established glaciers the following measure-ments were carried out:
– For the ablation measurements in late summer, plastic or wooden stakes were drilled into the ice in the ablation area to a depth related to the expected melt rate at the corresponding altitude varying on the observed glaciers between around 2 to 10 m. This was done with an auger or a steam drill.
– In the accumulation area, several snow pits were dug to determine the annual snow accumulation and its density. Additionally, several snow depth measurements with
Table 2. Information on glaciers before the re-establishment of the measurements was initiated based on WGMS (2013). Abbre-viations: KG, Kyrgyzstan; KZ, Kazakstan; UZ, Uzbekistan; TJ, Tajikistan; mb, mass balance measurements; tc, geodetic thickness change; fv, front variations.
Country Meas. Glaciers Mean Mean Mean observed observation start end period date date
KG mb 7 19 1973 1994 KG tc 2 2 1977 1989 KG fv 19 9 1954 2002 KZ mb 9 19 1974 1992 KZ tc 7 2 1958 1998 KZ fv 11 16 1957 1987 UZ mb 0 UZ tc 0 UZ fv 11 20 1965 1988 TJ mb 1 3 1983 1985 TJ tc 0 TJ fv 21 11 1968 1989
steel or aluminium rods of 2 to 5 m length were per-formed. Theses were combined with occasional ground-penetrating radar (GPR) measurements using a fre-quency of 800 MHz to detect snow layers of former years. This information allows an improved extrapo-lation of the highly variable snow distribution on the glacier (Sold et al., 2013) and reconstructing past ac-cumulation rates back to almost one decade (Sold et al., 2015).
– Frontal variations in glacier length were measured at the glacier tongue using handheld GPS and/or were digi-tised based on satellite images.
The stake and snow pit locations aim at representing the former transects of measurement on the glaciers to allow comparability. The total number of new stakes and pits, how-ever, had to be reduced substantially to keep the annual work load on a manageable level.
3.3.3 Geodetic mass balance
Geodetic mass balance measurements are useful to infer mass and volume changes of glaciers over decadal periods (Ahlmann, 1924), providing considerable precision and high spatial resolution. Digital elevation models (DEMs) derived from different sources such as topographic maps, GPS sur-veys, aerial photographs, satellite images, synthetic-aperture radar or Light Detection and Ranging (LiDAR) are compared to each other, and the elevation differences over the glacier can be converted into the glacier’s mass change over a given time interval (e.g. Bauder et al., 2007; Thibert and Vincent, 2009; Zemp et al., 2013). In general, multi-annual time peri-ods are needed to reach an acceptable level of accuracy (Paul
et al., 2013). The most important uncertainties are due to (i) density conversion (Huss, 2013), (ii) elevation biases and errors in the co-registration of the two DEMs (Berthier et al., 2006; Paul, 2008; Nuth and Kääb, 2011), (iii) data gaps, (Pieczonka et al., 2011; Bolch and Buchroithner, 2008), and (iv) errors and artefacts in the DEMs.
Geodetic glacier volume changes focusing on Central Asia often rely on the Shuttle Radar Topography Mission (SRTM) as a baseline for the year 2000 (e.g. Berthier et al., 2010; Gardelle et al., 2012, 2013; Surazakov and Aizen, 2006). However, the quality of the SRTM DEM is affected by elec-tromagnetic wave penetration into the snow and ice. This can lead to major uncertainties, especially affecting eleva-tion changes in the accumulaeleva-tion area, for which correceleva-tions have to be applied (Berthier et al., 2006; Gardelle et al., 2012, 2013; Kääb et al., 2015) These corrections, however, are difficult to quantify as they strongly vary with local con-ditions (Kääb et al., 2015). Other data sources for the geode-tic method applied in Central Asia are topographic maps or stereo imagery derived from several sensors operating in the visible range of the spectrum, such as ASTER (Ad-vanced Spaceborne Thermal Emission and Reflection Ra-diometer), SPOT (Satellite pour l’observation de la Terre), Cartosat, Corona or Hexagon data (e.g. Hagg et al., 2004; Bolch et al., 2011, 2012; Pieczonka et al., 2013; Gardelle et al., 2013; Pieczonka and Bolch, 2015; Bolch, 2015; Pe-trakov et al., 2016). Furthermore, laser altimetry measure-ments, e.g. from the ICESat satellite mission operated be-tween 2003 and 2009, offer a possibility of mass change computation for mountain glaciers (Kääb et al., 2012; Gard-ner et al., 2013; Neckel et al., 2014; Farinotti et al., 2015). Elevation differences at points along the repeated tracks are interpolated and converted into volume and mass changes. Due to point measurements and uncertainties associated with interpolation, this method instead delivers robust results on large scales and not for individual glaciers.
3.3.4 Snow line observations
The calculation of glacier-wide annual mass balance from statistical relations using ELA and accumulation area ratio (AAR) is well established (Braithwaite and Müller, 1980; Braithwaite, 1984; Benn and Lehmkuhl, 2000; Kulkarni, 1992). It has been applied in many different mountain ranges (Kulkarni, 1992; Rabatel et al., 2008; Chinn et al., 2012; Stumm, 2011), and it is often used to relate temperature and precipitation with mass balance (Kuhn, 1984; Ohmura et al., 1992). Generally, ELA and the annual mass balance are well correlated (Rabatel et al., 2005, 2012). The advantage of us-ing ELA and AAR is their straightforward mappus-ing usus-ing remote sensing data (Rabatel et al., 2013). However, this ap-proach relies on the calibration against long-term glaciolog-ical in situ measurements. An interesting alternative is the use of transient snow lines. Their monitoring can be used as a good proxy for the sub-seasonal mass balance (Huss et al.,
2013). The distinction between snow-covered and snow-free zones on a glacier can be retrieved by different means such as analysis of repeated images taken by terrestrial cameras and satellites, or by mapping with GPS. This information can be used to establish and analyse snow-cover depletion curves (e.g. Parajka et al., 2012), and, in combination with corre-sponding model approaches, the water equivalent of the win-ter snow cover can be directly extracted (e.g. Martinec and Rango, 1981; Schaper et al., 1999). Repeated snow line ob-servations during the ablation period are also used for mass balance model validation (Kenzhebaev et al., 2017; Baran-dun et al., 2015; Kronenberg et al., 2016).
The annual course of the snow line, and the related snow-covered area fraction, was recently used in combination with a backward modelling approach to determine sub-seasonal mass balance values (Hulth et al., 2013; Huss et al., 2013). The approach by Huss et al. (2013) uses transient snow line observations and meteorological information in combination with a mass balance model. Remote monitoring for glaciers with limited accessibility is thus possible. It also offers an important backup that helps to achieve a better coverage with mass balance estimates and thus to reduce future data gaps.
In the framework of the CATCOS project, we installed six terrestrial cameras (Mobotix, M15 and M25) for snow line observation: two cameras at the Abramov glacier, two cameras at the Golubin glacier, one camera at Glacier No. 354 and one camera at the Barkrak Middle glacier. Every day, eight pictures are taken, transferred to a nearby CAWa meteorological station, and sent via satellite connection to a database (Schöne et al., 2013). For Glacier No. 354 (Kyr-gyzstan) and the Barkrak Middle glacier (Uzbekistan), data are stored locally and downloaded once a year.
3.3.5 Meteorological measurements
Meteorological data constitute an important component of a complete glacier monitoring approach as a required input to mass balance models. There has been an extensive net-work of continuous long-term meteorological time series of air temperature and precipitation in Central Asian countries during the Soviet Union times (Aizen et al., 1995b). How-ever, this network thinned out considerably during the recent past (Unger-Shayesteh et al., 2013).
Some new meteorological stations were installed in the close vicinity of the Abramov glacier in 2011 and the Gol-ubin glacier in 2013 by the CAWa project (Schöne et al., 2013). These two stations were equipped with standard me-teorological and ground sensors (see detailed description in Schöne et al., 2013). Data access is open and facilitated by GeoForschungsZentrum (GFZ) in Potsdam and CAIAG in Kyrgyzstan (http://sdss.caiag.kg). Meteorological infor-mation for the glaciers Batysh Sook and Glacier No. 354 is retrieved from the nearby Tien Shan meteorological sta-tion (3660 m a.s.l.). This stasta-tion has been operasta-tional since 1930 but was relocated in 1997. This causes a shift in the
data, hampering its use for long-term studies. Data are avail-able from the National Hydrometeorological Service of Kyr-gyzstan. A small meteorological station was installed in the glacier forefield of the Barkrak Middle glacier in 2016 by the CATCOS project.
The access to several historical meteorological time series is, for example, provided by the Northern Eurasia Earth Sci-ence Partnership Initiative (NEESPI). Datasets such as re-analysis products – e.g. NCEP–NCAR R1 (US National Cen-ters for Environmental Prediction–US National Center for Atmospheric Research), ERA-Interim (European Centre for Medium-Range Weather Forecasts Reanalysis) or MERRA (Modern-Era Retrospective Analysis for Research and Ap-plications) can be used to fill data gaps and to extend data records back in time (e.g. Salzmann et al., 2013; Schär et al., 2004; Schienmann et al., 2008; Schmidli et al., 2001). 3.3.6 Establishing multi-decadal mass balance series The combination of the methods described in the above chap-ters allows fully exploiting the richness of the available data. Our approach is visualised schematically in Fig. 2, and an example is shown in Fig. 4. Establishing multi-decadal mass balance series for data-scarce regions or time periods re-quires various data sources to be combined in an optimal way. The methodology that has been presented already in dif-ferent studies (e.g. Barandun et al., 2015; Kronenberg et al., 2016; Kenzhebaev et al., 2017) is shortly summarised here-after.
The core of the establishment of long-term mass balance series is made up of in situ data (stake and snow pit mea-surements and meteorological information, such as precipi-tation and temperature), a mass balance model, and remote sensing products such as optical satellite sensors and terres-trial cameras. The model used can either be a simple degree day or a more sophisticated energy balance model, which is able to produce sub-seasonal mass balance as an output (e.g. Machguth et al., 2006; Huss et al., 2008, 2009). Depending on the objective of the application, different investigations are possible with the ingredients of the strategy presented in Fig. 2. In Barandun et al. (2015, for details), for example, we reanalysed mass balance data from the period 1968–1994 and calculated glacier-wide balances for the years without measurements to establish a continuous series covering the period 1968–2014 using a spatially distributed simple energy balance model (Fig. 4). The model was calibrated with sea-sonal mass balance data and was subsequently used to re-construct the mass balance for the period with no measure-ments. Model validation was performed by using snow line observations derived from optical satellite images and, when available, also from images of an automatic camera. In a fi-nal step, the resulting mass balance values covering several years or decades were compared to the geodetic glacier vol-ume change determined based on the comparison of digital elevation models (Barandun et al., 2015).
4 Investigations at individual monitoring sites
In the recent past, results of glacier monitoring activities in Central Asia (except Kazhakstan and China) are mainly based on remote sensing techniques with a focus on geode-tic area and volume change assessments (see Table 4) or front variation measurements (Aizen et al., 2007; Konovalov and Desinov, 2007; Niederer et al., 2007; Haritashya et al., 2009; Kääb et al., 2015; Narama et al., 2010; Hagg et al., 2013; Kriegel et al., 2013; Gardelle et al., 2013; Gardner et al., 2013; Ozmonov et al., 2013; Pieczonka et al., 2013; Khromova et al., 2014; Bolch, 2015; Pieczonka and Bolch, 2015; Farinotti et al., 2015; Petrakov et al., 2016). Between 1994 and 1998, most of the in situ glacier observation pro-grammes were discontinued. The re-initiation of in situ mon-itoring activities on five selected glaciers – Abramov, Golu-bin, Batysh Sook, Glacier No. 354 and Barkrak Middle – now continues the historical measurement series and is described in the following sections, with the main findings emerging from the current and historical monitoring. At some other glaciers, such as Karabatkak or Sary-Tor, a re-establishment programme was also developed under the auspices of the Kyrgyz Institute of Water Problem and Hydropower Engi-neering together with the Moscow State University within the project CHARIS financed by USAID.
4.1 Abramov glacier, Kyrgyzstan
The Abramov glacier is a valley-type glacier and is located in the northern slope of Pamir-Alay (Kyrgyzstan) within the basin of the Vakhsh River, which is one of the largest trib-utaries of the Amu Darya river (Fig. 1). The glacier drains into the Koksu River, which has a hydrological catchment area of 58 km2with a glacierisation of roughly 51 % (Hagg et al., 2006). Abramov has a surface area of about 24 km2(in 2013) and a volume of 2.54 km3(Huss and Farinotti, 2012). The glacier is exposed to the north and ranges from about 3600 to 5000 m a.s.l.
Annual mean air temperature at the equilibrium line of the glacier (around 4260 m a.s.l.) is −6.5 to −8◦C (Kam-nyansky, 2001). Average annual precipitation measured at 3837 m a.s.l. is about 750 mm (Glazirin et al., 1993). The glacier is assumed to have a temperate accumulation zone with cold ice near the surface in the ablation area, even though slightly negative temperatures were reported in the accumulation area by Kislov et al. (1977).
A research station at the Abramov glacier was built in 1967 by the Central Asian Hydrometeorological Institute (SANIGMI) in Tashkent, guaranteeing the continuous col-lection of glaciological and meteorological observations. The station was destroyed in the late 1990s during politically un-stable times (Fig. 3). With the station, other valuable equip-ment and the measureequip-ment network were also lost.
Continuous and detailed mass balance measurements ex-ist from 1968 to 1994 (Pertziger, 1996), whereas from
Figure 3. (a) Abramov research station in the year 1993 (photo: NSIDC); (b) ruins of the Abramov research station in 2011 (photo: M. Hoelzle).
1994 to 1998 seasonal mass balance values are available from WGMS (2001). Several publications have assessed the long-term mass balance of the Abramov glacier. Compar-ing the results of these studies, differences on the order of ±0.3 m w.e. a−1 (from 1974–1994) are revealed (Suslov and Krenke, 1980; Glazirin et al., 1993; Kamnyansky, 2001; Pertziger, 1996; WGMS, 2001; Dyurgerov, 2002; Barandun et al., 2015). Therefore, the data series were homogenised (Barandun et al., 2015). The historic mass balance mea-surements on the Abramov glacier only show few posi-tive years with mass balances exceeding +0.3 m w.e. a−1, such as 1968–1969, 1971–1972, 1986–1987, 1991–1992 and 1992–1993. Rasmussen (2013) calculated the Abramov glacier’s mass balance sensitivity to air temperature change as −0.47 m w.e. a−1 ◦C−1using a positive degree-day model driven with NCEP–NCAR Reanalysis data, indicating the highest sensitivity of all studied glaciers in Central Asia.
The mass balance was reconstructed according to the method described in Sect. 3.3.6 and for the time period for which no direct measurements were available (Baran-dun et al., 2015). Such reconstructions of past mass bal-ance time series are important to (a) fill data gaps, (b)
com-Table 3. Glaciological mass balance for Abramov, Golubin, Batysh Sook and Glacier No. 354 after the re-establishment of the measure-ments, calculated for the hydrological year using a mass balance model.
Glacier Year Area ELA Ba
(km2) (m a.s.l.) (m w.e. a−1) Abramov 2011/2012 24.06 4265 −0.795 ± 0.30 Abramov 2012/2013 24.01 4225 −0.436 ± 0.34 Abramov 2013/2014 24.01 4245 −0.730 ± 0.10 Abramov 2014/2015 23.94 4115 +0.171 ± 0.30 Abramov 2015/2016 23.93 4185 −0.274 ± 0.30 Golubin 2010/2011 5.47 3775 +0.029 ± 0.2 Golubin 2011/2012 5.47 3875 −0.318 ± 0.2 Golubin 2012/2013 5.45 3835 −0.251 ± 0.2 Golubin 2013/2014 5.45 4325 −0.665 ± 0.2 Golubin 2014/2015 5.44 4315 −0.565 ± 0.2 Golubin 2015/2016 5.44 3745 +0.130 ± 0.2 Batysh Sook 2010/2011 1.13 4255 −0.375 ± 0.17 Batysh Sook 2011/2012 1.13 4265 −0.476 ± 0.15 Batysh Sook 2012/2013 1.12 4255 −0.368 ± 0.16 Batysh Sook 2013/2014 1.11 4265 −0.463 ± 0.16 Batysh Sook 2014/2015 1.11 4305 −0.822 ± 0.15 Batysh Sook 2015/2016 1.11 4265 −0.424 ± 0.14 Glacier No. 354 2010/2011 6.47 4195 −0.41 ± 0.24 Glacier No. 354 2011/2012 6.44 4205 −0.46 ± 0.26 Glacier No. 354 2012/2013 6.42 4225 −0.55 ± 0.25 Glacier No. 354 2013/2014 6.41 4275 −0.64 ± 0.22 Glacier No. 354 2014/2015 6.41 4365 −0.84 ± 0.24 Glacier No. 354 2015/2016 6.40 4155 −0.23 ± 0.24
pare past variabilities with current ones, (c) detect changes in glacier sensitivity, and (d) interpret present and future im-pacts of glacier change. An example of such a reconstruc-tion is shown in Fig. 4 for the Abramov glacier (Barandun et al., 2015), where mass balance data was homogenised for the period 1968–1998 and 2012–2015 and reconstructed for the period 1999–2011 using a calibrated distributed mass balance model. The results of the reconstruction were val-idated using snow lines digitised from the Landsat images. The mean mass balance for the time period 1998–2011 is −0.51±0.17 m w.e. a−1, and it is −0.44±0.10 m w.e. a−1for 1968–2014 (Barandun et al., 2015).
Maximal discharge of the Abramov glacier has been mea-sured in the month of August, with around 14 m3s−1 dur-ing the first observation years startdur-ing in 1967 until the be-ginning of the 1970s (Yemelyanov, 1973). Following Hagg et al. (2007) the discharge patterns will change according to different climate scenarios indicating an increase in annual runoff, and, furthermore, the seasonal peak runoff will shift towards May to June, and a decrease will likely occur in Au-gust. Compared to the very high sensitivity of glacial runoff to air temperature, precipitation changes appear to be of sec-ondary importance (Hagg et al., 2007).
A new and fully automated meteorological station was in-stalled in August 2011 at the Abramov glacier at an
alti-Pr ec -3.0 -2.0 -1.0 0.0 1.0 -30 -25 -20 -15 -10 -5 0 5 10 151968 1972 1976 1980 1984 1988 1992 1996 2000 2004 2008 2012 Ann ua l m ass ba lan ce (m w .e . a -1 ) Cu mm ul a� ve mas s ba la nc e (m w.e .)
Cumula�ve mass balance Reconstructed data Reanalysis data
Figure 4. Reconstructed mass balance data for the Abramov glacier according to Barandun et al. (2015).
Table 4. Observed geodetic mass balance for Abramov, Golubin, Batysh Sook and Glacier No. 354. Bglac.-rec.refers to a study by Barandun et al. (2015), where the mass balance was reconstructed based on a calibrated model (see Sect. 3.3.6).
Glacier Method Source Period Ba
(m w.e. a−1) Abramov Bglac.-rec. Barandun et al. (2015) 2000–2011 −0.51 ± 0.15 Abramov Bgeod. Gardelle et al. (2013) 2000–2011 −0.03 ± 0.14
Golubin Bgeod. Bolch (2015) 1964–1999 −0.46 ± 0.24
Golubin Bgeod. Bolch (2015) 1999–2012 −0.28 ± 0.97
Glacier No. 354 Bgeod. Pieczonka and Bolch (2015) 1975–1999 −0.79 ± 0.25 Glacier No. 354 Bgeod. Kronenberg et al. (2016) 2003–2012 −0.48 ± 0.07
tude of 4100 m a.s.l. within a distance of about 1 km from the glacier. The station records GPS position, air tempera-ture, relative humidity, atmospheric pressure, precipitation, wind speed and direction, and shortwave incoming and out-going radiation, as well as longwave incoming and outout-going radiation, soil water content and soil temperatures (Schöne et al., 2013). The historical and re-established mass balance networks are shown in Fig. 5. Field data were analysed by using a distributed mass balance model for extrapolating the point measurements to the entire glacier (Huss et al., 2009; Barandun et al., 2015), and the results are presented in Ta-ble 3. Since 2011, five field campaigns were conducted on the Abramov glacier, allowing the calculation of glacier-wide mass balance (see Fig. 6). Annual mass balance 2012–2016, i.e. after the re-establishing of the monitoring programme, was negative, with a mean of 0.41 m w.e. a−1(Table 3). The observed cumulative glacier frontal retreat since 1850 sums up to more than 2 km (see Table 5, Fig. 7).
4.2 Golubin glacier, Kyrgyzstan
The Golubin glacier is situated in the Ala-Archa catchment located in the Kyrgyz Ala-Too range in the northern Tien Shan in Kyrgyzstan (Fig. 1). The catchment belongs to the larger Chu River basin, which drains into the Kazakh steppe. The Ala-Archa catchment contains 48 glaciers. Bolch (2015) reports a total glaciated area in Ala-Archa of 40.5 ± 0.5 km2 in 1964 and 33.3±0.8 km2in 2010. The Golubin glacier cov-ers an area of 5.5 km2, based on a satellite image of 2002, has a volume of 0.348 km3 (Huss and Farinotti, 2012) and spans over an altitudinal range of 3300 to 4400 m a.s.l. The continental-type glacier has a northern aspect in the accumu-lation area and a northwestern aspect in the abaccumu-lation area.
The climate in the Ala-Archa region is characterised by limited annual precipitation of around 700 mm a−1 mainly during April to June (48 %) (Aizen et al., 2006). Mean annual air temperature in the ablation area of the glacier (3450 m a.s.l.) is about 1.5◦C, calculated with a lapse rate of 0.72◦C per 100 m from Baitik station (Aizen et al., 1995a).
Figure 5. Historical (c) and new (d) mass balance network on the Abramov glacier (Kyrgyzstan) with corresponding (overview) map (a) and snow line camera picture (b).
Glaciological investigations on the Golubin glacier started in 1958 and continued until 1994, when the monitoring pro-gramme was stopped (see Table 1). Between 1958 and 1973, the mass balance was predominantly positive and mainly negative afterwards (Aizen, 1988). Using imagery of several satellites Bolch (2015) determined the geodetic mass change for the periods 1964 to 1999 and 1999 to 2010. A mass bal-ance of −0.46 ± 0.24 m w.e. a−1for the first period and of −0.28 ± 0.97 m w.e.a−1for the second period was detected. For the entire Ala-Archa catchment, a glacier area change of −5.1 % from 1943 to 1977 and of −10.6 % between 1977 and 2003 was observed (Aizen et al., 2006, 2007). The mass balance sensitivity to temperature change was determined by Rasmussen (2013) as −0.17 m w.e. a◦C−1, which is substan-tially lower than for the Abramov glacier.
In summer 2010, mass balance and length change mea-surements were re-initiated. In Fig. 8 the former and the new measurement networks are presented. Complete
infor-mation is available for 6 years now. During this time, the length change measurements were performed by GPS and by analysis of satellite images. The recent observations of the glacier tongue could be connected to earlier measurements by Aizen et al. (2006, 2007) (Fig. 7). The glaciological mea-surements were analysed by using a distributed mass balance model (Huss et al., 2009) (Table 3, Fig. 6). The meteoro-logical station, installed in 2013, is situated at an altitude of 3300 m a.s.l. at a distance of 500 m away from the Golubin glacier (Schöne et al., 2013). Two further climate stations, Alplager and Baitik, are located in the Ala-Archa catch-ment at the altitudes of 2340 and 1580 m a.s.l., respectively. The re-initiated mass balance measurements since 2010 indi-cate mostly negative mass changes. In the hydrological years 2010/2011 (from 1 October 2010 until 30 September 2011) and 2015/2016, a positive mass balance was measured (Ta-ble 3). The observed cumulative glacier frontal retreat since 1861 sums up to around 1.3 km (see Table 5 and Fig. 7).
1950 1960 1970 1980 1990 2000 2010 2020 Year -25 -20 -15 -10 -5 0 5 C u m u la tiv e m a ss b a la n ce ( m w .e .)
Measured mass balance Reconstructed mass balance
Abramov Golubin Batysh Sook Karabatkak Tuyuksu Urumqi No. 1 Glacier No. 354
Figure 6. Cumulative mass balance measurements for glaciers in Central Asia. Filled dots are direct glaciological measurements, and non-filled dots are reconstructed values.
Year
Cumulative length change (m)
1880 1920 1960 2000 2040 1850 -2500 -2000 -1500 -1000 -500 0 500 Karabatkak Tuyuksu Urumqi No. 1 Abramov Golubin Barkrak Middle Batysh Sook Glacier No. 354
Figure 7. Cumulative front variation measurements for glaciers in Central Asia.
4.3 Batysh Sook glacier, Kyrgyzstan
The Batysh Sook glacier (also named Suyok (Suek) Zapad-niy or Glacier No. 419 in earlier studies; WGMS, 1993; Hagg et al., 2013; Kenzhebaev et al., 2017) is located in the Sook range in the central Tien Shan in Kyrgyzstan. The range is comprised of 44 glaciers with a total area of 30.9 km2and volume of 1.2 km3in 2007 (Hagg et al., 2013). The Batysh Sook glacier (Fig. 1) belongs to the Naryn catchment, which is a major tributary of the Syr Darya river. The small glacier covered an area of around 1.2 km2 in 2005 and covers an altitudinal range of 3950 to 4450 m a.s.l., with an estimated volume of around 0.033 km3±6.5 % in 2010 (Hagg et al., 2013). The glacier is assumed to be composed of a temperate accumulation zone and a cold ablation area.
According to the Tien Shan meteorological station situated at a distance of around 32 km, the mean annual temperature is −6.0◦C. July is the month with the highest temperatures (4.4◦C), and January has a mean temperature of −21.7◦C (1997 to 2014) (Kutuzov and Shahgedanova, 2009). Mean annual precipitation is 360 mm (1997 to 2014), of which up to 75 % was recorded during the summer months (May to September).
Batysh Sook was already monitored during short periods in 1970/1971, 1983/1984 and from 1988 to 1991 (see Ta-ble 2, WGMS, 1993). Hagg et al. (2013) calculated an area loss of around 19.8 % and a corresponding volume loss of 12.1 % for all glaciers within the Sook range for the time pe-riod 1956 to 2007.
Table 5. Length change 1L measurements for Abramov, Golubin, Batysh Sook and Glacier No. 354 based on GPS surveys, satellite images and maps.
Abramov Golubin Batysh Sook Glacier No. 354
Period 1L(m) Period 1L(m) Period 1L(m) Period 1L(m)
1850–1900 −572 1861–1883 −131 1975–1977 −25 1972–1977 −89 1900–1936 −232 1883–1905 −100 1977–1994 −47 1977–1998 −148 1936–1954 −169 1905–1927 −110 1994–1998 −24 1998–1999 −47 1954–1964 −125 1927–1949 −125 1998–1999 −22 1999–2001 −35 1964–1973 −70 1949–1955 −72 1999–2001 −27 2001–2002 −39 1973–1980 −92 1955–1962 −42 2001–2002 −18 2002–2006 −33 1980–1986 −52 1962–1967 −22 2002–2006 −27 2006–2007 −23 1986–1992 −193 1967–1972 −17 2006–2007 −15 2007–2009 −27 1992–2000 −201 1972–1975 −47 2007–2008 −14 2009–2010 −18 2000–2007 −102 1975–1976 −26 2008–2009 −18 2010–2011 −25 2007–2008 −27 1976–1977 −6 2009–2010 −23 2011–2013 −36 2008–2009 −39 1977–1978 −30 2010–2011 −20 2013–2014 −22 2009–2010 −69 1978–1989 −39 2011–2012 −15 2014–2015 −45 2010–2012 −22 1989–1992 −65 2012–2013 −6 2015–2016 −76 2012–2013 −32 1992–1993 −7 2013–2014 −9 2013–2014 −27 1993–1994 −8 2014–2015 −9 2014–2016 −38 1994–1995 −7 2015–2016 −3 1995–1996 −20 1996–1997 −16 1997–2000 −71 2000–2001 −34 2001–2002 −37 2002–2006 −79 2006–2008 −27 2008–2011 −22 2011–2012 −12 2012–2013 −38 2013–2014 −32 2014–2015 −25 2015–2016 −27
Since 2010, several stakes and some snow pits have been measured on an annual basis on the Batysh Sook glacier. In Fig. 9 the old and the new measurement networks are presented. The mass balance is analysed using a distributed mass balance model (Huss et al., 2009). The results indi-cate a continuous negative mass balance of about −0.4 to −0.8 m w.e. a−1since 2011/2012 (Table 3). The observed cu-mulative glacier frontal retreat since 1975 sums up to around 0.32 km (see Table 5 and Fig. 7).
A reconstruction of past mass balances for the period 2004 to 2010 was performed by Kenzhebaev et al. (2017) using a calibrated distributed temperature index mass bal-ance model. For the reconstructed period an average an-nual mass balance of −0.39 ± 0.26 m w.e. a−1 was found. For the direct measured period 2011 to 2016, three dif-ferent methods were applied. The first method, the profile method, revealed a mass loss of −0.41 ± 0.28 m w.e. a−1; the second method, the contour line, resulted in a negative mean mass balance of −0.34 ± 0.20 m w.e. a−1; and the third
method, based on model extrapolation, calculated a value of −0.43 ± 0.16 m w.e. a−1.
4.4 Glacier No. 354, Kyrgyzstan
Glacier No. 354 is situated in the southern part of the Ak-shiirak glacierised massif, inner Tien Shan in Kyrgyzstan (Fig. 1). According to Aizen et al. (2006), the range contains 178 glaciers (87 % of them are valley-type glaciers) covering an area of 371 km2. The Akshiirak glaciers on the eastern and southern part of the mountain range drain into the Saridjaz river, a tributary of the Tarim River via the Aksu River, and the runoff of the glaciers on the western part contributes to the flow of the Naryn River. The glacier had a surface area of 6.41 km2in 2014 (Kronenberg et al., 2016). The accumula-tion area is composed of three basins, and the glacier tongue is directed to the northwest. The glacier covers an altitudinal range of around 3750 to 4650 m a.s.l. Hagg et al. (2013) per-formed GPR measurements on the glacier tongue and used
Figure 8. Historical (c) and new (d) mass balance network on the Golubin glacier (Kyrgyzstan) with corresponding (overview) map (a) and snow line camera picture (b).
a simplified ice mechanical approach to determine the total volume of this glacier to be 0.272 ± 0.022 km3. Pieczonka and Bolch (2015) quantified the geodetic mass balance for Glacier No. 354 (Bordu-Yushny in their study) from 1975 to 1999 as −0.79 ± 0.25 m w.e. a−1.
The Akshiirak range is closely situated to the Sook range, and the closest meteorological station is again the Tien Shan station (14 km distance). The climate is similar to the one of the Batysh Sook glacier.
Glacier No. 354 was selected to replace the previously monitored the Sary-Tor glacier due to current access restric-tions because of mining activities. Sary-Tor has mass bal-ance observations based on the glaciological method for the
period of 1985 to 1989 (Dyurgerov et al., 1994), and its mass balance was reconstructed for the period 1930 to 1988 by Ushnurtsev (1991). Mass balance measurements were re-initiated in 2013 by a team of Russian and Kyrgyz scientists. The front variations of Sary-Tor indicate a retreat of 70 m from 1932 to 1943, no changes from 1943 to the mid-1970s, and a retreat of 220 m from 1977 to 1995 and of 90 m from 1995 to 2003 (Aizen et al., 2007).
Kronenberg et al. (2016) presented a reconstruction of the seasonal mass balance of Glacier No. 354 from 2003 to 2010. This reconstruction is based on an analysis of the annual measurements of stakes and snow pits of the years 2010 to 2014 (Fig. 10). The glaciological data were used to calibrate
Figure 9. Historical (c) and new (d) mass balance network on the Batysh Sook glacier (Kyrgyzstan) with corresponding (overview) map (a) and picture (b).
a distributed mass balance model, which was then used to reconstruct the seasonal mass balances since 2003. In ad-dition, winter accumulation measurements were performed in spring 2014 and also used for model calibration. Further-more, the geodetic volume change was determined based on two high-resolution satellite stereo images acquired in 2003 and 2012 and used to validate the modelled cumulative glacier-wide mass balance. For the period 2003 to 2012, an annual mass balance of −0.40 ± 0.10 m w.e. a−1 was mod-elled. This result corresponds well with the geodetic mass balance of −0.48 ± 0.07 m w.e. a−1for the same period (see
Tables 3 and 4, Kronenberg et al., 2016). The observed cu-mulative glacier frontal retreat since 1972 sums up to around 0.66 km (see Table 5 and Fig. 7).
4.5 Barkrak Middle, Uzbekistan
The Barkrak Middle glacier is located in the Oygaing valley in the Pskem catchment in the western Tien Shan, Uzbek-istan (Fig. 1). The Pskem River drains into Chirchik River, a tributary of the Syr Darya river. The area of the glaciers in the Pskem River basin including the Oygaing and the
up-Figure 10. Mass balance network (c) on Glacier No. 354 (Kyrgyzstan) with corresponding (overview) map (a) and snow line camera (b).
per Maydan valley (located in Kazakhstan) was 93.6 km2in the year 2007 (Semakova et al., 2016). The area of Barkrak Middle is 2.18 km2(Semakova et al., 2016) and the volume is 0.087 km3(Huss and Farinotti, 2012).
Between 1960 and 2010, the glacierised area decreased by 23 % in the Pskem River catchment, and, more specifically, a 16.8 % decrease in glacier area was observed from 1980 to 2001 in the basin of the Oygaing river, where the Barkrak Middle glacier is located (Semakova et al., 2016). For the Barkrak Middle glacier, observation data of length change exist from 1971 to 1990, with a total cumulative retreat of 249 m (see Fig. 7).
In 2016, a new mass balance network with a total of 11 stakes was established (Fig. 11). In addition, a meteorologi-cal station in the glacier forefield and an automatic snow line camera were installed (Fig. 11).
5 Summary of glacier length and mass changes in Central Asia
The measurements performed on various glaciers in Central Asia show an overall mass loss over the last five decades. There are some individual years with positive mass balances within all decades (Figs. 6, 12, Table 4). However, the posi-tive mass balances are mostly observed during the beginning of the measurements starting in 1967 until the beginning of the 1970s. Long-term trends based on the glaciological, as well as on the geodetic, method indicate a mean negative mass balance in the range of −0.3 to −0.8 m w.e. a−1. Most negative mass balances were observed at Abramov, Kara-batkak, Tuyuksu and Urumqi (WGMS, 2013), whereas Gol-ubin and Batysh Sook exhibited smaller mass loss. This ob-servation is in line with the mass balance sensitivities of the glaciers in Central Asia as inferred by Rasmussen (2013). The observed cumulative mass balance determined by the glaciological method is supported by several remote sensing
Figure 11. Mass balance network (c) on Barkrak Middle (Uzbekistan) with corresponding (overview) map (a) and picture (b). Ma s s b a la n c e ( m w .e .) Years 2020 2010 2000 1990 1980 1970 1960 1950 -2.0 -1.5 -1.0 -0.5 0.0 0.5 1.0 Glaciological method Geodetic method Glacier No. 354 Abramov Tuyuksu Urumqi No. 1 Golubin
Figure 12. Comparison of glaciological and geodetic mass balance for glaciers in Central Asia. The geodetic mass balances are from Hagg et al. (2004) (Tuyuksu), Wang et al. (2014) (Urumqi Glacier No. 1), Pieczonka and Bolch (2015) and Kronenberg et al. (2016) (Glacier No. 354), and Gardelle et al. (2013) (Abramov). The glaciological data are provided by WGMS (2013).
studies underlining the findings (Aizen et al., 1995b; Bolch et al., 2011, 2012; Pieczonka et al., 2013; Gardelle et al., 2013; Pieczonka and Bolch, 2015; Bolch, 2015; Kronenberg et al., 2016).
The network of glaciological and geodetic measurements in the Tien Shan mountains has been strongly improved by
the re-establishment of the monitoring programmes start-ing in 2010. In the Pamir Mountains, however, glacier mass balance measurements are still sparse as only the Abramov glacier in the most northwestern part is monitored. This glacier is not representative of the entire Pamir, which also contains glaciers at much higher altitudes that respond
differ-ently to atmospheric warming (e.g. Kääb et al., 2015, 2012; Gardner et al., 2013; Gardelle et al., 2013).
Length changes are an important element of glacier mon-itoring. Direct measurements extend back into the 19th cen-tury in several mountain ranges, and some reconstructions based on geomorphological dating extend back to the 16th century (Zemp et al., 2015). In general, the cumulative front variation measurements for the investigated glaciers in Cen-tral Asia reveal a long-term glacier retreat (see Table 3, Fig. 7). Here we used a simple parameterisation scheme de-veloped by Haeberli and Hoelzle (1995) and used by Hoel-zle et al. (2003) to convert curves of cumulative glacier ad-vance and retreat into time series of temporally averaged mass balance by applying a continuity model developed by Nye (1960) to infer mean mass balance changes over longer time periods. This approach considers step changes after a full dynamic response and new equilibrium of the glacier based on the assumption that a mass balance change leads to a corresponding glacier length change depend-ing only on the original length of the glacier and its an-nual mass balance (ablation) at the glacier terminus. Cal-culating these values for Abramov (for the period 1850– 2016) results in –0.35 m w.e. a−1, for Golubin (1861–2016) around −0.2 m w.e. a−1, and for Batysh Sook (1975–2016) and Glacier No. 354 (1972–2016) around −0.35 m w.e. a−1.
6 Discussion
We demonstrate that a valuable glaciological dataset is available for the Central Asian mountains, particularly for the Tien Shan, despite different historical backgrounds and changing methodological aspects. New monitoring networks in combination with historical measurements will generate highly valuable baseline data for future research, climate change observations, assessment of climate change impacts and related adaptation measures, including water resource management. Continuous long-term support and coopera-tion among several countries and institucoopera-tions is required to keep the successfully re-established measurements alive. The newly developed strategy and its implementation to connect in situ measurements with remote sensing and numerical modelling techniques (see Fig. 2) will allow the establish-ment of an efficient glacier monitoring programme. This will guarantee an optimum between available human capacity and efforts, sustainable financial coverage and data quality, of-fering a feasible way to perform long-term monitoring. Our approach, implemented in Kyrgyzstan and Uzbekistan, has to be proven during the next years and should be further de-veloped. Over the last years, it delivered promising results, although there are still many improvements possible. One of the most urgent needs is capacity building, i.e. the education of young local scientists being able to continue the monitor-ing programme independently (Nussbaumer et al., 2017).
Our approach also reveals that, on a scientific basis, an in-depth re-evaluation of long-term geodetic mass changes on all selected glaciers is absolutely necessary. Most geode-tic measurements (e.g. for Glacier No. 354, Urumqi Glacier No. 1 and Tuyuksu) match well with the glaciological mass balances (Fig. 12). All these measurements show almost per-sistently negative mass balances since the mid-20th century. At the Abramov glacier, however, considerable differences between geodetic and reconstructed glaciological measure-ments were found (Fig. 12 and Table 4). For the period 2000 to 2011, Barandun et al. (2015) determined a negative value of −0.51 ± 0.17 m w.e. a−1, whereas Gardelle et al. (2013) reported a mass balance of −0.03 ± 0.14 m w.e. a−1for the same period. The geodetic measurements are subject to con-siderable uncertainties that are, for example, related to the underestimated penetration of the radar signals into snow and firn in the accumulation areas during the acquisition of the SRTM mission in the year 2000 (Paul et al., 2013). This has been confirmed by other studies using ICESat measure-ments in the same region (Kääb et al., 2015, 2012; Gardner et al., 2013) and by ground-penetrating radar measurement in the accumulation area of the Abramov glacier (Barandun et al., 2015). This shows the need for further analysis of ex-isting aerial and satellite data in order to create additional high-accuracy elevation models. Another problem encoun-tered during the homogenisation process of the mass balance time series was a considerable inconsistency, which is mainly related to different interpretations of the former stake net-works or to missing measurements.
Glacier frontal variations complement the mass balance measurements. They show a continuous retreating trend for the last decades and century. The inferred estimates of mass change calculated based on the length change measurements are in quite good accordance with the mass balance measure-ments.
7 Conclusions
This paper demonstrates the richness of the historical dataset from the long-term glacier measurements available in Cen-tral Asia and particularly in Kyrgyzstan, and it introduces the (re-)established glacier measurement network highlight-ing the importance of capacity buildhighlight-ing to make the efforts sustainable. In connection with the new glacier monitoring strategy and its current implementation, the long-term in situ data are fundamental to understanding the relevant processes and the impact of climate change on glaciers in the Tien Shan and the Pamir-Alay and the impacts for the people liv-ing nearby as well as in far distances downstream. Therefore, the cryospheric ECV “glacier” is an important variable, for which sustainable long-term monitoring has to be ensured not only in industrial countries but also in developing coun-tries. Without the long-term measurements, questions such as the future behaviour of glaciers, their possible disappearance
and the impacts for society cannot be answered comprehen-sively. Only well-validated and well-calibrated models based on sound process understanding and high-quality data will ensure projections with an acceptable level of uncertainty. These models and their outputs are the only tools for esti-mating future runoff evolution in one of the driest continen-tal regions of the Northern Hemisphere, where future water shortage due to decreased glacierisation has the potential to lead to pronounced political instability and drastic ecologi-cal changes, and it might even endanger future food security in a highly populated region. This highlights the importance of in situ monitoring networks of all ECVs within national and international climate services and their use together with remote sensing and numerical models.
Data availability. The dataset presented here is part of WGMS (2017).
Competing interests. The authors declare that they have no conflict of interest.
Acknowledgements. We thank Florian Denzinger, Murataly Duis-honakunov, Mauro Fischer, Alyssa Ghirlanda, Saskia Gin-draux, Andreas Kääb, David Kriegel, Mario Kummert, Nico Mölg, Kathrin Naegeli, Anton Neureiter, Dmitry Petrakov, Stephan Reisenhofer, Helene Rieck, Julia Schmale, Alina Sharshe-baev, Leo Sold, Philipp Schuppli, Alexander Zubovich, Almaz An-dashev, Tiynstiyk Aktanov and Mukhammed Esenamanov for their valuable support in the field. Tobias Bolch is acknowledged for sharing data. The project was only possible thanks to the support of the Federal Office of Meteorology and Climatology MeteoSwiss through the project CATCOS (Capacity Building and Twinning for Climate Observing Systems), contract no. 7F-08114.1 between the Swiss Agency for Development and Cooperation and MeteoSwiss and the project CICADA (Cryospheric Climate Services for improved Adaptation), and contract no. 81049674 between Swiss Agency for Development and Cooperation and the University of Fribourg. The CAWa (Central Asian Water) project (http://www.cawa-project.net) was supported by the German Federal Foreign Office (contract no. AA7090002) as a part of the “Berlin Process”. This study was also supported by the Swiss National Science Foundation (SNSF) by the following two projects: “Snowline observations to remotely derive seasonal to sub-seasonal glacier mass balance in the Tien Shan and Pamir Mountains”, grant 155903, and “Changing glacier firn in Central Asia and its impact on glacier mass balance”, grant 169453. Further support came from the European Research Council (FP/2007-2013, ERC grant agreement no. 320816). We are also grateful to all collaborators of the Central Asian Institute for Applied Geosciences for their continued support of this long-term project.
Edited by: Luis Vazquez
Reviewed by: two anonymous referees
References
Ahlmann, H.: Le niveau de glaciation comme fonction de l’accumulation d’humidité sous form solide, Geogr. Ann. A, 6, 223–272, 1924.
Aizen, V.: Reconstrktiya balansa massy lednika Golubina, Materi-aly Glyatsiologicheskikh Issledovaniy, 62, 119–126, 1988. Aizen, V., Aizen, E., and Melack, J.: Present and future impact of
snow cover and glaciers on runoff from mountain regions – com-parison between Alps and Tien Shan, in: Biochemistry of Seson-ally Snow-Covered Catchments, vol. 228, 413–430, IAHS, Boul-der, Colorado, USA, 1995a.
Aizen, V., Aizen, E., and Melack, J.: Climate, snow cover, glaciers, and runoff in the Tien Shan, Central Asia, Water Resour., 31, 1113–1129, 1995b.
Aizen, V., Surazakov, A., Kuzmichenok, V., and Aizen, E.: Glacier changes in central and northern Tien Shan during the last 140 years based on surface and remote sensing data, Ann. Glaciol., 43, 202–213, 2006.
Aizen, V., Aizen, E., and Kuzmichenok, V.: Geo-informational sim-ulation of possible changes in Central Asian water resources, Global Planet. Change, 56, 341–358, 2007.
Arendt, A., Bliss, A., Bolch, T., Cogley, J., Gardner, A., Ha-gen, J., Hock, R., Huss, M., Kaser, G., Kienholz, C., Pfef-fer, W., Moholdt, G., Paul, F., Radic, V., Andreassen, L., Ba-jracharya, S., Barrand, N., Beedle, M., Berthier, E., Bhambri, R., Brown, I., Burgess, E., Burgess, D., Cawkwell, F., Chinn, T., Copland, L., Davies, B., De Angelis, H., Dolgova, E., Earl, L., Filbert, K., Forester, R., Fountain, A., Frey, H., Giffen, B., Glasser, N., Guo, W., Gurney, S., Hagg, W., Hall, D., Hari-tashya, U., Hartmann, G., Helm, C., Herreid, S., Howat, I., Ka-pustin, G., Khromova, T., König, M., Kohler, J., Kriegel, D., Kutuzov, S., Lavrentiev, I., Le Bris, R., Liu, S., Lund, J., Man-ley, W., Mayer, C., Miles, E., Li, X., Menounos, B., Mercer, A., Mölg, N., Mool, P., Nosenko, G., Negrete, C., Nuth, C., Petter-son, R., Racoviteanu, A., Ranzi, R., Rastner, P., Rau, F., Raup, B., Rich, J., Rott, H., Schneider, C., Seliverstov, Y., Sharp, M., Sig-urdsson, O., Stokes, C., Wheate, R., and Winsvold, S. W.: Ran-dolph Glacier Inventory: A Dataset of Global Glacier Outlines: Version 5.0, Digital media, Global Land Ice Measurements from Space, Boulder, Colorado, USA, 2015.
Barandun, M., Huss, M., Sold, L., Farinotti, D., Azisov, E., Salz-mann, N., Usulbaliev, R., Merkushkin, A., and Hoelzle, M.: Re-analysis of seasonal mass balance at Abramov glacier 1968– 2014, J. Glaciol., 61, 1103–1117, 2015.
Bauder, A., Funk, M., and Huss, M.: Ice-volume changes of selected glaciers in the Swiss Alps since the end of the 19th century, Ann. Glaciol., 46, 145–149, 2007.
Benn, D. I. and Lehmkuhl, F.: Mass balance and equilibrium-line al-titudes of glaciers in high-mountain environments, Quatern. Int., 65–6, 15–29, 2000.
Berthier, E., Arnaud, Y., Vincent, C., and Rémy, F.: Biases of SRTM in high-mountain areas: Implications for the monitoring of glacier volume changes, Geophys. Res. Lett., 33, L08502, https://doi.org/10.1029/2006GL025862, 2006.
Berthier, E., Schiefer, E., Clarke, G., Menounos, B., and Rémy, F.: Contribution of Alaskan glaciers to sea-level rise derived from satellite imagery, Nat. Geosci., 3, 92–95, 2010.
Bolch, T.: Glacier area and mass changes since 1964 in the Ala Archa Valley, Kyrgyz Ala-Too, northern Tien Shan, Ice Snow, 129, 28–39, 2015.
Bolch, T. and Buchroithner, M.: Suitability of medium scale to-pographic maps and the SRTM DEM to estimate glacier vol-ume changes in the Northern Tien Shan, Tech. rep., Institute of Geography, Russian Academy of Sciences, Moscow, Russia, https://doi.org/10.15356/IS.2015.01.03, 2008.
Bolch, T., Pieczonka, T., and Benn, D. I.: Multi-decadal mass loss of glaciers in the Everest area (Nepal Himalaya) de-rived from stereo imagery, The Cryosphere, 5, 349–358, https://doi.org/10.5194/tc-5-349-2011, 2011.
Bolch, T., Kulkarni, A., Kääb, A., Huggel, C., Paul, F., Cogley, J., Frey, H., Kargel, J., Fujita, K., Scheel, M., Bajracharya, S., and Stoffel, M.: The state and fate of Himalyan glaciers, Science, 336, 310–314, 2012.
Braithwaite, R.: Can the mass balance of a glacier be estimated from its equilibrium line altitude?, J. Glaciol., 30, 364–368, 1984. Braithwaite, R. and Müller, F.: On the Parameterization of Glacier
Equilibrium Line Altitude, vol. 126 of IAHS-AISH, Interna-tional Association of Hydrological Sciences, Proceedings of the Riederalp Workshop, September 1978, Riederalp, Valais, Switzerland, 1980.
Chen, Y., Li, W., Deng, H., Fang, G., and Li, Z.: Changes in Central Asia’s water tower: past, present and future, Sci. Rep.-UK, 6, 35458, https://doi.org/10.1038/srep35458, 2016.
Chinn, T., Salinger, J., Fitzharris, B., and Willsman, A.: Annual ice volume changes 1976–2008 for the New Zealand Southern Alps, Global Planet. Change, 92–93, 105–118, 2012.
Cogley, J., Hock, R., Rasmussen, A., Bauder, A., Braithwaite, R., Jansson, P., Kaser, G., Möller, M., Nicholson, L., and Zemp, M.: Glossary of Glacier Mass Balance and Related Terms, vol. 86 of IHP-VII Technical Documents in Hydrology, IACS Contribution No. 2, Paris, France, 2011.
Duethmann, D., Bolch, T., Farinotti, D., Kriegel, D., Voro-gushyn, S., Merz, B., Pieczonka, T., Jiang, T., Su, B., and Günt-ner, A.: ttribution of streamflow trends in snow and glacier melt-dominated catchments of the Tarim River, Central Asia, Water Resour. Res., 351, 4727–4750, 2015.
Dyurgerov, M.: Glacier mass balance and regime: data of measure-ments and analysis, Occasional Paper, No. 55, Institute of Arc-tic and Alpine Research, University of Colorado, Boulder, Col-orado, USA, 88 pp., 2002.
Dyurgerov, M., Mikhalenko, V., Kunakhovitch, M., Ushnurtsev, S., Liu, C., and Xie, Z.: On the cause of glacier mass balance vari-ations in the Tien Shan mountains, GeoJournal, 33, 311–317, 1994.
Farinotti, D., Longuevergne, L., Moholt, G., Duethmann, D., Mölg, T., Bolch, T., Vorogushyn, S., and Güntner, A.: Substan-tial glacier mass loss in the Tien Shan over the past 50 years, Nat. Geosci., 8, 716–722, https://doi.org/10.1038/NGEO2513, 2015. Gardelle, J., Berthier, E., and Arnaud, Y.: Slight mass gain
of Karakoram glaciers in the early twenty-first century, Nat. Geosci., 5, 322–325, https://doi.org/10.1038/NGEO1450, 2012. Gardelle, J., Berthier, E., Arnaud, Y., and Kääb, A.:
Region-wide glacier mass balances over the Pamir-Karakoram-Himalaya during 1999–2011, The Cryosphere, 7, 1263–1286, https://doi.org/10.5194/tc-7-1263-2013, 2013.
Gardner, A. S. and Moholdt, G., Cogley, J., Wouters, B., Arendt, A., Wahr, J., Berthier, E., Hock, R., Pfeffer, W., Kaser, G., Ligten-berg, S., Bolch, T., Sharp, M., Hagen, J., van den Broeke, M., and Paul, F.: A reconciled estimate of glacier contributions to sea level rise: 2003 to 2009, Science, 340, 852–857, 2013.
Glazirin, G., Kamnyansky, G., and Pertziger, F.: Regime of Abramov Glacier, Gidrometeoizat, Hydrometeo Publishing, Leningrad, Russia, 1993.
Glazirin, G., Braun, L., and Shchetinnikov, A.: Sensitivity of mountain glacierization to climatic changes in Centra Asia, Z. Gletscherkunde Glazialgeologie, 38, 71–76, 2002.
Haeberli, W. and Hoelzle, M.: Application of inventory data for esti-mating characteristics of and regional climate-change effects on mountain glaciers: a pilot study with the European Alps, Ann. Glaciol., 21, 206–212, 1995.
Haeberli, W., Hoelzle, M., Paul, F., and Zemp, M.: Integrated mon-itoring of mountain glacier as key indicators of global climate change: the European Alps, Ann. Glaciol., 46, 150–160, 2007. Hagg, W., Braun, L., Uvarov, V., and Makarevich, K.: A comparison
of three methods of mass-balance determination in the Tuyuksu glacier region, Tien Shan, Central Asia, J. Glaciol., 50, 505–510, 2004.
Hagg, W., Braun, L., Weber, M., and Brecht, M.: Runoff modelling in glacierized Central Asia catchments for present-day and future climate, Nord. Hydrol., 37, 1–13, 2006.
Hagg, W., Braun, L., Kuhn, M., and Nesgaard, T.: Modelling of hydrological response to climate change in glacierized Central Asian catchments, J. Hydrol., 332, 40–53, 2007.
Hagg, W., Mayer, C., Lambrecht, A., Kriegel, D., and Azizov, E.: Glacier changes in the Big Naryn basin, Central Tian Shan, Global Planet. Change, 110, 40–50, 2013.
Haritashya, U., Bishop, M., Shroder, J., Bush, A., and Bulley, H.: Space-based assessment of glacier fluctuations in the Wakhan Pamir, Afghanistan, Climatic Change, 94, 5–18, 2009.
Hoelzle, M., Haeberli, W., Dischl, M., and Peschke, W.: Secular glacier mass balances derived from cumulative glacier length changes, Global Planet. Change, 36, 295–306, 2003.
Hulth, J., Rolstad Denby, C. and Hock, R.: Estimating glacier snow accumulation from backward calculation of melt and snowline tracking, Ann. Glaciol., 54, 1–7, 2013.
Huss, M.: Density assumptions for converting geodetic glacier volume change to mass change, The Cryosphere, 7, 877–887, https://doi.org/10.5194/tc-7-877-2013, 2013.
Huss, M. and Farinotti, D.: Distributed ice thickness and volume of all glaciers around the globe, J. Geophys. Res.-Earth, 117, F04010, https://doi.org/10.1029/2012JF002523, 2012.
Huss, M., Bauder, A., Funk, M., and Hock, R.: Deter-mination of the seasonal mass balance of four Alpine glaciers since 1865, J. Geophys. Res.-Earth, 113, F01015, https://doi.org/10.1029/2007JF000803, 2008.
Huss, M., Bauder, A., and Funk, M.: Homogenization of long-term mass-balance time series, Ann. Glaciol., 50, 198–206, 2009. Huss, M., Sold, L., Hoelzle, M., Stokvis, M., Salzmann, N.,
Farinotti, D., and Zemp, M.: Toward remote monitoring of sub-seasonal glacier mass balance, Ann. Glaciol., 63, 85–93, 2013. Immerzeel, W., van Beek, L., and Bierkens, M.: Climate change
will affect the Asian water towers, Science, 328, 1382–1385, https://doi.org/10.1126/science.1183188, 2010.