1
Supplementary Information
Synthesis, characterization and modeling zinc
phthalocyanine−cellulose nanocrystal conjugates: Towards
highly functional CNCs
Kazi M. Alam
1*, Pawan Kumar
1, Sergey Gusarov
,2Alexander E. Kobryn
,2Aarat P.
Kalra
1, 3, Sheng Zeng
1, Ankur Goswami
1, 4, Thomas Thundat
5, 6, and Karthik Shankar
1*1Department of Electrical & Computer Engineering, University of Alberta, 9211-116 St., Edmonton, AB T6G 1H9,
Canada
2Nanotechnology Research Centre, National Research Council Canada, 11421 Saskatchewan Drive, Edmonton, AB
T6G 2M9, Canada
3
Department of Physics, Faculty of Science, University of Alberta, Edmonton, T6G 1H9, Canada
4
Department of Materials Science and Engineering, Indian Institute of Technology Delhi, New Delhi 11016, India
5
Department of Chemical and Materials Engineering, University of Alberta, Edmonton, T6G 1H9, Canada
6
Department of Chemical and Biological Engineering, University at Buffalo, The State University of New York, Buffalo, New York 14260, USA
*
2
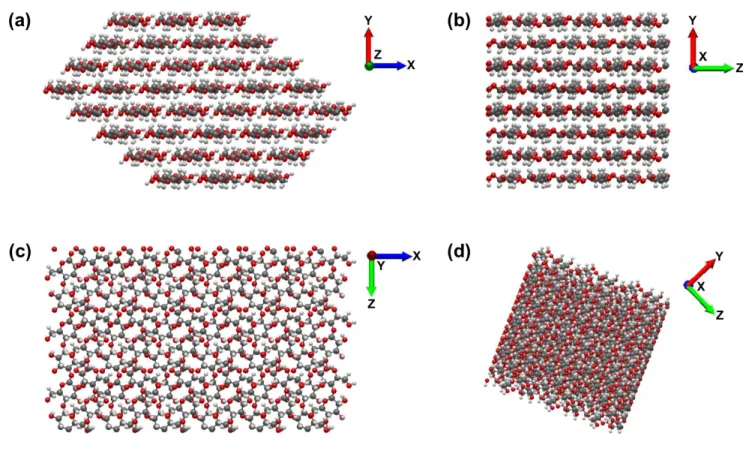
Fig. S1. Cellulose nanocrystal (type I,
β phase) structure generated for molecular dynamics simulation. (a)
cross-sectional view, (b) side view, (c) top view and (d) oblique view of one nanocrystal. CNC axis is
along z direction.
3
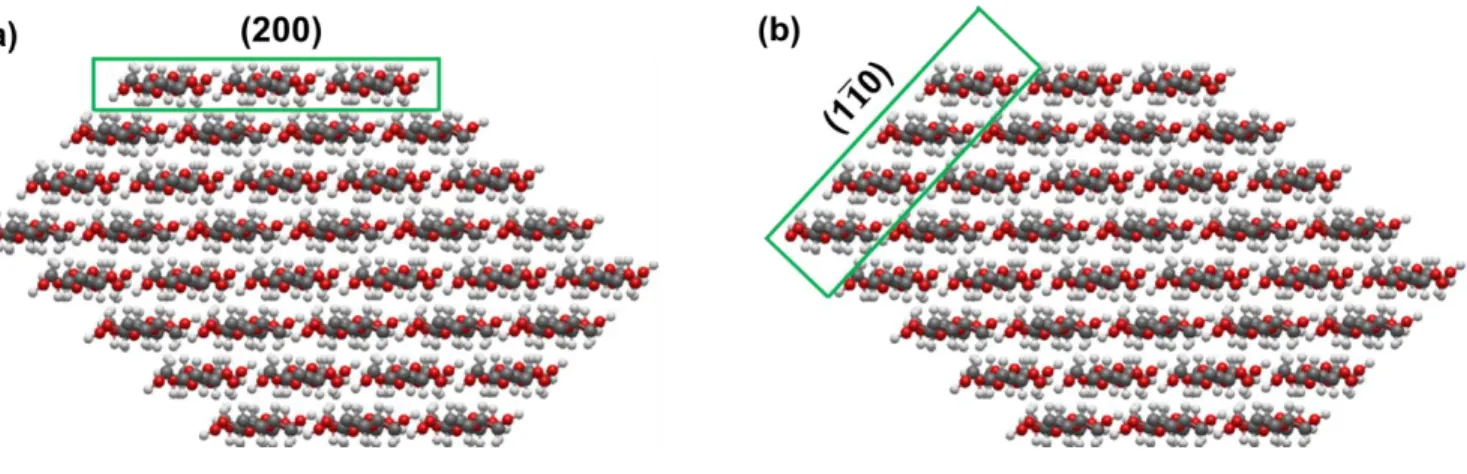
Fig. S2.
Cross-sectional view
of one CNC
. (a) Hydrophobic plane (200) and (b) Hydrophilic plane (1 1 0 ) have4
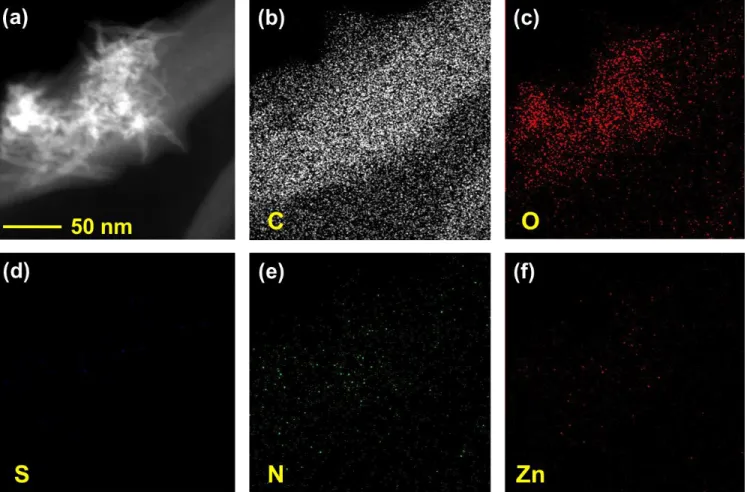
Fig. S3. (a) Dark field STEM image of ZnPc@AI-CNC bundle. STEM elemental mapping for (b) C, (c) O, (d) S, (e) N and (f) Zn.
5
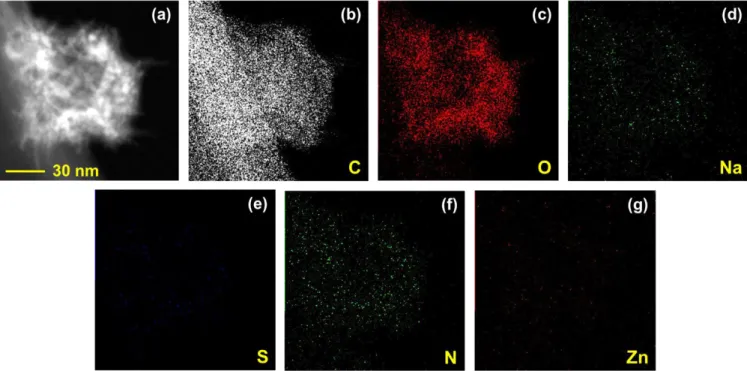
Fig. S4. (a) Dark field STEM image of ZnPc@Na-CNC bundle. STEM elemental mapping for (b) C, (c) O, (d) Na, (e) S, (f) N and (g) Zn.
6
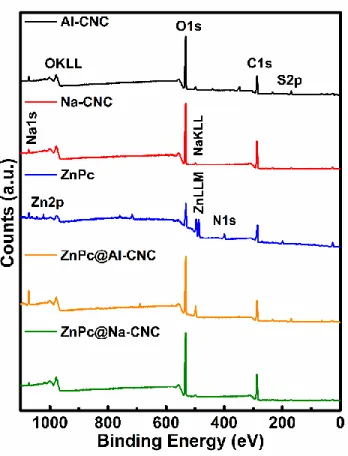
Fig. S5. XPS elemental survey scan of AI-CNC (black), Na-CNC (red) and ZnPc (blue), ZnPc@AI-CNC (orange) and ZnPc@Na-CNC (green).
7
8
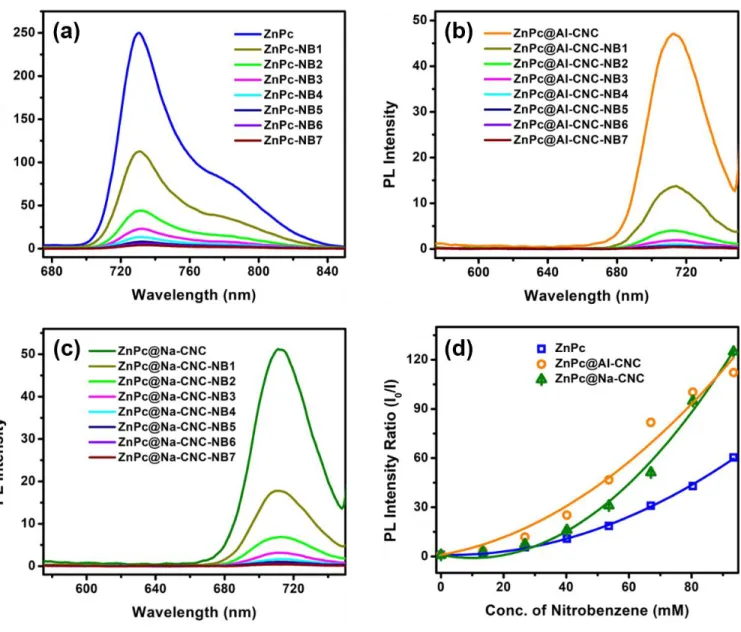
Fig. S7. Photoluminescence spectral changes of (a) ZnPc, (b) ZnPc@AI-CNC and (c) ZnPc@Na-CNC on addition of different concentrations of nitrobenzene in DMF. (d) PL intensity ratio of pristine fluorophores (ZnPc, ZnPc@AI-CNC and ZnPc@Na-CNC) and fluorophores with quencher (nitrobenzene) vs. concentration of quencher. All these plots showing positive deviation from Stern-Volmer kinetics in presence of high concentration of nitrobenzene.
9
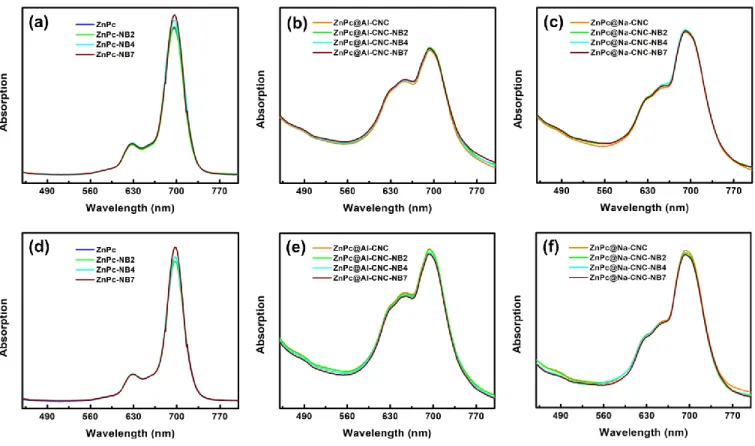
Fig. S8. UV-Vis absorption spectra with nitrobenzene (low concentration) in DMF of (a) ZnPc, (b) ZnPc@AI-CNC and (c) ZnPc@Na-CNC; with nitrobenzene (high concentration) in DMF of (d) ZnPc, (e) ZnPc@AI-CNC and (f) ZnPc@Na-CNC.
10
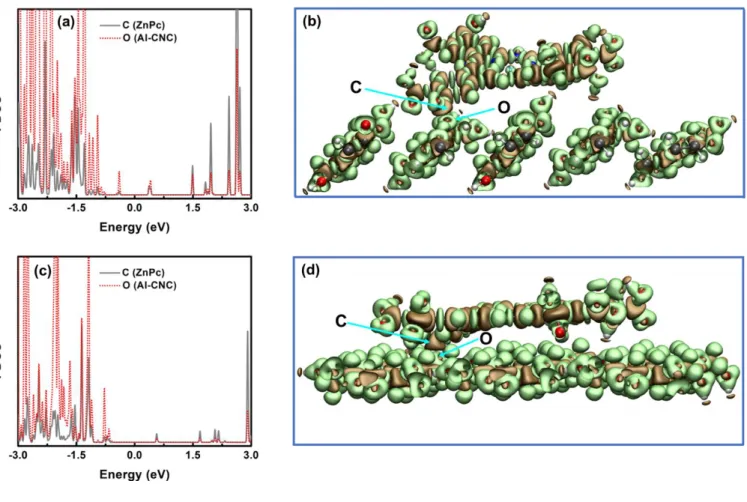
Fig. S9. Projected density of states (PDOS) of participating atoms in covalent bond formation between ZnPc and AI-CNC, where metallophthalocyanine rings are likely to orient horizontally to the CNC surface; C (ZnPc) and O (AI-CNC) on the (a) hydrophilic plane (1 10) , (c) hydrophobic plane (200) of AI-CNC. Electron density difference isosurfaces for ZnPc@AI-CNC on (b) (1 10) plane and (d) (200) plane. The ochre and lime colored surfaces represent charge depletion and accumulation regions respectively. The isosurface value was set to 0.015 eV Å-3. The colors for C, O, H, S, N and Zn atoms are gray, red, white, yellow, blue and cyan respectively.
11
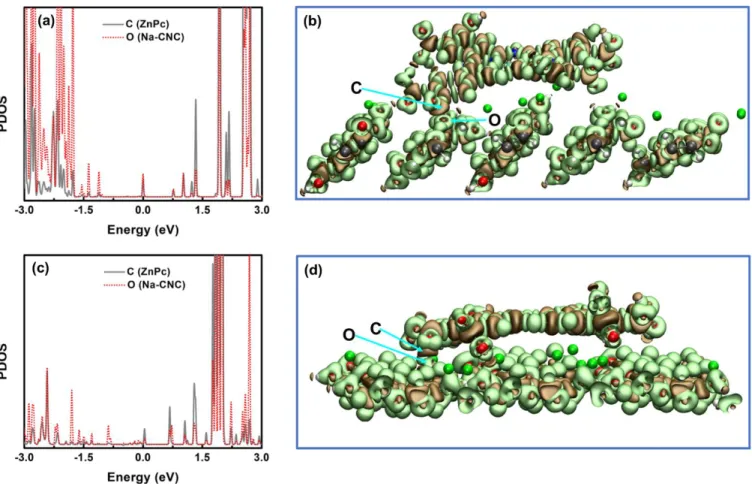
Fig. S10. Projected density of states (PDOS) of participating atoms in covalent bond formation between ZnPc and Na-CNC, where metallophthalocyanine rings are likely to orient horizontally to the CNC surface; C (ZnPc) and O (Na-CNC) on the (a) hydrophilic plane (1 10) , (c) hydrophobic plane (200) of Na-CNC. Electron density difference isosurfaces for ZnPc@Na-CNC on (b) (1 10) plane and (d) (200) plane. The ochre and lime colored surfaces represent charge depletion and accumulation regions respectively. The isosurface value was set to 0.015 eV Å-3. The colors for C, O, H, S, Na, N and Zn atoms are gray, red, white, yellow, green, blue and cyan respectively.
12
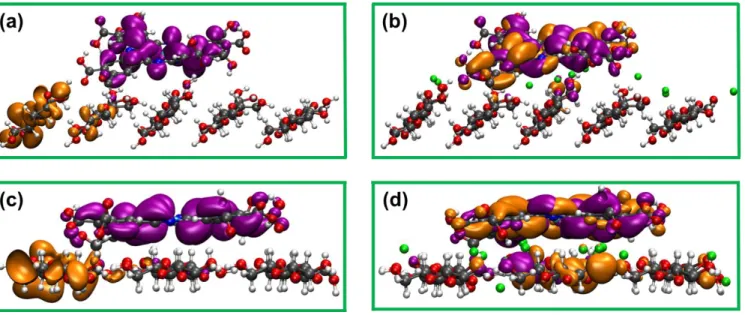
Fig. S11. DFT calculated spatial distributions of molecular orbitals, where metallophthalocyanine rings are likely to orient horizontally to the CNC surface, for (a) hydrophilic plane (1 10) and (c) hydrophobic plane (200) of ZnPc@AI-CNC; (b) hydrophilic plane (1 10) and (d) hydrophobic plane (200) of ZnPc@Na-CNC. HOMO and LUMO are represented by orange and purple lobes respectively. The colors for C, O, H, S, Na, N and Zn atoms are gray, red, white, yellow, green, blue and cyan respectively.
13
Fig. S12. DFT calculated spatial distributions of molecular orbitals for (a) bare ZnPc and (b) ZnPc molecule attached to a corner of a hydrophilic and hydrophobic planes of AI-CNC surface. HOMO and LUMO are represented by orange and purple lobes respectively. The colors for C, O, H, S, Na, N and Zn atoms are gray, red, white, yellow, green, blue and cyan respectively.