HU/0
.M414
no.^3
WORKING
PAPER
ALFRED
P.SLOAN
SCHOOL
OF
MANAGEMENT
Data
Quality
Requirements
Analysis
and
Modeling
December
1992WP
#3515-93CISL
WP#
92-04 Richard Y.Wang
M.
P.Reddy
H.B.Kon
SloanSchoolof
Management,
MIT
MASSACHUSETTS
INSTITUTE
OF
TECHNOLOGY
50
MEMORIAL
DRIVE
To
appear
inthe
Journal of
Decision
Support Systems
(DSS)
Special Issue
on
Information Technologies
and Systems
Data
Quality
Requirements
Analysis
and Modeling
Deceml)er1992WP
#3515-93CISL
WP#
92-^
RichardY.Wang
M.
P.Reddy
H. B.Kon
SloanSchool of
Management,
MIT
*seepage bottomforcompleteaddress
Richard Y.
Wang
E53-317M.
P.Reddy
E53-322Henry
B.Kon
E53-322Sloan School of
Management
MassachusettsInstituteofTechnology
smpv'; •
To
appsearin the Journal of DecisionSupportSystems (DSS)Special Issue
on
InformationTechnologiesand
SystemsToward
Quality
Data:
An
Attribute-Based
Approach
Richard
Y.Wang
M.
P.Reddy
Henry
B.Kon
November
1992
(CIS-92-04,
revised)
Composite
Information
Systems Laboratory
E53-320, Sloan School
of
Management
Massachusetts
Instituteof
Technology
Cambridge,
Mass. 02139
ATTN:
Prof.Richard
Wang
(617)
253-0442
Bitnet Address: [email protected]
©
1992RichardY.Wang,
M.P.Reddy,
and
Henry
B.Kon
ACKNOWLEDGEMENTS
Work
reported herein has
been
supported,
in part,by
MIT's
International
Financial
Service
Research
Center
and
MIT's
Center
forInformation
Systems
Research.
The
authors
wish
tothank
Stuart
Madnick
and
Amar
Gupta
for theircomments
on
earlierversions
of
thispaper.
Thanks
are also
due
toAmar
Gupta
for hissupport
and
Gretchen
Fisher
forhelping
prepare
thismanuscript.
1.
Introduction
11.1.
Dimensions
of
data
quality
2
1.2.
Data
quality:an
attribute-based
example
4
1.3.
Research
focus
and
paper
organization
4
2.
Research
background
5
2.1.
Rationale
for cell-leveltagging
5
2.2.
Work
related
todata tagging
6
2.3.
Terminology
7
3.
Data
quality
requirements
analysis
8
3.1.
Step
1:Establishing the applications
view
9
3.2.
Step
2:Determine
(subjective)quality
parameters
9
3.3.Step
3:Determine
(objective)quality
indicators
10
3.4.
Step
4:Creating
the quality
schema
114.
The
attribute-based
model
of
data quality
12
4.1.
Data
structure
12
4.2.
Data
integrity15
4.3.
Data manipulation
15
4.3.1.
Ql-CompatibiUty
and
QIV-Equal
15
4.3.2.
Quality
Indicator
Algebra
18
4.3.2.1.
Selection
18
4.3.2.2.
Projection
19
4.3.2.3.
Union
20
4.3.2.4.
Difference
22
4.3.2.5.
Cartesian
Product
24
5.
Discussion
and
future directions
25
6.
References
27
7.
Appendix
A:
Premises about
data
quality
requirements
analysis
29
7.1.Premises
related
todata
quality
modeling
29
7.2.Premises
related
todata
quality definitions
and
standards
across
users
30
Toward
Quality
Data:
An
Attribute-Based
Approach
1.
Introduction
Organizationsin industriessuch asbanking, insurance, retail,
consumer
marketing,and
health care are increasingly integrating their business processes across functional, product,and
geographiclines.
The
integration of these business processes, in turn, acceleratesdemand
formore
effectiveapplication systems forproduct development, productdelivery,
and
customerservice (Rockart&
Short,1989).
As
a result,many
applications today require access to corporate functionaland
productdatabases. Unfortunately,
most
databases are not error-free,and
some
contain a surprisingly largenumber
of errors(Johnson, Leitch,&
Neter, 1981). Ina recent industry executivereport. Computer-world surveyed 500medium
sizecorporations (withannualsalesofmore
than $20million),and
rejX)rted thatmore
than60%
ofthe firmshad problems
indata quality.^ The Wall Street journal also reported that:Thanks to computers, huge databases brimming with information are at our fingertips, just
waitingtobetapped. Theycanbemined tofind sales prospects
among
existingcustomers; they can be analyzed to unearth costly corporatehabits; they can be manipulated to divine futuretrends. Justone problem: Thosehugedatabases
may
behillof junk. ... In a world wherepeoplearemovingtototal qualitymanagement,oneofthecritical areasisdata.'^
In general, inaccurate, out-of-date, or incomplete data can
have
significant impacts bothsocially
and
economically (Laudon, 1986; Liepins&
Uppuluri, 1990; Liepins, 1989;Wang
&
Kon,
1992;Zarkovich, 1966).
Managing
data quality, howrever,is acomplex
task.Although
itwould
be ideal toachieve zero defect datar' this
may
notalways be
necessary or attainable for,among
others, the followingtwo
reasons:First, in
many
applications, itmay
not always be necessary to attain zero defectdata. Mailingaddresses in database
marketing
is agood
example. In sending promotional materials to targetcustomers,itisnotnecessaryto
have
thecorrect cityname
inan
addressaslongas the zipcode
iscorrect.Second, there is a cost/quality tradeoff in
implementing
data quality programs. Ballouand
Pazerfound
that "inan
overwhelming
majority of cases, the best solutions in terms of error ratereduction is the worst in terms of cost" (Ballou
&
Pazer, 1987).The
Pareto Principlealso suggeststhatlosses are never uniformly distributed over the quality characteristics. Rather, the lossesare
always
distributed in such a
way
that a small percentage of the quality characteristics, "the vital few,"always
contributes a high percentageof the qualityloss.As
a result, the costimprovement
potential is1 Computerworld, September28, 1992,p.80-84. 2 TheWallStreetJournal,May 26,1992,pageB6.
high for "thevital
few"
projectswhereas
the "trivialmany"
defectsare notworth
tacklingbecause the cure costsmore
than the disease (Juran&
Gryna, 1980). Insum,
when
the cost isprohibitively high,it isnot feasible to attain zero defect data.
Given
thatzero defect datamay
notalways benecessarynorattainable,itwould
beuseful tobe able to judge the quality of data. This suggests thatwe
tag data with quality indicatorswhich
arecharacteristics of the data
and
its manufacturing process.From
these qualityindicators, the usercanmake
ajudgment
of the quality of thedata for the specific application athand. Inmaking
a financialdecisiontopurchase stocks, forexample,it
would
beusefultoknow
thequality ofdata throughquality indicatorssuch
aswho
originated the data,when
the datawas
collected,and
how
the datawas
collected.In this paper,
we
propose
an
attribute-basedmodel
that facilitates cell-level tagging of data.Included in this attribute-based
model
are amathematical
model
description that extends therelational model, a set of quality integrity rules,
and
a quality indicator algebrawhich
can be used toprocess
SQL
queries that areaugmented
with quality indicator requirements.From
these qualityindicators, the usercan
make
a better interpretation of thedataand
determine the believabilityof thedata. In order to establish the relationship
between
data qualitydimensions
and
quality indicators, adata quality requirements analysis
methodology
that extends the Entity Relationship (ER)model
isalso presented.
Just as it is difficult to
manage
product quality withoutunderstanding
the attributes of theproduct
which
define its quality, itis also difficult tomanage
data quality without understanding thecharacteristics that define data quality. Therefore, before
one
can address issues involved in dataquality,
one
must
definewhat
data qualitymeans. In thefollowing subsection,we
present a definitionfor the
dimensions
ofdata quality.LL
Dimensions
ofdata qualityAccuracy
is themost
obviousdimension
when
itcomes
to dataquality.Morey
suggested that"errors occur becauseofdelaysinprocessingtimes, lengthy correctiontimes,
and
overly orinsufficientlystringent data edits" (Morey, 1982). In addition to defining
accuracy
as "the recorded value is inconformity with the actual value," Ballou
and
Pazer defined timeliness (therecorded value is not outof date),
completeness
(all values for a certain variables are recorded),and
consistency
(the&
Pazer, 1987).Huh
et al. identified accuracy, completeness, consistency,and
currency as themost
importantdimensions ofdata quality (Huh, eta!., 1990).It is interesting to note that although
methods
for quality controlhave
been well established in the manufacturing field (e.g.,Juran, 1979), neither the dimensionsofquality for manufacturing nor fordata
have been
rigorously defined (Ballou&
Pazer, 1985; Garvin, 1983; Garvin, 1987; Garvin, 1988;Huh,
et al., 1990;Juran, 1979; Juran&
Gryna, 1980; Morey, 1982;Wang
&
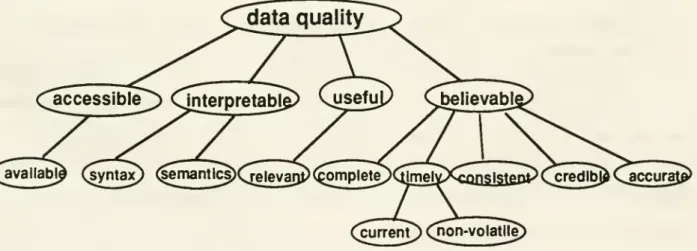
Guarrascio, 1991). It is also interesting to note that there aretwo
intrinsic characteristics ofdata quality:(1) Data quality is a multi-dimensional concept.
(2) Data quality is a hierarchical concept.
We
illustratethesetwo
characteristicsby
consideringhow
a usermay
make
decisionsbasedon
certaindata retrieved
from
a database. First the usermust
be ableto get to the data,which
means
thatthe data
must
be accessible (the user has themeans
and
privilege to get the data). Second, the usermust
be able to interpret thedata (the user understands the syntaxand
semanticsof the data). Third, thedatamust
be useful (datacan be usedasan inputto theuser'sdecisionmaking
process). Finally,the datamust
be
believable to the user (to the extent that the usercan use the data as a decision input).Resulting
from
this list are the following four dimensions: accessibility, interpretability, usefulness,and
believability. Inordertobe
accessible to theuser, the datamust
be available (exists insome
form
thatcan beaccessed); tobe useful,thedata
must
berelevant (fitsrequirementsformaking
thedecision);and
to be believable, the usermay
consider,among
other factors, that the databe
complete,timely,consistent, credible,
and
accurate. Timeliness,inturn,can becharacterizedby
currency(when
thedataitem
was
stored in the database)and
volatility(how
long the item remains valid). Figure 1 depicts the data qualitydimensions
illustrated in this scenario.currenT)Qion-volatile; Figure1:
A
HierarchyofData
QualityDimensions
These
multi-dimensional conceptsand
hierarchy of data qualitydimensions
provide a conceptualframework
for understanding the characteristics that define data quality. In this paper,we
focuson
interpretabilityand
believability, aswe
consider accessibility tobe primarilya function of the information systemand
usefulness tobeprimarilya function ofan
interactionbetween
thedataand
the applicationdomain.
The
idea ofdata taggingis illustratedmore
concretely below.12.
Data
quality:an
attribute-basedexample
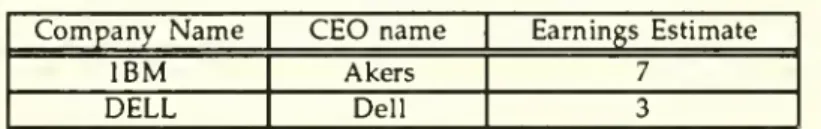
Suppose
an analystmaintainsa databaseon
technologycompanies.The schema
usedtosupportthis effort
may
contain attributes such ascompany
name,
CEO
name,
and
earningsestimate (Table 1).Data
may
be
collectedoveraperiod oftimeand
come
from
a varietyofsources.Table1:
Company
Informationvalue
may
have
a set of quality indicators associated with it. Insome
applications, itmay
benecessary to
know
the quality of the quality indicators themselves, inwhich
case a quality indicatormay,
in turn,have
another set of associated quality indicators.As
such,an
attributemay
have
anarbitrary
number
ofunderlyinglevelsofquality indicators. Thisconstitutesatree structure,asshown
inFigure2below. (attribute)
nndicator)
^indicator")3x...
tK:.
(^indicator) ^(mdlcator)
Figiu-e2:
An
attributewithquality indicatorsConventional spreadsheet
programs
and
database systems are not appropriate for handling datawhich
is structured in thismanner.
In particular, they lack the quality integrity constraints necessary for ensuring that quality indicators arealways
tagged along with the data (and deletedwhen
the data is deleted)and
the algebraic operators necessary for attribute-basedquery
processing.In order to associate
an
attribute with itsimmediate
quality indicators, amechanism must
bedeveloped
to facilitate thehnkage between
the two, as well asbetween
a quality indicatorand
the setof quality indicators associated withit.
This
paper
is organized as follows. Section 2 presents the researchbackground.
Section 3presents the data quality requirements analysis methodology. In section 4,
we
present theattribute-baseddata model. Discussion
and
futuredirectionsaremade
inSection5.2.
Research
background
In this section
we
discussour
rationale for tagging data at the cell level,summarize
theliterature related to data tagging,
and
present theterminologyused
in thispap)er.2.1. Rationale for cell-level tagging
Any
characteristics of data at the relation level should be applicable to all instances of therelation. It is,
however,
not reasonable toassume
that all instances (i.e., tuples) of a relationhave
thesame
quality. Therefore, tagging quality indicators at the relation level is not sufficient to handleBy
thesame
token,any
characteristics of data tagged at the tuple level should be applicableto all attribute values in the tuple.
However,
each attribute value in a tuplemay
be collectedfrom
different sources,
through
different collectionmethods,
and updated
at different points in time. Therefore, tagging data at the tuple level is also insufficient. Since the attribute valueofa cell is the basic unit ofmanipulation, it is necessary to tag qualityinformation at the cell level.We
now
examine
the literature related to data tagging.12.
Work
related todata tag gin gA
mechanism
for tagging data hasbeen proposed
by Codd.
It includesNOTE, TAG,
and
DENOTE
operations to tagand
un-tag thename
of a relation to each tuple.The
purpose
of these operators is to permit both theschema
informationand
the database extension to be manipulated in auniform
way
(Codd, 1979). Itdoesnot, however, allow for the taggingof otherdata (such as source)at either the tuple or cell level.Although
self-describing data filesand
meta-datamanagement
have been proposed
at theschema
level (McCarthy, 1982;McCarthy,
1984;McCarthy,
1988),no
specific solution hasbeen
offeredto manipulate such qualityinformationat the tuple
and
cell levels.A
rule-based representationlanguage basedon
a relationalschema
hasbeen proposed
tostoredata semantics at the instance level (Siegel
&
Madnick,
1991).These
rules areused
to derivemeta-attribute values based
on
values of otherattributes in the tuple.However,
these rules are specified atthe tuple level as
opposed
to the cell level,and
thus cell-level operations are not inherent in the model.A
polygenmodel
(poly=
multiple,gen =
source)(Wang
&
Madnick,
1990) hasbeen proposed
totag multiple data sources at the cell level in a heterogeneous database
environment
where
it isimp)ortant to
know
notonly the originating data source but also the intermediate data sourceswhich
contributeto final
query
results.The
research, however, focusedon
the"where from"
perspectiveand
did not providemechanisms
to dealwithmore
general quality indicators.In (Sciore, 1991), annotations are
used
to support the temporaldimension
ofdata inan
object-oriented environment.
However,
data quality is a multi-dimensional concept. Therefore, amore
general treatment is necessary to address the data quality issue.
More
importantly,no
algebra or calculus-basedlanguage
is provided to support the manipulation of annotations associated with the data.The
examination
of theabove
research efforts suggests that in order to support thefunctionalityofourattribute-basedmodel,
an
extension ofexistingdatamodels
is required.23.
Terminology
To
facilitate furtherdiscussion,we
introduce the following terms:•
An
application attribute refers toan attribute associated with an entity or a relationshipinan entity-relationship (ER) diagram. Thiswould
include the data traditionally associated withan
applicationsuchas partnumber
and
supplier.•
A
quality parameter isa qualitative or subjectivedimension
ofdata qualitythat a user of data defineswhen
evaluating data quality. For example, believabilityand
timeliness are such dimensions.•
As
introduced in Section 1, quality indicators provide objective informationabout
thecharacteristics of data
and
itsmanufacturing
process.'*Data
source, creation time,and
collection
method
areexamples
ofsuchobjectivemeasures.•
A
qualityparameter
value is the value determined (directly or indirectly)by
theuserofdatafor a particular quality parameter based
on
underlying quality indicators. Functions can be definedby
users tomap
quality indicators to quality parameters. For example, the quality parameter credibilitymay
bedefined as high or lowdepending
on
the quality indicatorsource of the data.•
A
quality indicator value is ameasured
characteristic of the stored data. For example, the data quality indicator sourcemay
have
a quality indicator value The Wall Street Journal.We
have
discussed the rationale for cell-level tagging,summarized
work
related to data tagging,and
introduced the terminologyused
in this paper. In the next section,we
present amethodology
for the specification of data quality parametersand
indicators.The
intent is to allow users to thinkthrough
their data quality requirements,and
to determinewhich
quality indicatorswould
be
appropriate fora given application.3.
Data
quality
requirements
analysis
Ingeneral, different users
may
have
differentdata quality requirements,and
different tyf)esof datamay
have
different quality characteristics.The
reader is referred toAppendix
A
for amore
thorough treatment of these issues.
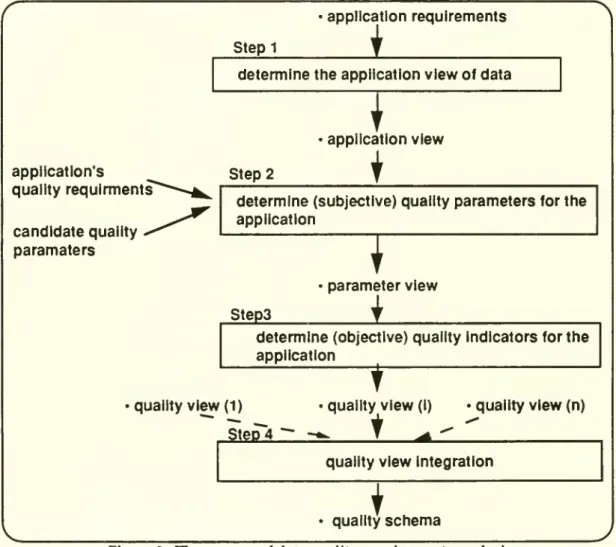
Data
qualityrequirements
analysis isan
effort similar in spirit to traditional data requirements analysis (Batini, Lenzirini,&
Navathe, 1986; Navathe, Batini,&
Ceri, 1992; Teorey,1990), but focusing
on
quality aspects of the data. Basedon
this similarity, parallels can bedrawn
between
traditional data requirements analysisand
data quality requirements analysis. Figure 3depicts the steps involvedinperforming the
proposed
data qualityrequirements analysis.application's quality
requlrments
candidate
qualityparamaters
Stepl
applicationrequirements
determine
theapplicationview
ofdataI
Step
2application
view
i
determine
(subjective) qualityparameters
forthe applicationT
Step3
parameter
view
__i
determine
(objective) quality Indicators forthe application1
quality
view
(1) •qualityview
(I)s'teD'4
-
-*^I
^
quality
view
(n)quality
view
Integrationquality
schema
Figure3:
The
process of data qualityrequirementsanalysis3.1. Step 1: Establishing the applications
view
Step 1 is the
whole
ofthe traditional datamodeling
processand
will not beelaboratedupon
in this paper.A
comprehensive
treatment of the subject hasbeen
presented elsewhere (Batini, Lenzirini,&
Navathe, 1986; Navathe, Batini,&
Ceri, 1992; Teorey, 1990).For illustrativepurposes,
suppose
thatwe
are interested in designing a portfoliomanagement
system
which
containscompanies
that issue stocks.A
company
has acompany
name,
aCEO,
and
an earningsestimate, whilea stockhasa shareprice,a stockexchange (NYSE,
AMS,
orOTC), and
a tickersymbol.
An
ER
diagram
thatdocuments
the applicationview
forour runningexample
isshown
below
inFigure 4.
COMPANY
JSSUES
-<^COI
COMPANY NAME
Z^
CEO
NAME
EARNINGS
ESTIMATE
STOCK
SHARE
PRICE
Figure4:Application
view
(outputfrom
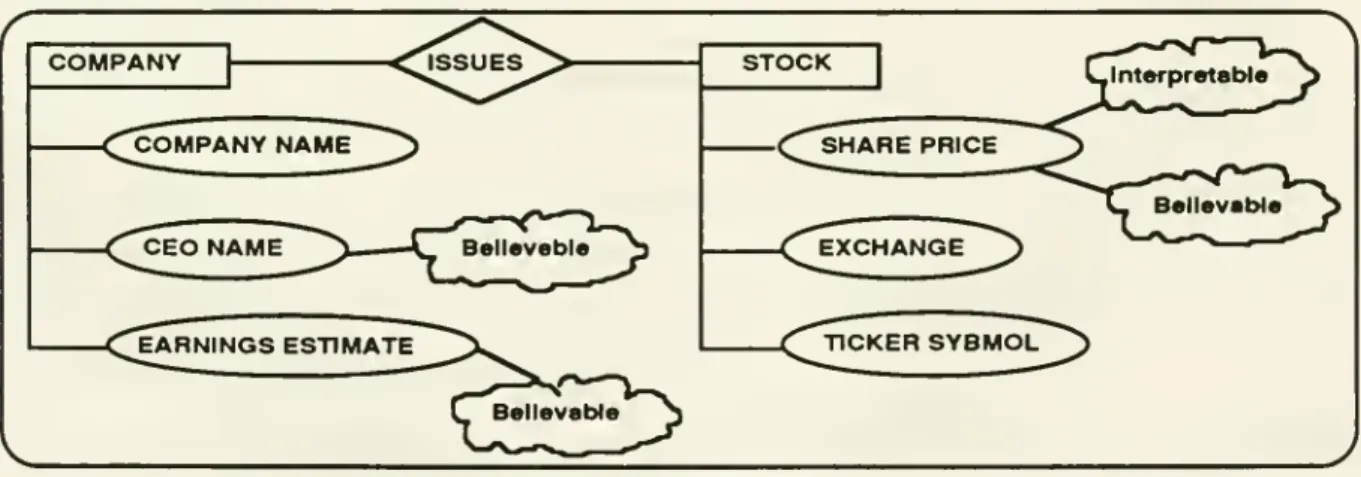
Step 1)2.2, Step 2:
Determine
(subjective)qualityparametersThe
goal in this step is to elicit quality parametersfrom
the user givenan
application view.These
parametersneed
to be gatheredfrom
the user in a systematicway
as data quality is a multi-dimensional concept,and
may
be
operationalized for taggingpurposes
in different ways. Figure 5illustrates the addition of the
two
high level parameters, interpretabilityand
believability. to theapplication view.
Each
quality parameteridentified isshown
inside a "cloud" inthe diagram.Interpretabilitv can be defined through quality indicators such as data units (e.g., in dollars)
and
scale (e.g., in millions). Believability can be defined in terms of lower-level quality parameters such ascompleteness, timeliness, consistency,credibility,and
accuracy. Timeliness, in turn, can bedefined through currency
and
volatility.The
quality parameters identified in this step areadded
tothe application view.
The
resultingview
is referred to as theparameter
view.We
focus hereon
the stockentitywhich
isshown
in Figure6.-o
_
_
STOCK
Figure6: Parameter
view
forthe stockentity (partial outputfrom
Step 2)ii
Step3:Determine
(objective)quality indicatorsThe
goal in Step 3 is to operationalize the primarily subjective quality parameters identified in Step 2 into objective quality indicators.Each
quality indicator is depicted as a tag (using a dotted-rectangle)and
is attached to the correspondingquality parameter (from Step 2), creating the qualityview
.The
portion of the qualityview
for thestockentityin therunningexample
isshown
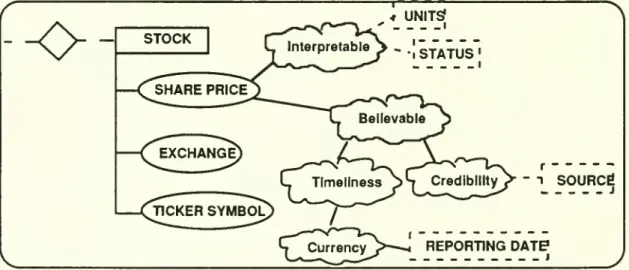
in Figure 7.-o-
STOCK
4 UNITS? lnterpretable^>.^g^^^^jg,
Figure7:
The
portion of the qualityview
forthe stockentity(outputfrom
Step3)Corresponding
to the quality parameter interpretable are themore
objective quality indicators currency unitsinwhich
sharepriceismeasured
(e.g.,$ vs. ¥)and
statuswhich
sayswhether
the share price is the latest closing price or latest nominal price. Similarly, the believability of the share priceisindicated
by
thequality indicators sourceand
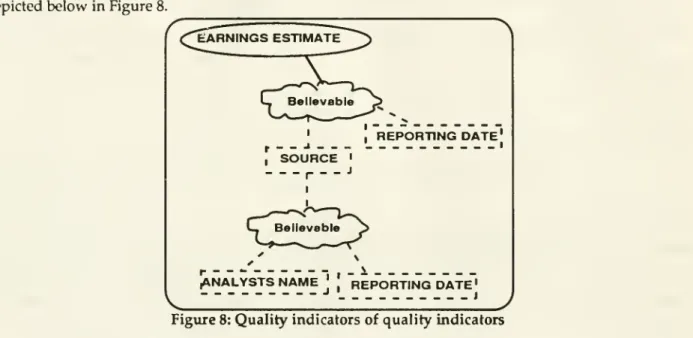
reporting date.For each quality indicator identified in a quality view, if it is important to
have
quality indicators for a quality indicator, then Steps 2-3 are repeated,making
thisan
iterative process. For example, the quality ofthe attribute Earnings Estimatemay
depend
not onlyon
the first level source(i.e., the
name
of the journal)butalsoon
thesecond level source(i.e., thename
of thefinancial analystwho
provided the Earnings Estimate figure to the journaland
the Reporting date). This scenario isdepicted
below
inFigure8.'earnings
estimate
Believable I , _ - J ,SOURCE
•r---"
I L Believable ,REPORTING
DATE'
' I(ANALYSTS
NAME
I I J \_1
REPORTING
DATE'
, JFigure8: Qualityindicators ofquality indicators
All quality
views
are integrated in Step4 to generate the quality schema, asdiscussed in the following subsection.lA, Step4: Creatingthe quality
schema
When
the design is largeand
more
thanone
set of application requirements is involved, multiple qualityviews
may
result.To
eliminateredundancy
and
inconsistency, these quality viewsmust
be consolidated into a single global view, in a process similar toschema
integration (Batini,Lenzirini,
&
Navathe, 1986), so thata variety of data quality requirements can be met.The
resultingsingleglobal
view
is called thequality schema.This involves the integration of qualityindicators. Insimplercases,a
union
ofthese indicatorsmay
suffice. Inmore
complicated cases, itmay
be necessary toexamine
the relationshipsamong
theindicators in orderto decide
what
indicators to includein thequality schema. For example, itis likelythat
one
qualityview
may
have
age
asan
indicator,whereas
anotherquaUty view
may
have
creation time for thesame
quaUty
parameter. In thiscase, creation timemay
be chosen for the qualityschema
becauseage can becomputed
givencurrent rimeand
crearion time.We
have
presented a step-by-step procedure tospecifydata quality requirements.We
arenow
in a position to present the attribute-based data
model
for supporting the storage, retrieval,and
processing ofquality indicatorsas spjecified in the quality schema.4.
The
attribute-based
model
of data
quality
We
chooseto extend the relationalmodel
because the structureand
semanticsof the relationalapproach
are widely understood. Following the relationalmodel
(Codd, 1982), the presentation of the attribute-based datamodel
is divided into three parts: (a) data structure, (b) data integrity,and
(c)data manipulation.
We
assume
that the reader is familiar with the relationalmodel
(Codd, 1970;Codd,
1979; Date, 1990; Maier, 1983).4.L
Data
structxireAs
shown
in Figure 2 (Section 1),an
attributemay
have an
arbitrarynumber
of underlyinglevelsof quality indicators. In order to associate an attribute with its
immediate
quality indicators, amechanism
must be developed
to facilitate the linkagebetween
the two, as well asbetween
a quality indicatorand
the set of quality indicators associated with it. Thismechanism
isdeveloped
throughthe quality
key
concept. In extending the relational model,Codd made
clear theneed
to uniquely identify tuples through a system-wide unique
identifier, called the tupleID
(Codd, 1979; Khoshafian&
Copeland,
1990).^ This concept is applied in the attribute-basedmodel
to enable this linkage.Specifically,
an
attribute in a relationscheme
isexpanded
intoan
ordered pair, called a qualityattribute,consisting of theattribute
and
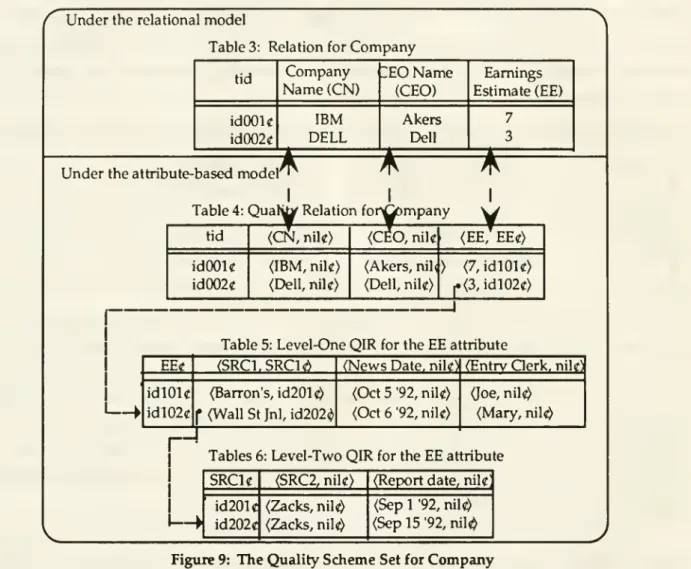
a qualitykey.For example,the attributeEarningsEstimate (EE) inTable3is
expanded
into(EE,EE^) inTable 4where
EEc
is the qualitykey
for the attributeEE
(Tables 3-6 areembedded
in Figure 9). Thisexpanded
scheme
is referred to as a qualityscheme
. InTable 4, ((CN, nik),<CEO,
nik), (EE, EEc))defines a quality
scheme
for the quality relationCompany.
The
"nik"
indicates thatno
quality indicators are associated with the attributesCN
and
CEO;
whereas EEc
indicates thatEE
has associated quality indicators.Correspondingly, each cell in a relational tuple is
expanded
intoan
ordered pair, called aquality cell,consisting of
an
attribute valueand
a quality key value. Thisexpanded
tupleis referred toSimilarly, in the object-orientedliterature, the ability to makereferencesthrough object identityisconsideredabasic
propertyofanobject-orienteddatamodel.
asa quality tuple
and
the resultingrelation (Table 4) is referred toas a quality relation. Each qualitykey value in a quality cell refers to the set of quality indicator values immediately associated with
the attribute value. This set of quality indicator values is
grouped
together toform
a kind of qualitytuple called a quality indicator tuple.
A
quality relationcomposed
of a set of these time-varyingquality indicator tuples is called a quality indicator relation.
The
qualityscheme
that defines thequality indicator relation is referred to as thequality indicator
scheme
.Under
the relationalmodel
Table3: Relationfor
Company
tididOOU
id002cCompany
Name
(CN)
IBM
DELL
;E0Name
(CEO)
Akers Dell Earnings Estimate (EE) 7 3Under
theattribute-basedmodel
I I
Table4:
Qual^
Relationfor>^mpany
tididOOU
idOOZci\^
{CN,
nik) (IBM, nik) (Dell,nik) for>Gompar(CEO,
nik
I (EE, EEC) (Akers,nilO (7,idl01«)(Dell,nik) |.(3,idl02«)
Table5:Level-One
QIR
fortheEE
attributeEEg idlOlc idl02c (SRC1.SRC1<!> (Barron's,id201<) f (WallStJnl,id202<»
(News
Date,nik) (EntrvClerk,nik' (Oct5 "92,nik)(Oct 6'92,nik)
(Joe,nil^
(Mary,nil«^
Tables6:
Level-Two
QIR
fortheEE
attributeindicators fora.
Each
attribute in qr2 , in turn, canhave
a quality indicator relation associated with it.In general,
an
attribute canhave
n-levels ofquality indicator relations associated with it,n
^
0. For example. Tables 5-6 are referred to respectively as level-oneand
level-two quality indicator relations for the attribute Earnings Estimate.We
define a qualityscheme
set as the collection of a qualityscheme
and
all the quality indicatorschemes
that are associated with it. In Figure 9, Tables 3-6 collectively define the qualityscheme
set forCompany.
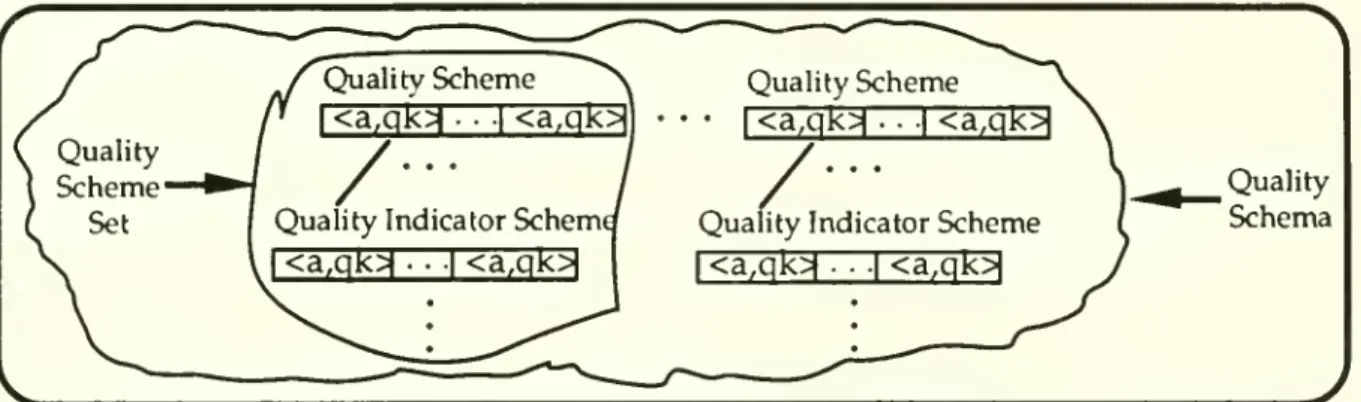
We
define a quality databaseasa database that stores notonlydatabutalsoquality indicators.
A
qualityschema
is defined as a set of qualityscheme
sets that describes the structure of a quality database. Figure 10 illustrates the relationshipamong
quality schemes, quality indicator schemes, qualityscheme
sets,and
thequality schema.Quality
Schema
Figure10 Qualityschemes,quality indicatorschemes,quality
scheme
sets,and
the qualityschema
We
now
present a mathematical definition of the quality relation. Following the constructsdeveloped
in the relationalmodel,we
define adomain
asa setof values of similartype. LetID
bethedomain
forasystem-wideuniqueidentifier (inTable4,idlOlc€ ID). LetD
beadomain
foran
attribute (in Table4, 7€EE where EE
isadomain
forearnings estimate). LetDID
be
definedon
the Cartesian productD
X
ID
(inTable4,<7,idlOU)
€ DID).Let id
be
a qualitykey
value associated withan
attribute value dwhere
d €D
and
id€ ID.A
quality relation(qr) ofdegree
m
isdefinedon
them+1
domains
(m>0;inTable4,m=3)
if itisasubsetofthe Cartesian product:
ID
X
DIDi X
DID2 X
...X
DIDm-Let
qthe
a quality tuple,which
isan
element in a quality relation.Then
a qualityrelation qris designated as:
qr
=
{qtIqt=
<id,didi, did2,•••,didm) where
id€ ID, did; € DID), j=1,...,m)The
integrity constraintsfor the attribute-basedmodel
is presented next.4^
Data
integrityA
fundamental
property of the attribute-basedmodel
is thatan
attribute valueand
itscorresponding quality (including all descendant) indicator values are treated as an atomic unit.
By
atomic unit
we
mean
thatwhenever
an attribute value is created, deleted, retrieved, or modified, itscorresponding quality indicatorsalso need to be created, deleted, retrieved, or modified respectively. In other words, an attribute value
and
its corresponding quality indicator valuesbehave
atomically.We
refer to this property as the atomicity property hereafter. This property is enforcedby
a set ofquality referential integrity rulesasdefined below.
Insertion: Insertion of a tuple in a quality relation
must
ensure that for each non-null qualitykey
present in the tuple (as specified in the qualityschema
definition), the corresponding quality indicator tuplemust
beinserted into thechild quality indicatorrelation. For eachnon-null quality keyin the inserted quality indicator tuple, a correspondingquality indicator tuple
must
be inserted at thenextlevel. Thisprocess
must
be continuedrecursivelyuntilno
more
insertionsare required.Deletion
: Deletion of a tuple in a quality relationmust
ensure that foreach non-null qualitykey
present in the tuple,corresponding
quality informationmust
be
deletedfrom
the table correspondingtothe qualitykey. This processmust
be continuedrecursivelyuntila tupleisencountered with all null quality keys.Modification
: Ifan
attribute value is modified in a quality relation, then the descendantquality indicatorvalues of thatattribute
must
be modified.We
now
introduce a quality indicator algebra fortheattribute-based model.U.
Data manipulation
In order topresent the algebra formally,
we
first definetwo
key concepts thatarefundamentalto the quality indicator algebra: Ol-compatibility
and
OlV-Equal
.4.3.1. Ql-Compatibility
and QIV-Equal
Let a-i
and
a2 betwo
application attributes. Let QKa,) denote the set of quality indicatorsassociated with aj. LetSbe a setof quality indicators. If S
C
QKaj)
and
SC
QI(a2), then aiand
a2are defined to be
Ol-Compatible
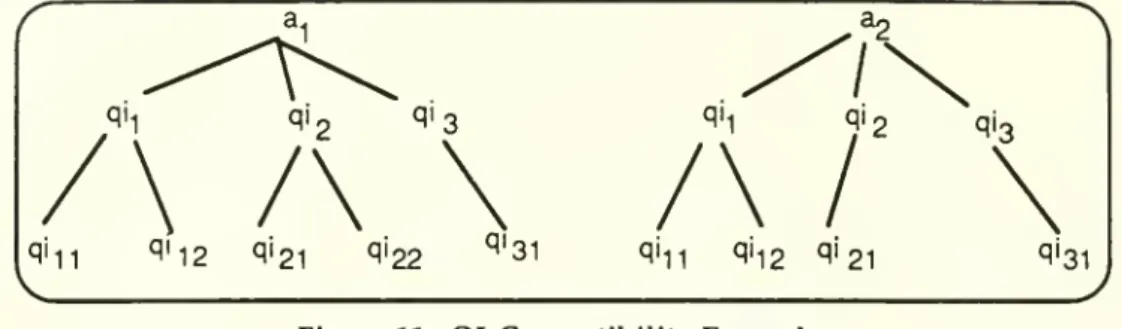
with respect to S.6 For example, if S = {qii, qi2, qi2i), then theattributes aj
and
a2shown
in Figure11 areQl-Compatible with respectto S.Whereas
ifS = (qii, qi22}/then the attributes a^
and
a2shown
in Figure11 arenotQl-Compatible withrespect toS.We
assumethat the numeric subscripts (e.g., qin) n^^P 'he quality indicators tounique positions in the qualityindicatortree.Figure11: Ql-Compatibility
Example
Let 3]
and
82be Ql-Compatible
with respect to S. Letwi and
W2
be values of aiand
82respectively. Let qi(wi) be the value of quality indicator qi for the attribute value
Wi
where
qi g S(qi2(W]) =V2 inFigure 12). Define
Wj
andW2
tobeQIV-Equal
with respect to S provided thatqi(W]) =c
qi(w2)
V
qi6 S,denotedaswi
= W2. InFigure12,forexample,w^ and
W2
areQIV-Equal
with respect toS
=
{qij, qi2i),but notQIV-Equal
withrespect to S = {qii,qisi) because qi3i(wi) = v^-^whereas
qi3i(w2)=
X31. (a^.w.,) (a2,W2)
/\
\\\
/\
\
\
(''hr^l) (qii2^2)
(qi21'^2l' (q'22'''22) «'*31'^31) (<"l1 ^11M
qi^g •^2
> <'''21 ^21> '"bl '"31>v_
y
Figure12:
QIV-Equal
Example
In practice, it is tedious to explicitly state all the quality indicators to be
compared
(i.e., tospecify all the elements of S).
To
alleviate the situation,we
introduce i-level Ql-compatibility(i-level
QIV-Equal)
as a special case for Ql-compatibility (QlV-equal) inwhich
aU
the quality indicatorsup
toa certain level ofdepth
in a quality indicator treeare considered.Letai
and
a2 betwo
application attributes. Let aiand
ai beQl-Compatible
with respect to S.Let
wi and
W2
be values of a^and
a2 respectively, thenwj
and
W2
are defined tobe
i-levelQI-Compatible
ifthe followingtwo
conditions aresatisfied: (1) aiand
82areQl-Compatible
with respectto S,
and
(2) S consists of all quality indicators presentwithin i levelsof the quality indicator treeofai (thus of82).
By
thesame
token, i-levelQIV-Equal between wi and
W2, denotedby Wj
='W2, canbedefined.If 'i' is the
maximum
level of depth in thequality indicator tree, then a-iand
82 are defined tobe
maximum-level Ol-Compatible
. Similarly,maximum-level QIV-Equal between Wj and
W2, denotedby
wi ='" W2,canalso bedefined.To
exemplify the algebraic operations in the quality indicator algebra,we
introducetwo
quality relations having the
same
qualityscheme
set asshown
in Figure 9.They
are referred to asLarge_and_Medium
(Tables 7, 7.1, 7.2 in Figure 13)and
Small_and_Medium
(Tables 8, 8.1,and
8.2 inFigure 14).
Table7
If the clause "with
QUALITY"
is absent in a userquery, then itmeans
that the user hasno
explicit constraints
on
the quality of data that isbeing retrieved. In that case quality indicator valueswould
not becompared
in the retrieval process; however, the quality indicator values associated with the applications datawould
be retrieved as well.In the
extended
SQL
syntax, the dot notation isused
to identify a quality indicator in the quality indicator tree. In Figure 9, for example,EE.SRC1.SRC2
identifiesSRC2
which
is a quality indicator forSRCl,
which
inturn isa quality indicatorto EE.The
quality indicator algebra ispresented in the following subsection.4.3.2. QualityIndicator
Algebra
Following the relational algebra (Klug, 1982),
we
define the five orthogonal quality relationalalgebraicoperations,
namely
selection,projection,union,difference,and
Cartesian product.In the following operations, let
QR
and
QS
betwo
qualityschemes
and
let qrand
qsbe two
quality relationsassociated with
QR
and
QS
respectively. Let aand b
betwo
attributes inbothQR
and
QS. Lettiand
t2 betwo
qualitytuples. LetSg bea setof quality indicatorsSf)ecifiedby
the user forthe attribute a. (That is, Sg is constructedform
the specifications givenby
the user in the "withQUALITY"
clause.) Let thetermt^.a =t2.a denote that the values of theattribute a inthe tuples t]and
t2 are identical. Let ti.a = * t2.a denote that the valuesof attribute a in the tuplest^
and
t2 are QIV-equal with resfject to Sg. Similarly,letti.a =' t2.aand
t].a=
"" t2.a denote i-levelQlV-equal and
maximum-level
QlV-equal respectivelybetween
the values of ti.aand
t2.a.4.3.2.I. Selection
Selectionis a
unary
operationwhich
selects onlya horizontal subset of a qualityrelation (andits
corresponding
quality indicator relations)based
on
the conditions specified in the Selection operation.There
aretwo
types of conditions in the Selection operation: regular conditions for an application attributeand
quality conditions for the quality indicator relations corresponding to the application attribute.The
selection, a'^c (qr)'isdefined asfollows:o^C
(qr)= (tIV
ti 6 qr,V
aeQR,
((t.a =ti.a)a
(t.a ="" t,.a))a
C(ti)}where
C(ti)=
ej <&©2<&... <i)e,,o
e,"i<i)62''d)...d)ep''; Gj isinone
oftheforms: (ti .a 6 constant)or (ti.aGti.b); ei** isoftheforms(qik= constant)or (ti.a = '' ti.b)or (ti.a =' ti.b)or (ti.a
=""
ti .b); qik € QKa); <te {a, v,-,); 6 =(g, s, s, #, <, >, =);
and
Sa,b is the set of qualityindicatorstobe
compared
duringthecomparisonoftj.aand
tj.b.Example
1: GetallLarge_and_Medium
companies
whose
earnings estimateisover2and
issuppliedby
Zacks Investment Research.A
corresponding extendedSQL
queryisshown
asfollows:SELECT
FROM
WHERE
withQUALITY
CN, CEO, EELARGE_AND_MEDIUM
EE>2
EE.SRC1.SRC2='Zacks'This
SQL
query
canbe
accomplished through a Selection operation in the quality indicatorSELECT
CN,EE
FROM
LARGE_and_MEDIUM
This
SQL
query
can be accomplished througha Projection operation.The
result isshown
below.Note
also that unlike the relational union, the qualityunion
operation is not commutative.This is illustrated in
Example
3-3 below.Example
3-3: ConsiderthefollowingextendedSQL
querywhich
switches theorderof theunionoperation in
Example
3-b:SELECT
FROM
UNION
SELECT
FROM
withQUALITY
SM.CN, SM.CEO, SM.EE
SMALL_and_MEDIUM SM
LM.CN, LM.CEO, LM.EE
LARGE_and_MEDIUM
LM
(LM.EE.SRC1= SM.EE.SRCl)The
result isshown
below.Example
4: Get all thecompanies which
are classified asonlyLarge_and_Medium
companies
butnotas
Small_and_Medium
companies.A
correspondingSQL
queryisshown
asfollows:SELECT
FROM
DIFFERENCE
SELECT
FROM
WithQUALITY
LM.CN, LM.CEO, LM.EE
LARGE_and_MEDIUM
LM
SM.CN, SM.CEO, SM.EE
SMALL_and_MEDIUM
SM
(LM.EE.SRC1.SRC2 = SM.EE.SRC1.SRC2)This
SQL
query
can be accomplished through a Difference operation.The
result isshown
below.
4.3.2.5. Cartesian Product
The
Cartesian product is also a binary operation. LetQR
beof degreerand
QS
be ofdegree s.Let ti € qrt2 e qs. Lett](i) denote the i'^ attribute of the tuple t]
and
t2(i) denote the i"^ attribute ofthe tuple t2.
The
tuple tin thequalityrelation resultingfrom
theCartesian product ofqrand
qs will beofdegreer+s.
The
Cartesianproductofqrand
qs,denoted asqrX^ qs,isdefined as follows:qrX^qs={t I
V
t] G qr, Vt2 6 qs,t(l)
=
t,(l)A
t(l)="
tid)A
t(2)= t,(2)A t(2) ='" t,(2)A
... t(r) =ti(r)a
t{r) ="" t,(r)a
t(r+l)= t2(l)
A
t(r+l)="
t2(l)A
t(r+2) =t2(2)a
t(r+2)="" t2(2)a
... t(r+s)=tzCs)a
t(r+s)="
t2(s) )The
result of the Cartesian productbetween
Large_and_Medium
and
Small_and_Medium
isshown
below.We
have
presented theattribute-basedmodel
includinga description of themodel
structure, aset of integrity constraints for the model,
and
a quality indicator algebra. In addition, each of thealgebraic operations are exemplified inthecontext of the
SQL
query.The
nextsectiondiscussessome
of the capabilities of thismodel and
future researchdirections.5.
Discussion
and
future directions
The
attribute-basedmodel
can beapplied inmany
differentways
and
some
ofthem
are listedbelow:
•
The
ability of themodel
to support quality indicators at multiple levelsmakes
it possible toretain theorigin
and
intermediate data sources.The example
in Figure9 illustrates this.•
A
user can filter the data retrievedfrom
a database according to quality requirements. InExample
1, for instance,only the data furnishedby Zacks
Investment Research is retrieved asspecified in theclause "with
QUALITY
EE.SRCl.SRC2='Zacks'."• Data authenticity
and
believability can beimproved by
data inspectionand
certification.A
quality indicator value could indicate
who
inspected or certified the dataand
when
itwas
inspected.
The
reputation of the inspector willenhance
the believability of the data.•
The
quality indicators associated withdata can helpclarify data semantics,which
can be usedto resolve semantic incompatibility
among
data items receivedfrom
different sources. This capability is very useful inan
interoperableenvironment
where
data in different databaseshave
different semantics.• Quality indicators associated with
an
attributemay
facilitate a better interpretation of nullvalues. Forexample,if thevalue retrieved for the spousefield is
empty
inan
employee
record,it can
be
interpreted (i.e., tagged) in several ways, such as (I) theemployee
is unmarried, (2)the
spouse
name
isunknown,
or (3) this tuple is inserted into theemployee
tablefrom
the materialization ofaview
overa tablewhich
does nothave
spouse field.• Ina data quality control process,
when
errors are detected, the data administrator canidentifythesource of error
by examining
quality indicatorssuchasdata source orcollectionmethod.
In thispaper,
we
have
investigatedhow
quality indicatorsmay
be specified, stored, retrieved,and
processed. Specifically,we
have
(1) established a step-by-stepprocedure
for data quality requirementsanalysisand
specification,(2)presented amodel
forthe structure, storage,and
processingof quality relations
and
quality indicator relations (through the algebra),and
(3)touched
upon
functionalities related to data quality administration
and
control.We
are actively pursuing research in the followingareas: (1) Inorder to determine the quality of derived data (e.g.,combining
accuratemonthly
data with less accurateweekly
data),we
are investigatingmechanisms
to determine the quality of derived data basedon
the quality indicator values of itscomponents.
(2) In order to use thismodel
for existing databases,which
do
nothave
tagging capability, theymust
beextended
with qualityschemas
instantiatedwith
appropriate quality indicator values.We
are exploring the possibility ofmaking
such a transformationcost-effective. (3)
Though
we
have
chosen the relationalmodel
to represent the quality schema,an
object-oriented
approach
appears natural tomodel
dataand
its quality indicators. Becausemany
of the quality controlmechanisms
areprocedure
orientedand
o-omodels
canhandle
procedures (i.e.,methods),
we
areinvestigating the prosand
consof the object-orientedapproach.6.
References
[I] Ballou, D. P.
&
Pazer, H. L. (1985).Modeling
Dataand
Process Quality in input, Multi-output Information Systems.Management
Science,11(2), pp. 150-162.[2] Ballou, D. P.
&
Pazer, H. L. (1987). Cost/Quality Tradeoffs forControl Procedures in InformationSystems. International Journal of
Management
Science, 15(6), pp. 509-521.[3] Batini,
C,
Lenzirini, M.,&
Navathe, S. (1986).A
comparative
analysis ofmethodologies
fordatabase
schema
integration.ACM
Computing Survey,1£(4), pp. 323 - 364.[4J
Codd,
E. F. (1970).A
relationalmodel
of data for large shared data banks. Communications of theACM,
ii(6),pp. 377-387.[5]
Codd,
E. F. (1979). Extending the relational databasemodel
to capturemore
meaning.
ACM
Transactions on Database Systems, 1(4), pp. 397-434.
[6]
Codd,
E. F. (1982). Relational database:A
practical foundation for productivity, the 1981ACM
TuringAward
Lecture. Communications oftheACM,
25(2), pp. 109-117.[7] Date, C. J. (1990).
An
Introduction to Database Systems (5th ed.). Reading,MA:
Addison-Wesley.[8] Garvin, D. A. (1983). Quality
on
the line. Harvard Business Review, (September- October), pp.65-75.
[9] Garvin, D. A. (1987).
Competing
on
the eightdimensions
of quality. Harvard Business Review,(November-December),
pp. 101-109.[10] Garvin, D. A. (1988).
Managing
Quality-The Strategic and Competitive Edge (1 ed.).New
York:The
FreePress.[II]
Huh,
Y. U., et al. (1990).Data
Quality. Information and Software Technology, 22(8), pp. 559-565.[12] Johnson, J. R.,Leitch, R. A.,
&
Neter, ]. (1981).Characteristicsof ErrorsinAccounts
Receivableand
Inventory Audits. Accounting Review, 56(April), pp. 270-293.
[13] Juran, J.
M.
(1979). Quality ControlHandbook
(3rd ed.).New
York:McGraw-Hill
Book
Co.[14] Juran, J.
M.
&
Gryna, F.M.
(1980). Quality Planning and Analysis (2nd ed.).New
York:McGraw
Hill.
[15] Khoshafian, S.
N.
&
Copeland, G. P. (1990). ObjectIdentity. In S. B.Zdonik&
D.Maier
(Ed.), (pp.37-46).
San
Mateo,CA:
Morgan
Kaufmann.
[16] Klug, A. (1982). Equivalence of relational algebra
and
relationalcalculusquery
languages having aggregate functions. TheJournalofACM,
22, pp. 699-717.[17]
Laudon,
K. C. (1986). Data(Qualityand
Due
Process in Large InterorganizationalRecord
Systems. Communications of theACM,
22(1), pp. 4-11.[18] Liepins, G. E.
&
Uppuluri, V. R. R. (1990). Data Quality Control: Theory and Pragmatics (pp. 360).New
York: Marcel Dekker, Inc.[19] Liepins, O. E. (1989).
Sound
DataAre
aSound
Investment. Quality Programs, (September), pp. 61-63.[20] Maier, D. (1983). The Theory of Relational Databases (1st ed.). Rockville,
MD:
Computer
SciencePress.
[21]
McCarthy,
J. L. (1982). MetadataManagement
for Large Statistical Databases.Mexico
City,Mexico. 1982.pp. 234-243.
[22]
McCarthy,
J. L. (1984). Scientific Information = Data + Meta-data. U.S.Naval
PostgraduateSchool,Monterey,
CA.
1984. pp.[23]
McCarthy,
J. L. (1988). The Automated Data Thesaurus:A
New
Tool for Scientific Information.Proceedingsof the11th International
Codata
Conference, Karlsruhe,Germany.
1988. pp.[24]
Morey,
R. C. (1982). Estimatingand
Improving
the Quality of Information in the MIS. Communications oftheACM,
25(May), pp. 337-342.[251 Navathe, S., Batini,
C,
&
Ceri, S. (1992). The Entity Relationshiip Approach .New
york:Wiley
and
Sons.[26] Rockart, J. F.
&
Short, J. E. (1989). IT in the 1990s:Managing
Organizational Interdependence.Sloan
Management
Review, Sloan School ofManagement,
MIT,
lfl(2), pp. 7-17.[27] Sciore, E. (1991).
Using
AnnotationstoSupport MultipleKinds
ofVersioninginan
Object-OrientedDatabase System.
ACM
Transactions on Database Systems, l£(No. 3,September
1991), pp. 417-438.[28] Siegel,
M.
&
Madnick,
S. E. (1991).A
metadata approach to resolving semantic conflicts.Barcelona, Spain. 1991. pp.
[29] Teorey, T. J. (1990). Database
Modeling
and Design: The Entity-Relationship Approach .San
Mateo,
CA
:Morgan
Kaufman
Publisher.[30]
Wang,
R. Y.&
Kon,
H. B. (1992).Towards
Total Data QualityManagement (TDQM).
In R. Y.Wang
(Ed.), Information Technology in Action: Trends and PerspectivesEnglewood
Cliffs, NJ:Prentice Hall.
[31]
Wang,
Y. R.&
Guarrascio, L.M.
(1991). Dimensions of Data Quality: Beyond Accuracy. (CISL-91-06)Composite
InformationSystems
Laboratory, Sloan School ofManagement,
MassachusettsInstituteofTechnology,
Cambridge,
MA,
02139 June1991.[32]
Wang,
Y. R.&
Madnick,
S. E. (1990).A
PolygenModel
for Heterogeneous Database Systems: The Source Tagging Perspective. Brisbane, Australia. 1990. pp. 519-538.[33] Zarkovich. (1966). Quality of Statistical Data .
Rome:
Food
and
Agriculture Organization of theUnited Nations.
\
7.
Appendix
A:
Premises about
data quality
requirements
analysis
Below
we
present premises related to data qualitymodeling
and
data quality requirementsanalysis.
To
facilitate further discussion,we
define a data quality attribute as a collective term thatrefers tot>oth quality parameters
and
quality indicatorsasshown
in Figure A.l. (This term isreferred to as a quality attribute hereafter.)Data
Quality Attributes (collective)
FigureA.l: Relationship
among
quality attributes,qualityparameters,and
qualityindicators.7.1. Premisesrelatedto data quality
modeling
Data quality
modeling
isan
extension of traditional datamodeling
methodologies.As
datamodeling
capturesmany
of the structuraland
semantic issuesunderlying data, dataqualitymodeling
capturesmany
of the structuraland
semantic issues underlying data quality.The
following four premises relate to these data qualitymodeling
issues.(Premise 1.1) (Relatedness
between
entityand
quality attributes): Insome
cases aquahty
attribute can be considered either as
an
entity attribute (i.e., an application entity's attribute) or as aquality attribute. For
example,
thename
of a tellerwho
performs
a transaction in abanking
application
may
be
an
entity attribute if initial application requirements state that the teller'sname
be included; alternatively, it
may
be modeled
as a quality attribute.From
amodeling
perspective,whether
an attributeshould bemodeled
asan
entity attributeora quality attribute is a
judgment
callon
the part of the design team,and
may
depend
on
the initialapplication requirements as well as eventual uses of the data, such as the inspection of the data for
distribution to external users, or for integration with other data ofdifferent quality.
The
relevance of distributionand
integration of the information is that often the users of a givensystem
"know"
the quality of the data they use.When
the data is exported to their users,however,
orcombined
with information of different quality, thatqualitymay
become unknown.
A
guideline to thisjudgment
is to askwhat
information theattribute provides. Ifthe attributeprovidesapplication information such as a customer
name
and
address, itmay
be considered an entityattribute. If,
on
the other hand, the information relatesmore
to asf)ects of the data manufacturingprocess, such as
when,
where,and by
whom
the datawas
manufactured, then thismay
be a qualityattribute.
In short, theobjectiveof the data qualityrequirement analysisis notstrictly to develop quality
attributes,but also to ensure that important
dimensions
of data quality are not overlooked entirely inrequirement analysis.
(Premise 1.2) (Quality attribute non-orthogonality): Different quality attributes
need
not be orthogonal toone
another. For example, thetwo
quality parameters credibilityand
timeliness arerelated (i.e., not orthogonal), such asfor real time data.
(Premise 1.3) (Heterogeneity
and
hierarchy in the quality ofsupplied data): Quality of datamay
differ across databases, entities, attributes,and
instances. Database example: information in auniversity database
may
be of higher quality than data in John Doe's personal database. Entity example: dataabout
alumni
(an entity)may
be less reliable than data about students (an entity).Attribute example: in the student entity, grades
may
bemore
accurate than are addresses. Instance example: data aboutan
internationalstudentmay
be lessinterpretable than thatofa domesticstudent.7.2. Premisesrelatedtodata quality definitions
and
standardsacross usersBecause
human
insight isneeded
for data qualitymodeling
and
different peoplemay
have
different opinions regardingdata quality, different quality definitions
and
standardsmay
result.We
call this
phenomenon
"data quality is in the eye of the beholder."The
followingtwo
premises entail thisphenomenon.
(Premise 2.1) (Users define different quality attributes): Quality
parameters
and
quality indicatorsmay
varyfrom one
userto another. Quality parameter example: for amanager
the quality parameter for a research reportmay
be inexpensive,whereas
for a financial trader, the research reportmay
need
tobe
credibleand
timely. Quality indicatorexample:
themanager
may
measure
inexpensiveness in terms of the quality indicator (monetary) cost,
whereas
the tradermay
measure
inexpensiveness in terms of opportunity cost of herown
timeand
thus the quality indicatormay
beretrieval time.
(Premise 2.2) (Users
have
differentquality standards): Acceptable levels of data qualitymay
differ
from one
user to another. For example,an
investor following themovement
of a stockmay
consider a fifteen
minute
delay for share price to be sufficiently timely,whereas
a traderwho
needspricequotesin realtime
may
notconsiderfifteenminutestobetimelyenough.7.3. Premisesrelatedtoa single user
A
single usermay
have
different quality attributesand
quality standards for the differentdata used. This
phenomenon
issummarized
inPremise3 below.(Premise 3) (For asingle user;
non-uniform
data qualityattributesand
standards):A
usermay
have
different quality attributesand
quality standards across databases, entities, attributes, orinstances. Acrossattributesexample:
A
usermay
need
higher qualityinformation forthephone
number
thanforthe
number
ofemployees. Acrossinstancesexample:A
usermay
need
highqualityinformationfor certaincompanies, butnotforothers
due
tothe factthatsome
companies
are of particularinterest.Date
Due
^luidggf
-1 ^ft?;i
Mn i.iPRaRiF<; nun
"" "Nil
Mllllllllllllilli
3