HAL Id: hal-00301235
https://hal.archives-ouvertes.fr/hal-00301235
Submitted on 2 Sep 2003HAL is a multi-disciplinary open access
archive for the deposit and dissemination of sci-entific research documents, whether they are pub-lished or not. The documents may come from teaching and research institutions in France or abroad, or from public or private research centers.
L’archive ouverte pluridisciplinaire HAL, est destinée au dépôt et à la diffusion de documents scientifiques de niveau recherche, publiés ou non, émanant des établissements d’enseignement et de recherche français ou étrangers, des laboratoires publics ou privés.
Characterization of African dust over southern Italy
A. Blanco, F. de Tomasi, E. Filippo, D. Manno, M. R. Perrone, R. Serra, A.
M. Tafuro, A. Tepore
To cite this version:
A. Blanco, F. de Tomasi, E. Filippo, D. Manno, M. R. Perrone, et al.. Characterization of African dust over southern Italy. Atmospheric Chemistry and Physics Discussions, European Geosciences Union, 2003, 3 (5), pp.4633-4670. �hal-00301235�
ACPD
3, 4633–4670, 2003Characterization of African dust over
southern Italy A. Blanco et al. Title Page Abstract Introduction Conclusions References Tables Figures J I J I Back Close Full Screen / Esc
Print Version
Interactive Discussion
c
EGU 2003 Atmos. Chem. Phys. Discuss., 3, 4633–4670, 2003
www.atmos-chem-phys.org/acpd/3/4633/ c
European Geosciences Union 2003
Atmospheric Chemistry and Physics Discussions
Characterization of African dust over
southern Italy
A. Blanco1, F. De Tomasi1, E. Filippo2, D. Manno2, M. R. Perrone1, A. Serra2, A. M. Tafuro1, and A. Tepore2
1
Istituto Nazionale di Fisica della Materia, Dipartimento di Fisica, Universita’ di Lecce, Lecce, Italy
2
Istituto Nazionale di Fisica della Materia, Dipartimento di Scienza dei Materiali, Universita’ di Lecce, Lecce, Italy
Received: 1 July 2003 – Accepted: 1 August 2003 – Published: 2 September 2003 Correspondence to: M. R. Perrone (perrone@le.infn.it)
ACPD
3, 4633–4670, 2003Characterization of African dust over
southern Italy A. Blanco et al. Title Page Abstract Introduction Conclusions References Tables Figures J I J I Back Close Full Screen / Esc
Print Version
Interactive Discussion
c
EGU 2003 Abstract
Dust samples from rainfall residues have been collected in southeast Italy (40◦200N, 18◦60E) during dust outbreaks occurred from April to June 2002 to characterize mor-phological and elemental particle composition by different techniques, and investigate the dependence of particle properties on source regions. Four-day analytical back
tra-5
jectories and satellite images have been used to infer source regions of the investigated dust samples.
It has been found that the TOMS aerosol index product was in the range 0.7–2.2 over Southern Italy when samples have been collected. The particle-size and -shape analysis by a scanning electron microscope (SEM) has revealed either that the
particle-10
diameter distribution was between 0.3 and 30 µm with median-diameter values be-tween 1.7–2.4 µm, and that the particles were characterized by a roundness factor varying from 0.8 to 2.5. The infrared transmission spectra have allowed recognizing that all dust samples contained a significant amount of illite. The X-ray energy disper-sive (EDX) measurements have revealed that the Al/Si ratio of the transported dust
15
varies from 0.41 to 0.50, and that the Al/Si, Ca/Al, K/Ca, and Fe/Ca ratios differ accord-ing to source regions and therefore can be used as indicators of dust source regions. Indeed, it has been found that dust samples with larger Ca/Al and Si/Al ratios and lower Fe/Ca and K/Ca ratios, have been collected along dust events with a source region in northwestern Sahara. On the contrary, the samples collected along dust events with
20
the origin mainly in Chad, Niger, Algeria and Lybia were characterized by larger Fe/Ca and K/Ca ratios.
1. Introduction
Mineral aerosols absorb at ultraviolet, visible and infrared wavelengths and the scien-tific community is making great efforts to document and understand their interactions
25
ACPD
3, 4633–4670, 2003Characterization of African dust over
southern Italy A. Blanco et al. Title Page Abstract Introduction Conclusions References Tables Figures J I J I Back Close Full Screen / Esc
Print Version
Interactive Discussion
c
EGU 2003 is still largely uncertain (e. g. Sokolik and Toon, 1999; Intergovernmental Panel on
Climate Change, IPCC, 2001). The most widespread mineral aerosols are those origi-nating from wind erosion of arid and semi-arid lands and the global source strength of these aerosols is currently estimated to a value between 1000 and 5000 Mt/yr (Tegen and Fung, 1995). The Sahara desert represents one of the main sources of mineral
5
aerosols and it is considered to be the dominant dust source for the Mediterranean basin. The dust particles captured by the wind at the surface are raised to consid-erable tropospheric altitudes by the strong convective regimes that develop over the desert, and then are transported by the winds to Europe and Middle East regions, and over the North Atlantic Ocean up to South America. Dust particles originating from
10
Sahara have been observed over southern Europe (e.g. Prodi and Fea, 1979; Levin et al.,1980; Guerzoni et al., 1997; Avila et al., 1997; Gobbi et al., 2003), in the Caribbean (e.g. Talbot et al., 1986), and southern Florida (e.g. Prospero, 1999). However, only a small fraction of the total soil loss in Northern Africa reaches Europe (Molinaroli, 1996). In particular, d’Almeida (1986) has shown that the dust transport across the northern
15
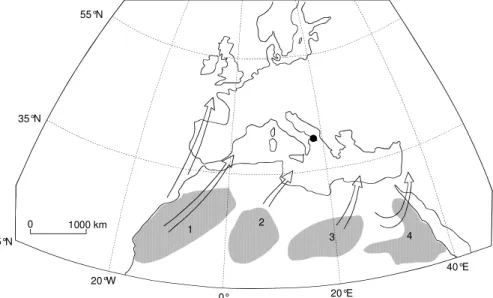
borders of the Sahara into the west Mediterranean Sea is approximately 12% of the total, mainly originating from Morocco to north Mauritania (Source 1), south Algeria, Mali, and Niger(Source 2), south Libya and Chad (Source 3), and Egypt and the north-ern part of Sudan (Source 4). The location of Source 1–4 is shown in Fig. 2 by dots (from D’Almeida, 1986). The arrows in Fig. 1 indicate the main routes of dust outbreaks
20
toward the Mediterranean Sea and continental Europe (from Molinaroli, 1996).
The desert dust properties may change as the particles move away from source regions and dust particles studies at different monitoring sites are of peculiar impor-tance to know about processes affecting levels and compositions of mineral aerosols. A study by Prospero et al. (1981) has shown the changes in mineralogy of Sahara dust
25
samples collected at various distances off the coast of Africa along the dust plume transported over the Atlantic Ocean. Chester et al. (1992) have reported the variation of clay minerals with latitude in dust samples collected off the west coast of Africa. On the contrary, a recent study of Chiapello et al. (1997) based on 3 years of daily
mea-ACPD
3, 4633–4670, 2003Characterization of African dust over
southern Italy A. Blanco et al. Title Page Abstract Introduction Conclusions References Tables Figures J I J I Back Close Full Screen / Esc
Print Version
Interactive Discussion
c
EGU 2003 surements of mineral dust concentrations at Sal Island (Capo Verde), has revealed that
the differences in dust composition allow getting a clear signature between the differ-ent source regions involved since can be related to soil composition changes over the North African desert (Avila et al., 1997).
The transport of Saharan dust over northern and western Italy has been documented
5
and studied from the meteorological, mineralogical and chemical points of views in several papers (Prodi and Fea, 1979; Bergametti et al., 1989a, b; Guerzoni et al., 1997, Molinaroli, 1996). Lidar and in situ observations of Saharan aerosols for the analysis of the particle optical and physical properties have recently been reported by Gobbi el al. (2003).
10
This work is an attempt to trace source regions and transport of dust plumes by means of grain-size and elemental particle composition analyses performed on dust samples collected at Lecce, a new monitoring site (40◦200N, 18◦60E) in the south-eastern corner of Italy, which is 800 km away from the northern Africa coast. It is believed that the results of this paper contribute to the studies on the dependence of
15
the desert aerosol properties on source regions and monitoring site. The dust samples have been collected during strong dust outbreaks occurred from April to June 2002. Climatological studies of the desert aerosol transport to the Mediterranean based on satellite and ground-based observations have shown that the dust input is maximum in the late spring and summer, when the most common configuration of cyclones favors
20
northward motion of the air masses (e.g. Alpert et al., 1990). Modeled back trajecto-ries, satellite data and true color SeaWiFS images have been used to document and characterize the dust events during which dust samples have been collected.
Sampling methods and satellite data used to characterize the investigated dust events are given in Sects. 2 and 3, respectively. Results and discussion are presented
25
ACPD
3, 4633–4670, 2003Characterization of African dust over
southern Italy A. Blanco et al. Title Page Abstract Introduction Conclusions References Tables Figures J I J I Back Close Full Screen / Esc
Print Version
Interactive Discussion
c
EGU 2003 2. Sampling site and methods
The dust samples have been collected at the Physics Department of Lecce’s University. A rural site quite isolated from local anthropogenic or soil-derived contamination, which is located on the flat Salentum peninsula, at about 15 and 25 km from the Adriatic and Ionic Sea, respectively, and at about 800 km from the northern Africa coast. This last
5
peculiarity makes the sampling site rather suitable for the monitoring of African dust transport early in its life cycle. The desert type aerosols can be directly advected to Lecce from the African deserts without being significantly affected by antropogenic aerosols and by the removal of coarse mode particles with diameters > 1 µm as a consequence of the gravitational setting (e.g. Sokolik and Toon, 1999; Mattis et al.,
10
2002).
Several dust samples from rainfall residues have been collected on glass substrates at about 5 m from ground, during every dust event. The typical sampling duration was of 6–8 h. Care was taken to avoid the contamination by local sources as dust like particles both during the sampling duration and before the sample processing time.
15
The samples have been processed few days after the collection day. However, it has been observed that the results on sample characterization were not dependent on the time elapsed between collection and processing. We have examined the composition of these samples qualitatively by two methods. The first method was infrared trans-mission spectroscopy, using the conventional KBr pellet technique with a Perkin Elmer
20
Spectrum 2000 FT-IR spectrometer in the 1.5–26 µm spectral region. To this purpose about 0.05–0.3% by mass of the dust taken away from the glass substrate has been embedded in 250 mg of powder of potassium bromide (KBr), which is transparent in the spectral range of interest. This method produces a transmittance spectrum that can provide qualitative information on the major chemical constituents in the sample. Then,
25
micro-analytical methods have been used to simultaneously detect morphology and el-emental composition of every single particle. Atmospheric particles are chemically and morphologically heterogeneous and the average composition obtained by bulk
anal-ACPD
3, 4633–4670, 2003Characterization of African dust over
southern Italy A. Blanco et al. Title Page Abstract Introduction Conclusions References Tables Figures J I J I Back Close Full Screen / Esc
Print Version
Interactive Discussion
c
EGU 2003 ysis does not highlight the single particle characteristics. Single particle studies are
essential in environmental atmospheric chemistry, since allow identifying the various processes involved in the formation and evolution of atmospheric aerosols (Raes et al., 2000; Ro et al., 2001).
In our study, morphological and elemental composition analyses have been
per-5
formed using a scanning electron microscope SEM-JEOL JSM 5010LV equipped with an Oxford X-ray energy dispersive (EDX) microanalysis system. To this end, the dust has been deposited onto SEM sample holders covered with a carbon adhesive layer. The SEM-EDX system can provide single particle surface morphology, size and shape distribution and elemental composition qualitatively and semi-quantitatively, even of low
10
atomic number elements, such as C and O. However, it has the disadvantage of being very time consuming. Furthermore, accurate quantitative estimates can be hampered by the loss of volatile components, since the dust particles are subjected to high vac-uum conditions (10−6 Torr) and an intense electron beam during SEM EDX analyses (Ma et al., 2001). SEM images have been obtained by backscattered electrons (BSE)
15
with an accelerating voltage of 20 kV and a beam current of 80 µA. The BSE signal is better than the secondary-electron signal for detecting mineral particulate, because of its higher atomic number contrast (Paoletti et al., 2002). The dust holder has directly been introduced in the microscope sample chamber without any further preparation. Counting and size distribution of the particles has been obtained from SEM pictures
20
by combining the data obtained with three different magnifications (500x, 1000x and 3500x). The Feret diameter that is defined as the average caliper distance of 36 mea-surements around the particle center employing a 5◦angle of rotation, has been used to determine particle size (Podczeck et al., 1999). The particle shape has been inferred by means of the roundness factor defined by the relation R = 4πAP2 , where the object’s
25
area A is defined by the number of pixels having intensity values within a selected range and the perimeter P is given by the outline length of each particle. Smooth and round objects have then a roundness factor close to unity, whereas rough or elongated objects have roundness factors larger than one (Nazar et al., 1996). More than 800
ACPD
3, 4633–4670, 2003Characterization of African dust over
southern Italy A. Blanco et al. Title Page Abstract Introduction Conclusions References Tables Figures J I J I Back Close Full Screen / Esc
Print Version
Interactive Discussion
c
EGU 2003 particles have been analyzed in every dust sample to make a statistical analysis. An
X-ray spectrum has been collected for 200s for every SEM image, and an X-ray dotted map has been acquired for one hour for every chemical element recognized by the X-ray spectrum. X-X-ray spectra allow calculating the net X-X-ray peak-area of each element, in order to obtain a first semi quantitative information about the chemical composition
5
of the sample. The X-ray dotted maps have instead been acquired to determine the spatial distribution of selected elements on the investigated area. Indeed, the white dots in every dotted element map, show the sites where the element concentration is high. The dots get gray as the element concentration reduces and the element is absent in the black map areas (Goldstein and Yakowitz, 1975).
10
3. Dust event characterization
The dust samples have been collected under the so-called “dust alerts” issued by the Atmospheric Modeling Weather Forecasting Group of the Athens’s University, Greece (http://forecast.uoa.gr/forecastnew.html). In particular, the results on the characteriza-tion of dust samples collected during four strong Sahara dust outbreaks occurred from
15
April to June 2002, are presented in this paper.
The first dust samples have been collected on 12 April, during the strong dust out-break occurred over the Mediterranean Sea from 8 April to 14 April, in accordance to backtrajectories and SeaWiFS images. The four-day analytical backtrajectories of 12 April at 13:00 UT are shown on Fig. 2a. The atmospheric backward trajectories have
20
been calculated on a 3-dimensional grid with a time resolution of 6 h, by the German Weather Service from the wind fields of the European numerical weather prediction model (Kottmeier and Fay, 1998). It is believed that this calculation method leads to lower uncertainties in comparison to those of other methods, e.g. isentropic calcula-tion. The accuracy of the calculated trajectories depends on the synoptic conditions.
25
The higher the wind-speed the lower is the uncertainty of the trajectories. Usually the deviation between the calculated and the actual track of an air parcel is about 10% to
ACPD
3, 4633–4670, 2003Characterization of African dust over
southern Italy A. Blanco et al. Title Page Abstract Introduction Conclusions References Tables Figures J I J I Back Close Full Screen / Esc
Print Version
Interactive Discussion
c
EGU 2003 20% of the trajectory length for the trajectories used in this study (Stohl, 1998). The
data are provided for six distinct arrival height levels (975, 850, 700, 500, 300, and 200 hPa) and for two arrival times (13:00 UT and 19:00 UT) on a day-by-day basis.
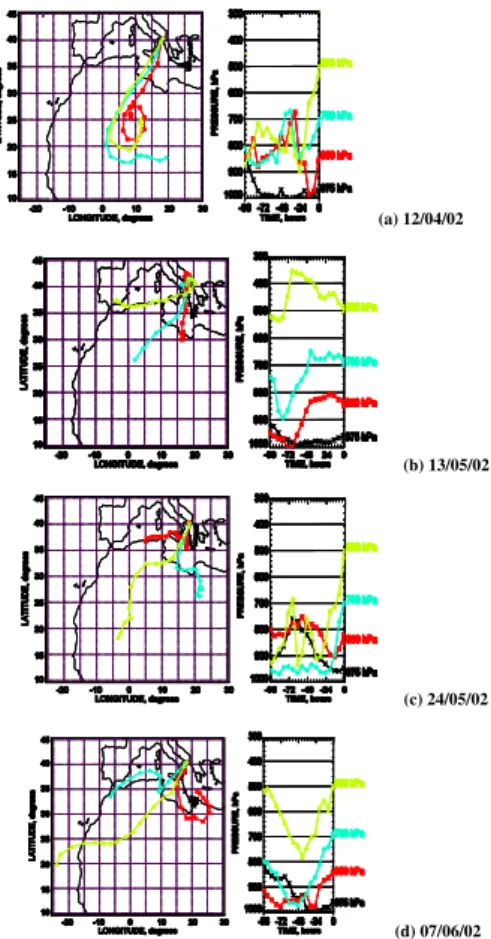
One observes from Fig. 2a that south Algeria and Niger (Source 2) are the source regions of the 850 and 500 hPa arrival-height backtrajectory, respectively whereas the
5
backtrajectory characterized by the arrival height-level of 700 hPa has the origin in Chad (Source 2), following d’Almeida (1986). The height-level versus time of each backtrajectory is shown on the right side of Fig. 2a, and it can be observed that the initial height-level (−96 h) of the 850, 700, and 500 hPa backtrajectory, respectively is close to 850 hPa. A larger dependence of the monitored aerosol properties on source
10
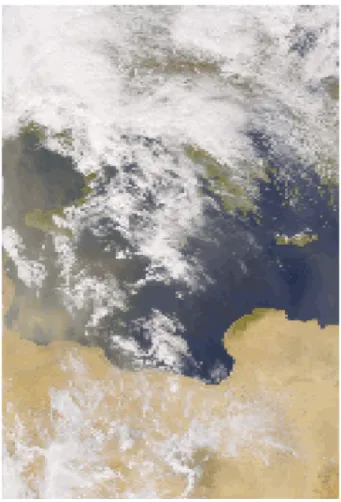
regions is expected when the backtrajectories are characterized by height-levels closer to ground and larger residence times on the source area. A clear view of suspended Sahara dust particles over the Mediterranean Sea on 11 April is given by the true color image (Fig. 3) provided by the Sea-viewing Wide Field-of-view Sensor (SeaWiFS) that is carried by the SeaStar spacecraft on the NASA Earth Observing System AM platform
15
(Hooker et al., 1992). The aerosol index (AI) product provided by the Earth-Probe Total Ozone Mapping Spectrometer (EP/TOMS) also represents an ideal tool to monitor intensity and pathway of desert dust on a 24-hours basis (Herman et al., 1997). The AI product depends on the relative concentration of UV absorbing (smoke and dust) tropospheric aerosol particles and varies between 0 and 4 over land and water. From
20
the TOMS data of 12 April one gets that the AI product varies between 1.2–2.2 over the south-eastern cost of Italy (http://toms.gsfc.nasa.gov/aerosols/aerosols.html).
Dust samples have also been collected on 13 May, the last day of the dust outbreak over the Mediterranean Sea started on 7 May. Figure 2b shows the analytical back trajectories of 13 May at 13:00 UT and one observes that south Algeria (Source 2) and
25
north Lybia (Source 3) are the source regions of the 850 and 700 hPa arrival-height backtrajectory, respectively. The AI product varies on 13 May between 1.2–1.7 over the southeast cost of Italy.
ACPD
3, 4633–4670, 2003Characterization of African dust over
southern Italy A. Blanco et al. Title Page Abstract Introduction Conclusions References Tables Figures J I J I Back Close Full Screen / Esc
Print Version
Interactive Discussion
c
EGU 2003 collected on 24 May. Figure 2c shows the back trajectories of 24 May at 13:00 UT.
Following d’Almeida (1986), the 700 and 500 hPa arrival-height backtrajectories have the origin on Lybia and south Mauritania, respectively. AI product values ranging from 0.7 to 1.7 are provided on 24 May by TOMS over the south-east Mediterranean Sea. The presence of dust over the southeast Mediterranean Sea is also revealed by the
5
true color SeaWiFS image of 24 May.
Finally, some dust samples have been collected on 7 June. This last dust event has lasted from 5–10 June. The backtrajectories of 7 June at 13:00 UT are shown on Fig. 2d, and one observes that the 850 hPa-backtrajectory has the origin on the Mediterranean Sea but, it crosses Lybia (Source 3) at quite low height levels before
10
arriving to Lecce. Morocco (Source 1) is the origin region of the 700 hPa-backtrajectory and it is worth noting that this last backtrajectory crosses the Mediterranean Sea at quite low height levels before getting to Lecce. The SeaWiFS true color image of 7 June clearly shows the presence of dust over the Mediterranean Sea where AI product values ranging from 0.7 to 2.2 are provided by TOMS.
15
The above reported data clearly show that the dust samples have been collected during strong dust outbreaks occurred over the south-east Mediterranean Sea and that the dust particles from Source 1, 2, and 3, respectively have mainly been advected to Lecce, in accordance to d’Almeida (1986).
4. Results and discussion
20
4.1. Infrared transmission spectroscopy measurements
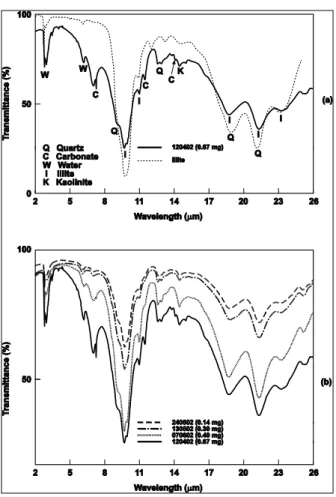
Qualitative information on the major chemical constituents of the dust samples have been obtained by infrared transmission spectroscopy measurements. The results are shown in Figs. 4a and 4b. The solid line in Fig. 4a represents a typical transmittance spectrum of the samples collected on 12 April. Several dust samples have been
an-25
ACPD
3, 4633–4670, 2003Characterization of African dust over
southern Italy A. Blanco et al. Title Page Abstract Introduction Conclusions References Tables Figures J I J I Back Close Full Screen / Esc
Print Version
Interactive Discussion
c
EGU 2003 the sample. A comparison of this spectrum with an infrared spectral library of minerals
(Salisbury et al., 1991), allows us to recognize that the collected dust contains a signif-icant amount of illite (K, H3O)(Al, Mg, Fe)2(Si, Al)4O10[(OH)2, H2O], a mineral classified as a phyllosilicate of the mica group with absorption bands centered around 9.7 µm, 11.0 µm, 18.9 µm, 21.3 µm and 23.5 µm. The transmittance spectrum of illite taken
5
from Salisbury et al. (1991) is also shown in Fig. 4a (dotted line) for comparison. The contribution of some carbonate (C) bands at 7 µm, 11.5 µm and 14 µm, and quartz (Q) bands at 9.3 µm, 12.5 µm, 18.9 µm and 21.3, can also be observed in the transmittance spectrum of Fig. 4a (solid line). The absorption band at 14.4 µm can be ascribed to the presence of kaolinite (K). The strongest absorption bands of kaolinite at 9.3, 18.5, 21.2
10
and 23.2 µm superimpose to the illite ones even if they have a rather different spec-tral structure. The strong features clearly visible in Fig. 4a (solid line) around 2.9 µm and 6.1 µm, can certainly be ascribed to the O-H stretching vibrations and to the H-O-H bending vibrations of water (W), respectively. Typical transmittance spectra of the samples collected on 13 and 24 May, and on 7 June are shown on Fig. 4b besides the
15
spectrum of 12 April. The value of the dust mass embedded in the potassium bromide powder is also reported in brackets for every sample. The uncertainties on dust mass values are lower than 15%. The transmittance spectra of Fig. 4b are characterized by very similar spectral features and lead to consider that all dust samples have sim-ilar chemical composition and therefore contain a significant amount of illite. These
20
results are in satisfactory accordance with those obtained by Avila et al. (1997) by an-alyzing 11-year records of African dust rains in the Montseny mountain (northestern Spain). They have found by analyzing isentropic back trajectories, that Western Sa-hara, Moroccan Atlas, and Central Algeria were the main source regions of the moni-tored dust events, in accordance with Figs. 1 and 2 of this paper. Moreover, they have
25
observed that illite was the most abundant mineral identified in all dust samples by X ray diffraction and that the illite concentration was 41% when the source region was western Sahara, and 34.5% for the air masses coming from central Algeria. They have also shown that the differences in mineralogy between source regions were significant
ACPD
3, 4633–4670, 2003Characterization of African dust over
southern Italy A. Blanco et al. Title Page Abstract Introduction Conclusions References Tables Figures J I J I Back Close Full Screen / Esc
Print Version
Interactive Discussion
c
EGU 2003 for the lower content mineral: smectite (K, H3O)(Al, Mg, Fe)2(Si, Al)4O10[(OH)2, H2O],
kaolinite Al2Si2O5(OH)4, quartz SiO2, and dolomite CaMg(CO3)2. Smectite and kaoli-nite content was highest in the Algerian events, while quartz and dolomite content was lowest. Events from the Moroccan Atlas had the lowest smectite and kaolinite. Guerzoni et al. (1997) by considering the results on the mineralogical composition of
5
Sahara dust samples collected at different Mediterranean sites along several years (1984–1992), have also shown that the Sahara dust samples have generally relatively high concentrations of illite, in accordance with our and Avila et al. (1997) experimental results. The studies of Molinaroli (1996) on the mineralogical characterization of Sa-hara dust with a view to its final destination in the Mediterranean sediments, have also
10
revealed that illite was always more abundant in dust than in sediments. Illite, quartz, and kaolinite were also the main components found by Prodi and Fea (1979) by per-forming X-ray diffraction analysis on dust samples collected in northern Italy on 18 and 19 May 1977. On the contrary, more kaolinite than illite has been found by Chester et al. (1977) in the desert-derived dusts collected in the eastern Mediterranean Sea.
Fi-15
nally, the investigations of Ganor (1991) and of Ganor and Foner (1995) on the mineral composition of eolian dust sampled in Israel and originated from different geograph-ical sources have revealed that the dust storms originated in Chad and Lybia were characterized by a high content of illite (87%), whereas the ones originated in Libyan and Egypt were characterized by high concentrations of smectite (55%) and kaolinite
20
(30%). Sokolik and Toon (1999) have also reported that the dust originating from Ahag-gar Massif (Source 2, Fig. 1) is characterized by a high abundance of illite, while the dust from the Tibesti Mountains (Egyptian, Libyan, and Negev deserts) has moderate concentrations of illite, kaolinite and montmorillonite.
4.2. Measurements of the particle size and roundness factor distribution
25
Scanning electron microscopy and X-ray energy dispersive measurements have been performed for the dust particle-size and shape analysis and to get more data on the elemental composition of the dust samples. The back scattered electron (BSE) image
ACPD
3, 4633–4670, 2003Characterization of African dust over
southern Italy A. Blanco et al. Title Page Abstract Introduction Conclusions References Tables Figures J I J I Back Close Full Screen / Esc
Print Version
Interactive Discussion
c
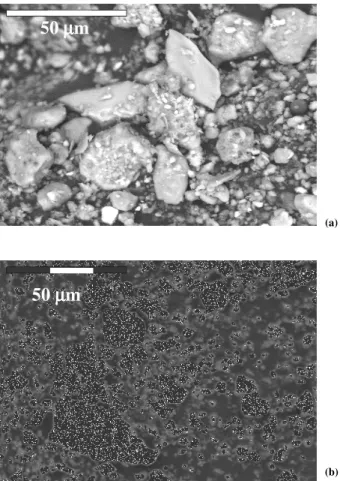
EGU 2003 of the dust particles collected during the dust storm of 12 April and 7 June are shown in
Figs. 5a and 5b, respectively. The particle-size analyses of our samples have revealed the presence of silty clays, particle with diameter up to 4 µm, and clayey silts, particles with diameter larger than 4 µm (Molinaroli et al., 1993). Indeed, dust particles with diameter ranging from 0.3 to 30 µm and maximum concentration at about 2 µm have
5
been measured in all samples. Figure 6a shows as an example the particle distribution of dust samples collected on 12 April (sample 120402) and 24 May (sample 240502), respectively. Measurements of the atmospheric aerosol size distributions are essential in identifying the various processes involved in the formation and evolution of atmo-spheric aerosols (Raes et al., 2000). Figure 6b shows the cumulative grain-size curves
10
as function of the particle radius, of typical samples collected during the investigated dust storms. One observes a similar size distribution with median-diameter values be-tween 1.7–2.4 µm in all samples. Particles with minimum and maximum observed size of 0.08 and 16 µm, respectively have been obtained by Prodi and Fea (1979) from muddy rain samples collected at Sestola and Bologna on 18 and 19 May 1977. Both
15
collection sites are about 1600 km away from the Africa coast. On the contrary, the particle size distribution of two Sahara rain samples collected at a Sardinia station in March 1992 and October 1993, showed modes at 8 µm and 25–50 µm in diameter for the first and a single mode between 20 and 40 m for the second, with a tail towards the finest particles. The Sardinia collection site was about 400 km away from the Africa
20
coast. It appears from the results presented above that the maximum particle diameter reduces as the distance from the dust source area increases. Aerosols are removed from the atmosphere by dry and wet processes and it is well known that large particles (diameter > 1 µm) settle gravitationally: a process which becomes more efficient as the particles size increases (Raes et al., 2000). Hence, the removal of large diameter
par-25
ticles as a consequence of gravitational settling can be responsible of the differences in size distribution of the Sahara rain samples collected at Bologna and Sestola, Lecce, and Sardinia. However, it is worth mentioning that it has been shown by Guerzoni et al. (1997) that the particle size distribution in the Sahara outbreaks exhibits no clear
ACPD
3, 4633–4670, 2003Characterization of African dust over
southern Italy A. Blanco et al. Title Page Abstract Introduction Conclusions References Tables Figures J I J I Back Close Full Screen / Esc
Print Version
Interactive Discussion
c
EGU 2003 relationship between median, or modal particle-size and transport distance. Grain size
fractionation is not a clear function of aerosol sedimentation velocity, and factors other than gravitation and turbulence may play an important role.
The BSE images of Figs. 5a and 5b show that the particles are generally sharp-edged and irregular in shape. It is well known that dust-like aerosols cannot be
as-5
sumed to be spherical (Barnaba and Gobbi, 2001) and that as a consequence, their optical properties can significantly differ from those calculated by means of the Mie theory (Mishchenko et al., 1997). It is therefore of peculiar importance to evaluate the dust particle roundness to better infer their light scattering properties. The roundness factor R (Nazar et al., 1996) has been used for the first time in this paper to evaluate
10
the sharpness of edges and corners of the dust particles and the results are shown on Fig. 7. One observes that all samples show an unimodal roundness factor distribution with the peak at R ≈ 1.25 and with the R values ranging from about 0.8 to 2.5. Elliptical and spherical particles are characterized by R values ranging from 1 to 1.25, whereas
R varies from 1.4 to 2.5 for triangle particles, accordingly to Podczeck et al. (1999). No
15
clear relation has been found between average R value and grain size. 4.3. X-ray energy dispersive measurements
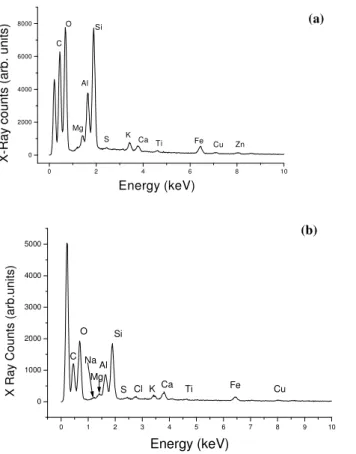
Typical X-ray spectra of the dust samples collected (a) on 12 April and (b) on 7 June are shown in Fig. 8. One observes that the particles contain elements such as Al, Si, Ca, Fe K, Mg, Ti and also Cu and Zn traces. Na and Cl traces have also been
20
found in the 070602 sample (Fig. 8b). Even though, C has been detected, it has not been considered in the data analysis because it represents the major component of the adhesive layer, on which dust has been deposited for SEM analyses. X-ray spectra similar to that of Fig. 8a have been found for all samples collected during the monitored dust events. A semi quantitative analysis of the relative abundance of the different
25
elements with respect to Si has been carried out in all samples (Levin et al., 1979). Table 1 summarizes the X-ray count ratios of the different elements with respect to Si that have been obtained with 200 s counting time. The dust event date (ddmmyy)
ACPD
3, 4633–4670, 2003Characterization of African dust over
southern Italy A. Blanco et al. Title Page Abstract Introduction Conclusions References Tables Figures J I J I Back Close Full Screen / Esc
Print Version
Interactive Discussion
c
EGU 2003 is used to characterize every sample. One observes from Table 1 that the Al/Si ratio
reaches quite high values ranging from 0.41 to 0.5. The Al/Si ratio is considered a good discriminator between desert- and anthropogenic-dominated samples, with high values in the former group and low ones in the latter (Molinaroli et al., 1993). Indeed, Al/Si ratios higher than 0.3 are generally considered indicative of the desert origin of the
5
particles (Guerzoni et al., 1997). It is worth noting that rather low content of S, Cu and Zn has been observed in all samples and further X-Ray mapping was not able to dot any particle containing the last two element. One also observes from Table 1 that the Element/Si ratios have similar distribution in all analyzed dust samples in accordance with infrared transmission spectroscopy measurements that have lead to consider that
10
all samples have similar chemical composition. The results of Table 1 are also in good accordance with the ones reported by Molinaroli et al. (1993) for the desert-dominated sample.
It is worth observing from Table 1 that the samples with larger K/Si ratio have larger Fe/Si and Mg/Si ratios, whereas the samples with larger Ca/Si have lower K/Si, Fe/Si
15
and Mg/Si ratio. To better understand the observed trends of some element/Si ratios, and to evaluate whether the composition of the dust sampled at Lecce differs according to the origin, we have computed for all samples the Ca/Al, Fe/Ca, K/Ca, and Si/Al ra-tios, since the differences in mineralogy between source regions can be significant for smectite (K, H3O)(Al, Mg, Fe)2(Si, Al)4O10[(OH)2, H2O], kaolinite Al2Si2O5(OH)4,
20
quartz SiO2, and dolomite CaMg(CO3)2, according to Avila et al. (1997). The results summarized in Table 2 show that larger Si/Al and Ca/Al ratios have been found for the dust storms of 13 May and 7 June. Larger Si/Al and Ca/Al ratios can be ascribed to dust samples with a larger content of quartz, calcite, and dolomite according to Avila et al. (1997). To this end, it is also worth observing that Avila et al. (1997) have found
25
the largest percentage of dolomite, calcite, and quartz in dust coming from Moroccan Atlas. The backtrajectories shown in Fig. 2 reveal that dust coming from Morocco has been collected at Lecce only on 7 June, and Table 2 shows that the largest Si/Al and Ca/Al ratios have been found for the dust collected on 7 June, in accordance to Avila et
ACPD
3, 4633–4670, 2003Characterization of African dust over
southern Italy A. Blanco et al. Title Page Abstract Introduction Conclusions References Tables Figures J I J I Back Close Full Screen / Esc
Print Version
Interactive Discussion
c
EGU 2003 al. (1997) results. Table 2 also shows that lower Si/Al ratios and larger Fe/Ca and K/Ca
ratios have been found in dust samples collected on 24 May and 12 April. These last ratio values can be ascribed to dust samples with a larger content of illite, smectite, and kaolinite, which are the major components of dust coming from central Algeria, accord-ing to Avila et al. (1997). The studies of Ganor (1991) and of Ganor and Foner (1995)
5
on the mineral composition of eolian dust sampled in Israel have also revealed that the dust storms originated in Chad and Lybia were characterized by a high content of illite, kaolinite, and smectite. To this end, it is worth observing from Fig. 2 that Chad, Niger, Algeria and Libya are the main source regions of the dust events of 12 April and May 24. In particular, it is worth noting that on 24 May, the 700 hPa backtrajectory
10
crosses Libya at height levels of about 950 hPa, before arriving to Lecce. In conclu-sion, Tables 1 and 2, and Fig. 2 shows that dust samples with larger Ca/Al and Si/Al ratios and lower Fe/Ca and K/Ca ratios, and therefore with a larger content of quartz, calcite, and dolomite (Avila et al., 1997), have been collected along dust events with a source region in northwestern Sahara. On the contrary, the samples collected along
15
dust events with the origin mainly in Chad, Niger, Algeria and Lybia were characterized by larger Fe/Ca and K/Ca ratios for the larger content of smectite and kaolinite (Avila et al., 1997). A similar trend has also been observed by Chiapello et al. (1997) at Sal Island on the basis of 3 years of daily measurements of mineral dust concentrations, by Bergametti et al. (1989b) in the Canary Islands, and by Bergametti et al. (1989a) in
20
Corsica. However, different Ca/Al, Fe/Ca, K/Ca, and Si/Al values have been found at the different observation sites. In fact, the ratio between two selected elements can be affected by gravitational settling and/or other processes such as turbulence (Guerzoni et al., 1997). A clear variation of the Al/Si ratios with particle size has been found by Coude-Gaussen et al. (1987) at Fuerteventura Island by collecting African dust with a
25
ACPD
3, 4633–4670, 2003Characterization of African dust over
southern Italy A. Blanco et al. Title Page Abstract Introduction Conclusions References Tables Figures J I J I Back Close Full Screen / Esc
Print Version
Interactive Discussion
c
EGU 2003 4.4. Results from the BES dotted images
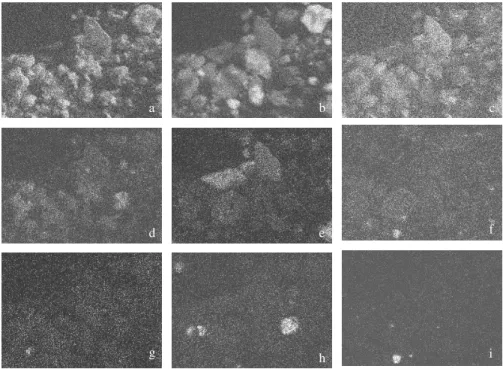
Selected elements (O, Si, Al, Mg, K, Fe, S, Ca, and Ti) have finally been dotted on the BSE image of each analyzed dust sample. This method allows getting the spatial distribution of different elements in the sample and in single particles and can allow inferring the chemical composition of each particle, and to know about its
morpholog-5
ical features (Feret diameter and roundness factor). Figures 9a–9i and 10a–10i show as an example the dotted images obtained from the BSE image of Figs. 5a and 5b, respectively. The white dots in Figs. 9a–9i and Figs. 10a–10i show the sites on the BSE image where (a) O, (b) Si, (c) Al, (d) Mg, (e) K, (f) Fe, (g) S, (h) Ca, and (i) Ti has been detected, respectively. Oxigen has obviously been found in all particles. One
10
also observes from Figs. 9 and 10 that some elements are always present together. Al, Mg and K have almost always been found in particles containing Si. This result further more allows recognizing that the collected dust contain illite and/or smectite. Fe, when it is present, has often been found together with at least one of the main elements (Al, Mg, K and Si) and it has been found combined with O only in a very little percentage of
15
particles, varying from 0.6% to 2.3% in the different samples. In fact, only a few studies reported hematite (a major source of light absorption) in Sahara dust samples along with the most observed minerals as illite, quartz, smectite, kaolite, calcite and dolomite (Sokolik and Toon, 1999; Guerzoni et al., 1997). K that has always been observed with Si, has not been found with Ca. On the contrary, S has always been found in particles
20
containing Ca. This last result suggests the presence of gypsum on the collected dust. Finally, Fig. 9 reveals that the particle on the right side of Fig. 9h that is characterized by a high content of Ca, is also made of Mg (Fig. 9d) and O (Fig. 9a), and hence it can be a particle of dolomite (CaMg(CO3)2). Figure 10 lead also to consider that the particle on the right side of Fig. 10h is made of dolomite. The dotted BSE images have
25
then been used to find out the percentage of particles containing both Ca and Mg in the investigated dust samples. The results are reported in Table 3 and show that the dust sample of 7 June has the largest percentage (2.3%) of particles containing Ca and
ACPD
3, 4633–4670, 2003Characterization of African dust over
southern Italy A. Blanco et al. Title Page Abstract Introduction Conclusions References Tables Figures J I J I Back Close Full Screen / Esc
Print Version
Interactive Discussion
c
EGU 2003 Mg. The main source regions of this dust event (Fig. 2d) are Morocco (700 hPa-arrival
height backtrajectory) and north Libya (850 hPa). On the contrary, the percentage of particles containing Ca and Mg is lowest (0.7%) for the dust sample of April 12th whose backtrajectories (Fig. 2a) have the origin in Chad (700 hPa), Niger (500 hPa) and Al-geria (850 hPa). These last results are in good accordance with those of the previous
5
paragraph and show further more that the differences in mineralogy between source regions are significant for the lower content mineral: smectite, kaolinite, quartz, and dolomite (Avila et al., 1997).
The dotted maps have then been used to find out the particle percentage containing a given element for every element of the dust samples. Results are shown in Fig. 11
10
and it is worth observing that the percentage of particles containing a given element varies from sample to sample, even though the percentage of particles containing Al, Si, K, Mg, and Fe is rather similar among the samples. The presence of particles containing Cl revealed by Fig. 11 for the dust sample of 7 June, besides the presence of Na and Cl revealed by the X-ray spectrum of Fig. 8b, leads to infer the presence of
15
NaCl particles from the sea in the 070602 sample. This conclusion is also supported by Fig. 1d showing that most of the 700 hPa back trajectory pathway is performed on the Mediterranean Sea at low height levels.
It is interesting to note from Fig. 11 that a decreasing in the particle percentage containing Ca is accompanied by the absence of particles containing S particles. In
20
fact, particles containing S have not been observed in the 240502 and 120402 sample: both samples are characterized by the lowest percentage of Ca-particles. This result leads to consider once again that the presence of S revealed in the 070602 and 130502 samples, is probably associated with Ca.
Finally, the size distribution of particles containing a given element has been
deter-25
mined for every element of the dust samples and it has been found that every element size-particle distribution follows the corresponding overall particle distribution. Fig-ure 12 shows as example the size distribution of Al-containing particles in the 120402 and 240502 sample. Al has been chosen as one the most representative elements of
ACPD
3, 4633–4670, 2003Characterization of African dust over
southern Italy A. Blanco et al. Title Page Abstract Introduction Conclusions References Tables Figures J I J I Back Close Full Screen / Esc
Print Version
Interactive Discussion
c
EGU 2003 Saharan dust. It can be observed from Fig. 12 that the Al-particle distribution follows
the overall particle distribution (Fig. 6a) with a peak concentration at about 1.5 µm in both samples.
5. Summary and conclusion
Water-insoluble components of Saharan dust samples from rainfall residues have for
5
the first time been collected at a rural site, in the south-eastern corner of Italy during Saharan dust storm events, and have been characterized by SEM, X-ray microanal-ysis, and infrared spectroscopy measurements. Four-day analytical back trajectories, SeaWiFS true color images and aerosol index product values provided by TOMS have been used to support the Sahara origin of the investigated dust samples. Detailed
10
information on the elemental composition, size and shape distribution of the dust par-ticles has been provided by the X-ray map single particle analysis. Qualitative results on the major chemical constituents of the dust samples have been obtained by infrared transmission spectroscopy measurements. The different analyses performed on the dust samples have provided results in satisfactory accordance and have demonstrated
15
that the Saharan dust particles of different rainfall events were characterized by sim-ilar elemental composition. These results are in good agreement with the fact that the back trajectories of the investigated dust storms (Fig. 2) have the source regions mainly on central and western Sahara. Dust particles with diameter ranging from 0.3 to 30 µm and maximum concentration at about 2 µm have been observed in all
sam-20
ples (Figs. 6a and 6b). The rain samples collected at Sestola and Bologna (Prodi and Fea, 1979), and in south Sardinia (Guerzoni et al., 1997) were characterized by par-ticle distributions with maximum concentration at about 0.1–0.24 µm and 20–40 µm, respectively. The removal of large diameter particles as a consequence of gravitational settling has been considered responsible of the differences in size distribution of the
25
rain samples collected at Sestola and Bologna, Lecce and Sardinia. The dust particle roundness factor has for the first time been reported in this paper and it has been found
ACPD
3, 4633–4670, 2003Characterization of African dust over
southern Italy A. Blanco et al. Title Page Abstract Introduction Conclusions References Tables Figures J I J I Back Close Full Screen / Esc
Print Version
Interactive Discussion
c
EGU 2003 that it takes values ranging from about 0.8 to 2.5 with the peak at R ≈ 1.25 in all
sam-ples (Fig. 7). This parameter is of peculiar importance to evaluate the light scattering properties of the dust particles (Mishchenko et al., 1997).
Infrared spectroscopy measurements have revealed that the transmittance spectra were characterized by very similar spectral features in all samples. Strong absorption
5
bands in the 9–11 µm and 18–26 µm spectral ranges have been observed in all sam-ples. Let us mention that the strong absorption bands in the 8–12 µm atmospheric window leads to an increase of the green-house effect in the thermal infrared. A com-parison of the dust transmittance spectra with an infrared spectral library of minerals has also allowed us to recognize that the collected dust contained a significant amount
10
of illite in all samples. This last conclusion supported by the EDX measurements and the dotted BSE image analysis, is in satisfactory accordance with the results reported by Prodi and Fea (1979), Guerzoni et al. (1997), Avila et al. (1997), and Chiapello et al. (1997). Therefore, the results of this paper besides the ones reported in the above mentioned references show that dust particles with a high content of illite are mainly
15
advected over the Mediteranean basin during dust storm events. The EDX measure-ments have revealed once more that Al/Si ratios higher than 0.4 are always indicative of the desert origin of the particles. On the contrary, Ca/Al, K/Ca, Fe/ Ca and Si/Al ratios have allowed us to infer that the smectite and kaolinite amount is higher in the south and central Sahara events, in accordance with literature data. Tables 1, 2, and
20
3, and Fig. 2 have also revealed that dust samples with larger Ca/Al and Si/Al ratios and lower Fe/Ca and K/Ca ratios, and therefore with a larger content of quartz, calcite, and dolomite (Avila et alt., 1997), have been collected along dust events with a source region in northwestern Sahara. Hence, these last results show further more that the differences in mineralogy between source regions are significant for the lower content
25
minerals: smectite, kaolinite, quartz, and dolomite in accordance to Avila et al. (1997). It has also been mentioned that different Ca/Al, Fe/Ca, K/Ca, and Si/Al ratios may be found at different collection sites. In fact, the ratio between two selected elements is dependent on the particle size distribution (Coude-Gaussen et al., 1987) and therefore
ACPD
3, 4633–4670, 2003Characterization of African dust over
southern Italy A. Blanco et al. Title Page Abstract Introduction Conclusions References Tables Figures J I J I Back Close Full Screen / Esc
Print Version
Interactive Discussion
c
EGU 2003 can be affected by gravitational settling processes.
We believe that the results reported in this paper provide further data on the de-pendence of the particle properties on source regions and on the geographical site where have been collected, and may be useful to the scientific community since they contribute to document and understand the interaction of mineral aerosols with the
5
environment.
Acknowledgements. This work has partially been supported by the EARLINET Project,
En-vironment Program of the European Union, under the contract No. EVR1-CT1999-40003. A. Tafuro has carried out this work with the support of a contract provided by the EARLINET Project. The air-mass back trajectories analysis was performed by the German Weather
Ser-10
vice, by using the Interactive Data Analysis (IDL) code provided by I. Mattis (Institut fur Tro-pospharenforschung, leipzig, Germany). The radiosounding data of the Meteorological Station
of Brindisi (Italy) have been provided by NOAA (http://raob.fsl.noaa.gov). The TOMS data have
been made available by NASA (http://toms.gsfc.nasa.gov/aerosols/aerosols.html). The authors
would like to thank the SeaWiFS Project (Code 970.2) and the Goddard Earth Sciences Data
15
and Information Services Center/Distributed Active Archive Center (Code 902) at the Goddard Space Flight Center, Greenbelt, MD 20771, for the production and distribution of these data, respectively. These activities are sponsored by NASA’s Earth Science Enterprise.
References
Alpert. P., Neeman, B. U., and Shay-el, Y.: Climatological analysis of the Mediterranean
cy-20
clones using ECMWF data, Tellus, 42A, 65–77, 1990.
Avila, A.: I. Queralt-Mitjans and M. Alarc `on: Mineralogical composition of African dust delivered by red rains over the northeastern Spain, J. Geophys. Res, 102, 21 977–21 996, 1997. Barnaba, F. and Gobbi, G. P.: Lidar estimation of tropospheric aerosol extinction, surface area
and volume: Maritime and desert-dust cases, J. Geophys. Res., 106, 3005–3018, 2001.
25
Bergametti, G., Dutot, L., Buat-Menard, P., and Remoudaki, E.: Seasonal variability of the el-emental composition of atmospheric aerosol particles over the northwestern Mediterranean, Tellus, 41B, 553–561, 1989a.
ACPD
3, 4633–4670, 2003Characterization of African dust over
southern Italy A. Blanco et al. Title Page Abstract Introduction Conclusions References Tables Figures J I J I Back Close Full Screen / Esc
Print Version
Interactive Discussion
c
EGU 2003
Bergametti, G., Gomes, L., Remoudaki, E., Desbois, M., Martin, D., and Buat-Menard, P.: Present-day transport and deposition patterns of African dust to the nortwestern Mediter-ranean. In Paleoclimatology and paleometeorology: modern and past patterns of global at-mospheric transport, eds. M. Leinen and M. Sarnthein, 227–252, KLuwer, Dordrecht, 1989b. Chester, R., Baxter, G. G., Behairy, A. K. A., Connor, K., Cross, D., Elderfield, H., and Padgham,
5
R. C.: Soil-sized aeolian dust from the lower troposphere of eastern Mediterranean Sea, Marine Geology, 24, 201–217, 1977.
Chester, R., Nimmo, M., Alarcon, M., and Corcoran, P.: The chemical character of the western Mediterranean aerosol, Water Pollution Research Reports, 28, 495–504, 1992.
Chiapello, I., Bergametti, G., Chatenet, B., Bousquet, P., Dulac, F., and Santos Soares, E.:
10
Origin of African dust transported over the northeastern tropical Atlantic, J. Geophys. Res, 102, 13 701–13 709, 1997.
Coude-Gaussen G., Rognon, P., Bergametti, G., Gomes, L., Strauss, B., Gros, J. M., and Le Coustumer, M. N.: Saharan dust on Fuerteventura Island (Canaries): chemical and miner-alogical characteristics, air mass trajectories, and probable sources, J. Geophys. Res., 92,
15
9753–9771, 1987.
d’Almeida, G. A.: A model for Saharan dust transport, Journal of Climate and Applied Meteo-rology, 25, 903–916, 1986.
Ganor, E.: The composition of clay minerals transported to Israel as indicators of Saharan dust emission, Atmosph. Environm., 25A, 12, 2657–2664, 1991.
20
Ganor, E. and Foner, H. A.: The Mineralogical and Chemical Properties and the Behavior of Aeolian Saharan Dust over Israel, in The Impact of Desert Dust Across the Mediterranean, Oristano 4–7 October, 24 (abs), 1995.
Gobbi, G. P., Barnaba, F., Van Dingenen, R., Putaud, J. P., Mircea, M., and Facchini, M. C.: Li-dar and in situ observations of continental and Saharan aerosol: closure analysis of particles
25
optical and physical properties, Atmos. Chem. Phys. Discuss., 3, 445–477, 2003.
Goldstein, J. I. and Yakowitz, H.: Practical scanning electron microscopy, Plenum Press New York, 1975.
Guerzoni, S., Molinaroli, E., and Chester, R.: Saharan dust inputs to the western Mediterranean Sea: depositional patterns, geochemistry and sedimentological implications, Deep-Sea
Re-30
search II, 44, 3–4, 631–654, 1997.
Herman, J. R., Bhartia, P. K., Torres, O., Hsu, C., Seftor, C., and Celarier, E.: Global distribution of UV-absorbing aerosols from Nimbus 7/TOMS data, J. Geophys. Res., 102, 16 911–16 922,
ACPD
3, 4633–4670, 2003Characterization of African dust over
southern Italy A. Blanco et al. Title Page Abstract Introduction Conclusions References Tables Figures J I J I Back Close Full Screen / Esc
Print Version
Interactive Discussion
c
EGU 2003
1997.
Hooker, S. B., Esaias, W., Feldman, G., Gregg, W., and McClain, C. R.: “An overview of the SeaWiFs and ocean color,” Vol. 1 of SeaWiFS Technical Report Series, NASA Tech. Memo. 104566, NASA Goddard Space Center, Greenbelt, Md., 1992.
Kottmeier, C. and Fay, B.: Trajectories in the antartic lower troposphere, J. Geophys. Res., 105,
5
10 947–10 959, 1998.
IPCC (Intergovernmental Panel on Climate Change): Climate Change 2001. The scientific ba-sis. Eds. J. T. Houghton, Y. Ding, M. Nogua, D. Griggs, P. Vander Linden, K. Maskell, Cam-bridge Univ. Press, CamCam-bridge, UK and New York, NY, USA, 2001.
Levin, Z. and Lindberg, J. D.: Size distribution, chemical composition and optical properties of
10
urban and desert aerosols in Israel, J. Geophys. Res., 84, 6941–6950, 1979.
Levin, Z., Joseph, J. H., and Mekler, Y.: Properties of Sharav (Khamsin) dust – comparison of optical and direct sampling data, J. Atmosph. Sci., 37, 882–891, 1980.
Ma, C. J., Kasahara, M., Holler, R., and Kamiya, T.: Characteristics of single particles sampled in Japan during the Asian dust-storm period, Atmosph. Environm., 35, 2707–2714, 2001.
15
Mattis, I., Ansmann, A., Muller, D., Wandinger, U., and Althausen, D.: Dual-wavelength Raman lidar observations of the extinction-to-backscatter ratio of Saharan dust, Geophys. Res. Lett., 29, No. 9, 20.1–20.4, 2002.
Mishchenko, M. I., Travis, L. D., Kahn, R. A., and West, R. A.: Modeling phase functions for dustlike tropospheric aerosols using a shape mixture of randomly oriented polydisperse
20
spheroids, J. Geophys. Res., 102, 16 831–16 847, 1997.
Molinaroli, E.: Mineralogical characterization of Saharan dust with a view to its final destination in Mediterranean sediments, in “The Impact of Desert Dust Across the Mediterranean”, S. Guerzoni and R. Chester (eds.), Kluwer Academic Publishers, printed in the Netherlands, 153–162, 1996.
25
Molinaroli, E., Guerzoni, S., and Rampazzo, G.: Contribution of Saharan dust to the central Mediterranean basin, Geological Society of America, Special paper 284, 1993.
Nazar, A. M., Silva, F. A., and Amman, J. J.: Image processing for particle characterization, Materials Characterization, 36, 165–173, 1996.
Paoletti, L., De Bernardis, B., and Diociaiuti, D.: Physico-chemical characterization of the
in-30
hable particulate matter (PM10) in an urban area: an analysis of the seasonal trend, The Science of the Total Environment, 292, 265–275, 2002.
ACPD
3, 4633–4670, 2003Characterization of African dust over
southern Italy A. Blanco et al. Title Page Abstract Introduction Conclusions References Tables Figures J I J I Back Close Full Screen / Esc
Print Version
Interactive Discussion
c
EGU 2003
assess the shape of pellets using image analysis, Intern. Journal of Pharmaceutics, 192, 123–138, 1999.
Prodi, F. and Fea, G.: A case of transport and deposition of Sahara dust over the Italian Penin-sula and Southern Europe, J. Geophys. Res., 84C, 6951–6960, 1979.
Prospero, J. M.: Arid regions as sources of mineral aerosols in the marine atmosphere,
Geo-5
logical Society of America, SP 186, 71–85, 1981.
Prospero, J. M.: Long-term measurements of the transport of African mineral dust to the south-eastern United States: Implications for regional air quality, J. Geophys. Res., 104, 15 917– 15 927, 1999.
Raes F., Van Dingenen, R., Vignati, E., Wilson, J., Putaud, J. P., Seinfeld, J. H., and Adams,
10
P.: Formation and cycling of aerosols in the global troposphere, Atmosph. Environm., 34, 4215–4240, 2000.
Ro, C. U., Oh, R. Y., Kim, H. K., Chun, Y., Osan, J., de Hoog, J., and Van Grieken, R.: Chem-ical speciation of individual atmospheric particles using low-Z electron probe X-ray micro-analysis: characterizing “Asian Dust” deposited with rainwater in Seoul, Korea, Atmosph.
15
Environm., 35, 4995–5005, 2001.
Salisbury, J. W., Walter, L. S., Vergo, N., and D’Aria, D. M.: Infrared (2.1–25 mum) Spectra of Minerals, John Hopkins University Press, Baltimore/London, 1991.
Sokolik, I. N. and Toon, O. B.: Incorporation of mineralogical composition into models of the radiative properties of mineral aerosol from UV to IR wavelength, J. Geophys. Res., 104,
20
9423–9444, 1999.
Stohl, A.: Computation, accuracy and application of trajectories – a review and bibliography, Atmosph. Environm., 32, 947–966, 1998.
Talbot, R. W., Harriss, C., Browell, E. V., Gregory, G. L., Sebacher, D. I., and Beck, S. M.: Distribution and geochemistry of aerosols in the tropical North Atlantic troposphere: Relation
25
to Saharan dust, J. Geophys. Res., 91, 5173–5182, 1986.
Tegen, I. and Fung, I.: Contribution to the atmospheric mineral aerosol load from land surface modification, J. Geophys. Res., 100, 18707–18726, 1995.
ACPD
3, 4633–4670, 2003Characterization of African dust over
southern Italy A. Blanco et al. Title Page Abstract Introduction Conclusions References Tables Figures J I J I Back Close Full Screen / Esc
Print Version
Interactive Discussion
c
EGU 2003 Table 1. Element/Si ratios of the collected dust samples
Element 240502 120402 130502 070602 O/Si 0.76 0.79 0.87 0.70 Mg/Si 0.16 0.16 0.16 0.13 Al/Si 0.50 0.48 0.45 0.41 Si/Si 1 1 1 1 S/Si 0.09 0.08 0.13 0.09 K/Si 0.15 0.14 0.15 0.11 Ca/Si 0.10 0.11 0.12 0.15 Ti/Si 0.07 0.06 0.07 0.06 Fe/Si 0.11 0.11 0.10 0.09 Cu/Si 0.04 0.04 0.05 0.04 Zn/Si 0.03 0.03 0.04 0.03
ACPD
3, 4633–4670, 2003Characterization of African dust over
southern Italy A. Blanco et al. Title Page Abstract Introduction Conclusions References Tables Figures J I J I Back Close Full Screen / Esc
Print Version
Interactive Discussion
c
EGU 2003 Table 2. Ratios between two elements of the collected dust samples
Element 240502 120402 130502 070602
Ca/Al 0.20 0.23 0.27 0.37
Fe/Ca 1.10 1.00 0.83 0.60
K/Ca 1.50 1.27 1.25 0.73
ACPD
3, 4633–4670, 2003Characterization of African dust over
southern Italy A. Blanco et al. Title Page Abstract Introduction Conclusions References Tables Figures J I J I Back Close Full Screen / Esc
Print Version
Interactive Discussion
c
EGU 2003 Table 3. Percentage of particles containing both Ca and Mg in the investigated dust samples
240502 120402 130502 070602
ACPD
3, 4633–4670, 2003Characterization of African dust over
southern Italy A. Blanco et al. Title Page Abstract Introduction Conclusions References Tables Figures J I J I Back Close Full Screen / Esc
Print Version Interactive Discussion c EGU 2003 0 1000 km 15°N 20°W 0° 20°E 40°E 35°N 55°N 1 2 3 4
Figure 1. The map shows the location of the collection site (full dot). Shared areas 1 to 4 represent the most productive sources of Saharan dust (from d’Almeida, 1986). Source 1: Morocco to north Mauritania; source 2: south Algeria, Mali and Niger; source 3: south Libya and Chad; source 4: Egypt and north Sudan. Arrows indicate the main routes of dust outbreaks toward the Mediterranean sea and continental Europe.
Fig. 1. The map shows the location of the collection site (full dot). Shared areas 1 to 4 represent
the most productive sources of Saharan dust (from d’Almeida, 1986). Source 1: Morocco to north Mauritania; source 2: south Algeria, Mali and Niger; source 3: south Libya and Chad; source 4: Egypt and north Sudan. Arrows indicate the main routes of dust outbreaks toward the Mediterranean sea and continental Europe (from Molinaroli, 1986).
ACPD
3, 4633–4670, 2003Characterization of African dust over
southern Italy A. Blanco et al. Title Page Abstract Introduction Conclusions References Tables Figures J I J I Back Close Full Screen / Esc
Print Version Interactive Discussion c EGU 2003 (a) 12/04/02 (b) 13/05/02 (c) 24/05/02 (d) 07/06/02
Figure 2. Four-day analytical back trajectories for the 13:00 UT arrival time and for the 975, 850, 700, and 500 hPa arrival height.
Fig. 2. Four-day analytical back trajectories for the 13:00 UT arrival time and for the 975, 850,
ACPD
3, 4633–4670, 2003Characterization of African dust over
southern Italy A. Blanco et al. Title Page Abstract Introduction Conclusions References Tables Figures J I J I Back Close Full Screen / Esc
Print Version
Interactive Discussion
c
EGU 2003
.
Figure 3. SeaWiFS image taken on April, 11th, 2002 over the Mediterranean Sea and Southern Italy
Fig. 3. SeaWiFS image taken on 11 April, 2002 over the Mediterranean Sea and southern Italy.
ACPD
3, 4633–4670, 2003Characterization of African dust over
southern Italy A. Blanco et al. Title Page Abstract Introduction Conclusions References Tables Figures J I J I Back Close Full Screen / Esc
Print Version
Interactive Discussion
c
EGU 2003
Figure 4. Infrared potassium bromide transmission spectra of dust samples that have been collected at Lecce: (a) during the dust event of April 12th (solid line), the dotted line is the transmission spectrum of illite taken from Salisbury et al. (1991); (b) during all dust events of May 24th , May 13, June 7 and April 12. The value of the dust mass embedded in the potassium bromide is also reported in brackets.
Fig. 4. Infrared potassium bromide transmission spectra of dust samples that have been
col-lected at Lecce:(a) during the dust event of 12 April (solid line), the dotted line is the
transmis-sion spectrum of illite taken from Salisbury et al. (1991);(b) during all dust events of 24 May,
13 May, 7 June and 12 April. The value of the dust mass embedded in the potassium bromide is also reported in brackets.
ACPD
3, 4633–4670, 2003Characterization of African dust over
southern Italy A. Blanco et al. Title Page Abstract Introduction Conclusions References Tables Figures J I J I Back Close Full Screen / Esc
Print Version Interactive Discussion c EGU 2003 (a) (b)
Figure 5. Illustrative backscattered electron (BSE) image of the particles collected during the dust storm of (a) April 12th and (b) June 7th.
50 µµµµm
Ca
Mg
O Ti
50 µµµµm
Fig. 5. Illustrative backscattered electron (BSE) image of the particles collected during the dust
storm of(a) 12 April and (b) 7 June.
ACPD
3, 4633–4670, 2003Characterization of African dust over
southern Italy A. Blanco et al. Title Page Abstract Introduction Conclusions References Tables Figures J I J I Back Close Full Screen / Esc
Print Version Interactive Discussion c EGU 2003 (b) (a) 0.1 1 10 0 50 100 150 200 250 120402 240502 N um be r o f p ar tic le s Radius (µm) 0.1 1 10 0 20 40 60 80 100 130502 070602 240502 120402 C um ul at iv e C ou nt s (% ) Radius (µm)
Figure 6. (a) Tipical size distribution of aerosol particles collected during the dust storm of April 12th and May 24th. (b) Cumulative grain-size curves of the samples collected in the different dust storm events.
Al
Fig. 6. (a) Tipical size distribution of aerosol particles collected during the dust storm of 12
April and 24 May. (b) Cumulative grain-size curves of the samples collected in the different
ACPD
3, 4633–4670, 2003Characterization of African dust over
southern Italy A. Blanco et al. Title Page Abstract Introduction Conclusions References Tables Figures J I J I Back Close Full Screen / Esc
Print Version
Interactive Discussion
c
EGU 2003
Figure 7. Roundness factor distribution of the particles collected in the dust storm
events.
0.5
1.0
1.5
2.0
2.5
0
100
200
300
400
070602 130502 240502 120402N
o
of
P
ar
tic
le
s
Roundness Factor
ACPD
3, 4633–4670, 2003Characterization of African dust over
southern Italy A. Blanco et al. Title Page Abstract Introduction Conclusions References Tables Figures J I J I Back Close Full Screen / Esc
Print Version Interactive Discussion c EGU 2003 0 2 4 6 8 10 0 2000 4000 6000 8000 C S K Ca Ti Fe Cu Zn Si Al Mg O X -R ay c ou nt s (a rb . u ni ts ) Energy (keV) 0 1 2 3 4 5 6 7 8 9 10 0 1000 2000 3000 4000 5000 Ti K Cl S Ca Fe Cu Si Na MgAl O C X R ay C ou nt s (a rb .u ni ts ) Energy (keV)
Figure 8. Typical EDX elemental analysis of the dust samples of (a) 120402 and (b) 070602.
(a)
(b)
ACPD
3, 4633–4670, 2003Characterization of African dust over
southern Italy A. Blanco et al. Title Page Abstract Introduction Conclusions References Tables Figures J I J I Back Close Full Screen / Esc
Print Version Interactive Discussion c EGU 2003 e d a g b i f c h e d a g b i f c h
Figure 9. Elemental X-ray dotted maps obtained from the BSE image of Fig. 5 (a), showing the particles containing: (a) O, (b) Si, (c) Al, (d) Mg, (e) K, (f) Fe, (g) S, (h) Ca and (i) Ti .
Fig. 9. Elemental X-ray dotted maps obtained from the BSE image of Fig. 5 a, showing the
ACPD
3, 4633–4670, 2003Characterization of African dust over
southern Italy A. Blanco et al. Title Page Abstract Introduction Conclusions References Tables Figures J I J I Back Close Full Screen / Esc
Print Version Interactive Discussion c EGU 2003 a b c d e f g h i aa bb cc dd ee ff gg hh ii
Figura 10. Elemental X-ray dotted maps obtained from the BSE image of Fig. 5 (b), showing the
Fig. 10. Elemental X-ray dotted maps obtained from the BSE image of Fig. 5 b, showing the
ACPD
3, 4633–4670, 2003Characterization of African dust over
southern Italy A. Blanco et al. Title Page Abstract Introduction Conclusions References Tables Figures J I J I Back Close Full Screen / Esc
Print Version Interactive Discussion c EGU 2003 1.0 1.5 2.0 2.5 3.0 3.5 4.0 0 20 40 60 80 100 070602 130502 120402 240502 % p ar tic le s Sample Al Ca Cl Fe K Mg S Si Ti
Figure 11. Elemental percentage in the investigated dust samples Fig. 11. Elemental percentage in the investigated dust samples.
ACPD
3, 4633–4670, 2003Characterization of African dust over
southern Italy A. Blanco et al. Title Page Abstract Introduction Conclusions References Tables Figures J I J I Back Close Full Screen / Esc
Print Version Interactive Discussion c EGU 2003 0.1 1 10 0 20 40 60 80 100 120 N um be r o f A l P ar tic le s Radius (µm) 240502 120402
Figure 12. Size distribution of the particles containing Al in the 240502, and 120402 samples.
Fig. 12. Size distribution of the particles containing Al in the 240502, and 120402 samples.