HAL Id: hal-03035003
https://hal.archives-ouvertes.fr/hal-03035003
Submitted on 2 Dec 2020HAL is a multi-disciplinary open access archive for the deposit and dissemination of sci-entific research documents, whether they are pub-lished or not. The documents may come from teaching and research institutions in France or
L’archive ouverte pluridisciplinaire HAL, est destinée au dépôt et à la diffusion de documents scientifiques de niveau recherche, publiés ou non, émanant des établissements d’enseignement et de recherche français ou étrangers, des laboratoires
Notched-beam creep of Douglas fir and white fir in
outdoor conditions: Experimental study
Claude Feldman Pambou Nziengui, Rostand Moutou Pitti, Eric Fournely,
Joseph Gril, Gaël Godi, Samuel Ikogou
To cite this version:
Claude Feldman Pambou Nziengui, Rostand Moutou Pitti, Eric Fournely, Joseph Gril, Gaël Godi, et al.. Notched-beam creep of Douglas fir and white fir in outdoor conditions: Ex-perimental study. Construction and Building Materials, Elsevier, 2019, 196, pp.659-671. �10.1016/j.conbuildmat.2018.11.139�. �hal-03035003�
Notched-beam creep of Douglas fir and white fir in outdoor
conditions: Experimental study.
Claude Feldman PAMBOU NZIENGUIa,b, Rostand MOUTOU PITTIa,c, Eric FOURNELYa, Joseph GRILa, Gaël GODIa, Samuel IKOGOUb
a
Université Clermont Auvergne, CNRS, Institut Pascal, BP 10448, 63000 Clermont-Ferrand, France b
Ecole Nationale des Eaux et Forêts (ENEF), LaReVa Bois, BP 3960, Cap Esterias, Gabon c
CENAREST, IRT, BP 14070, Libreville, Gabon
Abstract: The impact of variations of relative humidity, temperature and moisture content on the
creep of notched beams of Douglas fir and white fir are investigated. Indoor static 4-points bending tests are followed by outdoor creep tests of notched beams designed to trigger the breakage mode associated with the use of notched ends. The dimensions of wood specimens follow Eurocode requirements. The maximum load applied to outdoor creep tests is derived from the failure load obtained during indoor instantaneous tests. The results show that the variations of the relative humidity and temperature, coupled with the loading, play a key role in the lifetime of timber, as they accelerate its aging. In addition, the link between the changes of climatic parameters and the damage of the beams and the limit of their lifetime as structure is shown.
Main notations
CODIFICATION
DF Pseudotsuga menziesii, Douglas fir WF Abies alba Mill., White fir
DFi Beam of species DF WFi Beam of species WF
WF0 Matched beam of WF species
OjDFi Crack opening of side j of beam DFi (mm) OjWFi Crack opening of side j of beam WFi (mm) CjDFi Crack length of side j of beam DFi (mm) CjWFi Crack length of side j of beam WFi (mm)
WFij Coupling of crack length and crack opening of WFi beam on side j DFij Coupling of crack length and crack opening of DFi beam on side j
GEOMETRY
R , Quasi-radial direction
T , Quasi-tangential direction
L , Longitudinal direction of the beam
Li Total length of beam before notching (mm)
L External span of 4-points bending (mm) h Half height of beam (mm)
Distance notch-support (mm) H Beam height (mm) t Beam thickness (mm) t Time PHYSICAL PARAMETERS RH Relative Humidity (%) T Temperature (°C) MC Moisture content (%)
Average beam density (g/cm3)
mb Mass of the beam (kg)
mc Mass of concrete block (kg)
me Mass of equipement (kg)
MÉCHANICAL PARAMETERS
MOE Modulus of elasticity G Shear Modulus (GPa) EC MOE in central zone (GPa)
EU MOE of unnotched beam (GPa)
EN MOE of notched beam (GPa)
EL Predicted longitudinal Young’s modulus (GPa)
q Correcting factor for creep loading F, F Load, load increment (kN)
U, U Deflection, deflection increment (mm) Uin Initial deflection (mm)
Fc, Fmax Load at damage onset, at collapse (kN)
Uc, Umax Deflection at damage onset, at collapse (mm)
Loading ratio (%)
Δr Relative beam deflection
Δmax Relative beam deflection at collapse
CO Crack opening (mm)
1 Introduction
In the building sector over the past 10-15 years wood architecture grew and new wood building systems and design strategies were developed [1]. Worldwide and more specifically in Europe, industries show an increasing interest in wooden structures. The economic and environmental contexts led to the emergence of new markets for green constructions in applications hitherto confined to steel and concrete structures. Improving wood mechanical properties offers many benefits, including lower environmental impact as well as energy savings, resource renewability, fossil fuel reduction and recycling [2]. The use of wood in construction requires the mastery of several physical and mechanical mechanisms that can be limiting factors for timber structures at short or long term. Indeed, the hygroscopic behavior of wood, characterized by sorption, expansion and diffusion processes, sometimes causes crack initiation [3] and propagation and ultimately structural failure [4]. The necessity to solve these problems led to several experimental [5]; analytical [6], [7] or numerical [8] approaches.
According to the literature, wood has specific characteristics, such as sensitivity to water fluctuations, multi-scale heterogeneity and limited strength for loadings perpendicular to the grain which limits its use in structures compared with conventional civil engineering structures[9]. It is well known that changes in air microclimate exert a negative influence on wood-based composites or historical buildings[10], [11]. To investigate these problems, several studies and approaches have been carried out during the last decade. Among them, a thermodynamic approach to sorption hysteresis describes the relationship between the relative humidity, the fee water and the bound water of wood material[12]. The impact of random hygrothermal variation on internal structures and mechanical behavior has been studied by using experimental [13], [14] or stochastic [6], [15] approaches, or by investigating the relationship between climatic variables and wood structures [16]. But none of these works adressed the combined effects of climate changes, creep loading [17], crack occurrence and the durability of timber structures. Indeed, as much as moisture content variations, a limiting factor of the lifetime of structural wood is crack initiation and propagation [4], [10], [18]. Many studies show that crack propagation coupled with moisture changes accelerates wood failure especially under long-term loading [1], [8], [19], [20].
Consequently, investigating the mechanical behavior of wood under combined climatic changes and crack occurrence is important to improve the design of timber structures [21], [22]. Creep tests performed in uncontrolled environment are most appropriate to study the coupled impact of deferred loads and climatic variations, involving a significant contribution of mechanosorption [18]. The current work aims at performing 4-points creep bending test of notched beams in outdoor conditions, in order to observe the combined action of time-dependent loading, climatic variations and crack propagation. Softwood typical of the Auvergne-Rhone-Alpes region in France, Douglas fir and white fir, will be studied, as these species are widely used in the field of civil engineering in France, and abundant in French territory (more than 170 Mm3 for white fir and 93 Mm3 for Douglas fir in 2009[23]).
2 Material and methods
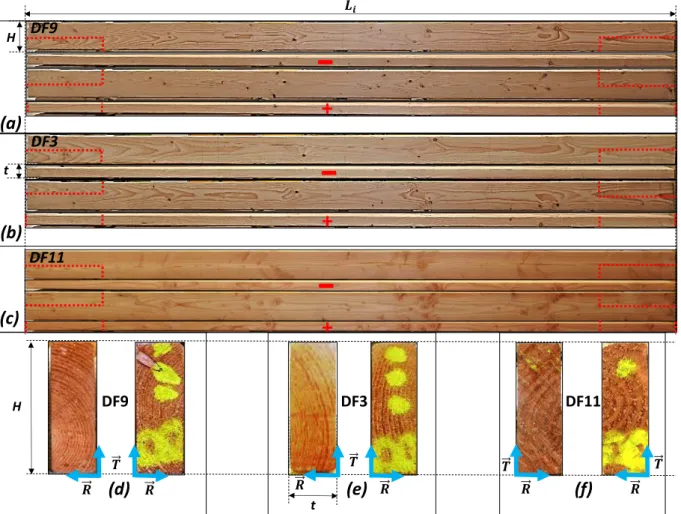
2.1 MaterialTwo species have been studied in this work, Douglas fir (DF, Pseudotsuga menziesi) and white fir (WF, Abies alba Mil). 3 DF and 4 WF beams were selected from 13 beams provided by the inter-professional Association Auvergne Promobois, industrial partner of this project. Fig. 1 and 2 present the external surface of each tested beam, showing the spatial dispositions of the defects on their faces. The general orientation of the radial ( ) and tangential ( ) directions is shown on the cross sections. Table 1 gives the initial characteristics of each beam.
Fig. 1. External surface of Douglas fir (DF) specimens: (a, d) beam DF9; (b, e) beam DF3; (c, f) beam DF11. In the upper images of lateral faces, (-) indicates the upper face loaded in compression, (+) the lower face loaded in tension, the red dotted line the removed part for the fabrication of notched beams; in the lower images of cross sections, radial ( ) and tangential ( ) directions are roughly indicated; t is the beam thickness. (a) (b) (c)
-+
+
+
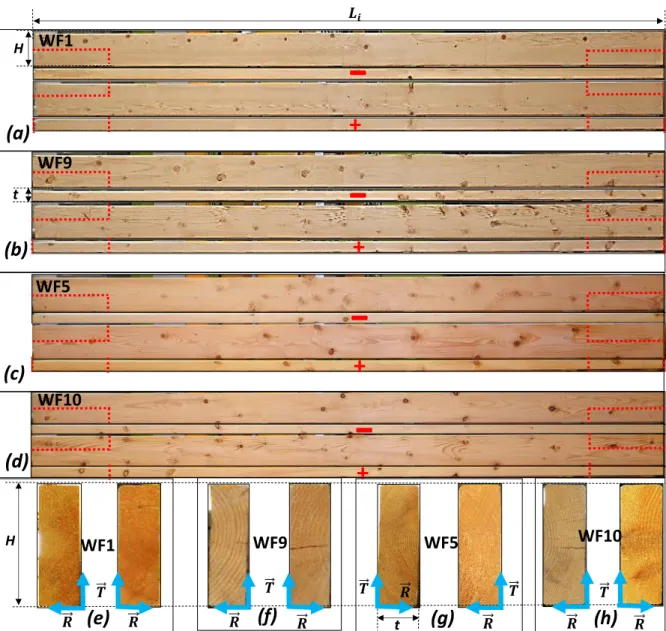
-DF9 DF3 DF11 DF9 DF3 DF11 (d) (e) (f) H t H tFig. 2. External surface of white fir (WF) specimens: (a, e) beam WF1; (b, f) beam WF9; (c, g) beam WF5; (d, h) beam WF10. Legend: see Fig. 1.
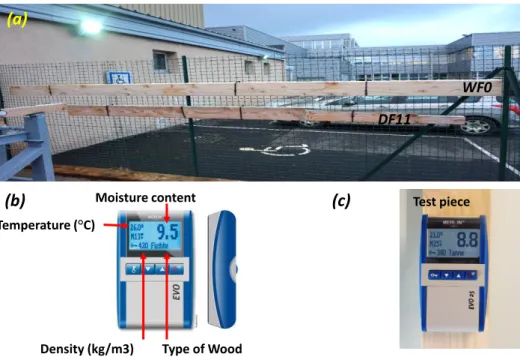
Static tests were performed indoors, at a temperature (T) of 18.2 ± 1.6°C and a relative humidity (RH) of 40.1 ± 5.3 %. Creep tests were performed outdoors, in uncontrolled environment, where the climatic parameters (RH, T) are monitored and provided by neighboring weather station run by the Laboratory of physical meteorology (LAMP) of Université Clermont Auvergne (see Table 4). Moisture content (MC) was recorded daily, manually, on the remains of broken beam DF11 and beam WF0 (Fig. 3a) placed in the same environment as the creep tests. The device used to measure MC is a MERLIN non-destructive moisture meter (Fig. 3b): as soon as the device is put in contact with the surface of the wood (Fig. 3c), the processor analyzes the signal and displays the humidity contained in the beam. This process is carried out over the entire length of the beam and the average of all these measurements is recorded as MC.
(a)
(b)
(c)
(d)
WF1 WF9 WF5 WF10-+
+
+
+
-WF1 WF9 WF5 WF10(e)
(f)
(g)
(h)
H H t tTable 1: Measured characteristics of the beams and calculated parameters for instantaneous and creep tests Beams DF3 DF9 DF11 WF1 WF5 WF9 WF10 WF0 Li (mm) 4054 4056 4053 3999 3996 4002 4002 4002 H (mm) 174 176 178 179 178 179 178 179 t (mm) 59.10 59.40 58.90 60.80 59.90 59.90 60.10 59.96 (g/cm3) 0.52 0.49 0.41 0.41 0.45 0.39 0.38 0.43 MC (%) 12.8 12.4 10.7 10.2 10.6 9.7 9.4 10.4 mb (kg) 23.9 22.9 19.6 19.5 21.1 18.1 17.8 20.2 me (kg) 19.9 20.1 - 19.9 19.9 19.9 - -mc (kg) 414 415 - 326 414 330 - -EC (GPa) 16.93 17.94 8.89 14.23 14.30 9.95 11.76 -EU (GPa) 19.62 17.20 9.16 13.32 14.48 11.65 11.74 -EN (GPa) 15.45 15.53 7.29* 13.32 14.48 11.65 9.91* - (%) 57 60 - 79 90 83 - - Uin 9.94 9.18 - 10.34 13.53 13.26 - - tmax (day) 7 29 - 100 6 104 - - Δmax 1.11 1.34 - 1.96 1.21 2.10 - -
Li: total beam length before machining; H: height; t: thickness; : density; MC: average moisture content
measured by merlin apparatus (during the tests on unnotched beams) ; mb: beam weight; me: equipement
weigth; mc: weight of concrete block; EC: MOE of central area (equation 1 and Fig 4b); EU: MOE of
unnotched beam (equation 2); EN: MOE of notched beam (equation 4) (* measured during tests until collapse
– others deduced from initial deflection in creep test); : load ratio (equation 6); Uin: initial deflection
(80min after creep loading); tmax: duration of creep test until rupture; max: value of relative deflection r
reached at rupture. DF11 (after its collapse in static test) and WF0 are the matched beams used to follow MC evolution during creep tests.
Fig. 3. Monitoring of MC variations: (a) matcheds beams used for the monitoring; (b) and (c) operating principe of the MERLIN non-destructive moisture meter.
Type of Wood Density (kg/m3)
Temperature ( C)
Moisture content Test piece
(b)
(a)
WF0 DF11
2.2 Methods
Table 2 lists the differents tests performed on each beam. Two geometrical specimen configurations will be presented in the following sections. The static tests of the first configuration are performed at a low load, in order to not modify the elastic behavior of the material [7].
Table 2: Experimental plan of tested beams
Beams Maximal load Type of 4-points bending test
Unnotched beams DF specimens DF3 4.59 kN Static DF9 4.90 kN Static DF11 5.19 kN Static WF specimens WF0 - - WF1 4.97 kN Static WF5 5.13 kN Static WF9 5.19 kN Static WF10 5.10 kN Static Notched beams DF specimens DF3 4.14 kN Creep DF9 4.15 kN Creep
DF11 8.00 kN Static, until beam collapse
WF specimens WF0 - - WF1 3.26 kN Creep WF5 4.14 kN Creep WF9 3.30 kN Creep
WF10 4.40 kN Static, until beam collapse
2.2.1 Static tests on unnotched beams
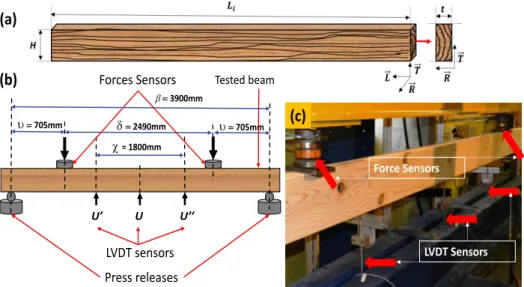
Fig. 4 shows the configuration of the first series of tests. All beams were loaded-unloaded in 4-points bending up to a maximal force of 5 kN (Fig. 7) as presented in Table 2. The experimental device is composed of a steel experimental frame, a hydraulic jack, load and displacement cells, the tested beam, a centralizer and a computer to record deflection data (Fig. 4b and Fig.4c). The aim of these tests is to determine the mechanical characteristics of the beams.
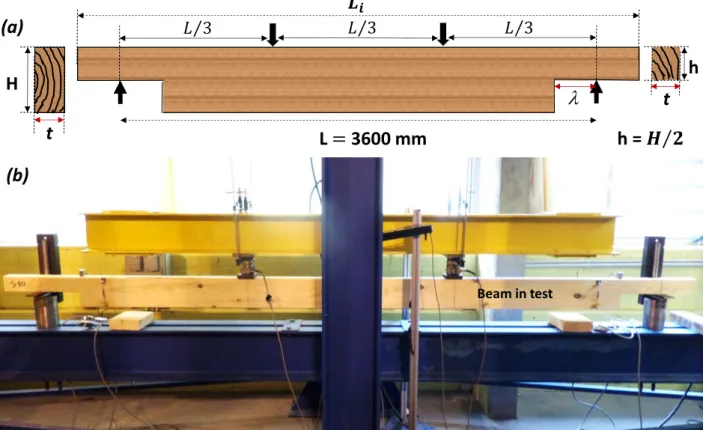
Fig. 4. Configuration of the 4-points bending test on unnotched beam: (a) Beam geometry; (b)
Experimental setup; (c) Beam in test.
LVDT sensors Forces Sensors d=2490mm u=705mm Press releases Tested beam Force Sensors LVDT Sensors (a) (b) (c) c= 1800mm u=705mm =3900mm U’ U U’’
2.2.2 Preliminary static tests on notched beams
After the static test, the end of the beams were removed up to half height, as shown by the red dotted lines in Fig. 1 and 2, to produce notched beams (Fig. 5a and Fig. 6a). This geometry takes into account normative requirements as presented in [24] and is designed to study the combined occurrence of mechanosorption and crack propagation in 4-points bending until delayed failure [25]. As a preliminary test, two notched beams (DF11 and WF10) were loaded in static 4-points bending until failure (Fig. 5b). The objective of these tests was to estimate the maximal applicable load and verify that a crack does initiate and propagate in a rectilinear way from the corner of the notches until the collapse of the beam.
Fig. 5. Configuration of static tests on notched beam: (a) Specimen geometry; (b) Experimental setup.
2.2.3 Creep tests in outdoor environment
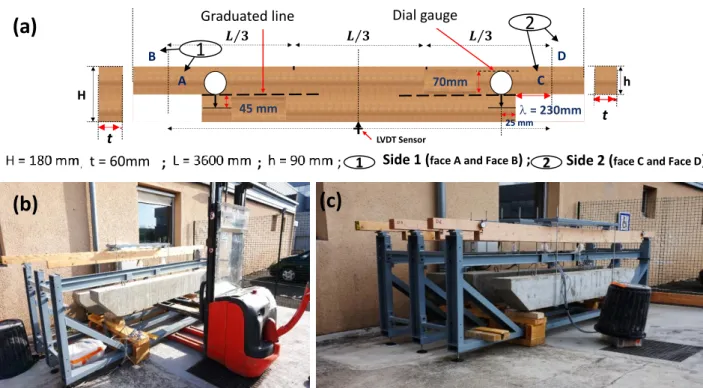
The remaining notched beams, two DF (DF3, DF9) and three WF (WF1, WF5, WF9), were subjected to 4-points bending creep tests in outdoor conditions as shown in Fig. 6. The total deflection was measured by LVDTs placed under the center of the beam; plates have been placed on and under the supports to avoid possible crushing of the beams during the entire test period (Fig. 6). For each beam a pair of dial gauges are placed at 25mm from both notches to record the extent of crack opening, on one face at positions A and C (Fig. 6a); the span of the measurement was 45 mm. Graduated lines with 1 cm increment were glued on both faces at positions A, B, C and D to record the crack length (Fig. 6a). The creep loading was applied using a concrete block (Fig. 6b), and the whole setup was installed outdoors, close to the Laboratory building (Fig. 6c) as presented by [26]. L 3600 mm h H h = t t (a) (b) Beam in test
Fig. 6. Configuration of the creep tests: (a) Specimen used for the test; (b) Loading of the beams using concrete blocks carried with a stacker; (c) Creep tests in outdoor conditions.
The deflection and the climatic parameters (RH, T) were monitored continously, while crack opening, crack length and MC were collected manually every day. The codification used for the data is as follows: DFi or WFi, with i ϵ [1; 13] to designate the beam, OjDFi or OjWFi (respectively, CjDFi or CjWFi) with j ϵ [A, B, C, D] to specify the face opening (respectively, the crack length) of the beam. The weight ( ) of the concrete block applied on each of the five beams is indicated in Table 1 and 2.
For each beam, the initial deflection Uin was computed in the following way. The loading being
applied by progressive steps with a stacker (Fig. 6b), and monitored by load cells momentarily placed under the concrete blocks (Fig. 6b), an initial time t0 corresponding approximately to half loading was determined. The initial deflection Uin was that corresponding to 80 min after loading
(t=t0+4800 sec).
3 Results and discussion
3.1 Mechanical characterization of beams in static tests
The modulus of elasticity (MOE) was calculated in different ways for each beam. For the unnotched beams of the first geometrical configuration, the deflection relative to positions within the load application points could be obtained as U = (U’+U”)/2-U (Fig. 4) leading to an estimate of a
mean MOE for the central area, noted EC:
EC = (3/4) ×(uc2/tH3)×(F/U) (1)
where the definition and value of the geometrical parameters is given in Table 1 (for beam thickness
t and height H) and Fig 4 (for lever arm u and span c). It is also possible to consider the central
deflection U only. In this case the shear modulus G affects the movement of the lateral parts. The application of Timoshenko theory [27, 28] is required to account for this effect, and results in an expression EU of MOE involving the dimensionless ratio E/G :
(c)
(b)
(a)
1
2
1 Side 1 (face A and Face B) ; 2 Side 2 (face C and Face D)
; ; ; ; h H e e A C B D 45mm 70 mm 25 mm comparator Mark with 1 cm increment
LVDT Sensor H = 180 mm e = 60 mm L = 3600 mm h = 90 mm = 230mm t = 60mm t t 70mm 45 mm
EU = (23/36) ×(u2/tH3) ×(F/U)×[1+(108/115)×(E/G)×(H/)2] (2)
where is the distance between the outer loading points (Fig.4). An estimation of E/G ratio can be obtained by using for E the measured EC and for G the prediction from [29], based on literature data
for correlations of the shear moduli GTL and GRL with density and a correction factor for moisture
content taken from [30]:
G = (GTL+GRL)/2 = 0.803 + 1.535 × (-0.45) × [1 – 0.02×(MC-12%)] (GPa) (3)
Based on these assumptions the E/G ratio ranges from 12 to 20 and the magnitude of the shear correction from 2.3 to 3.8%. The obtained values EC and EU are given in Table 1.
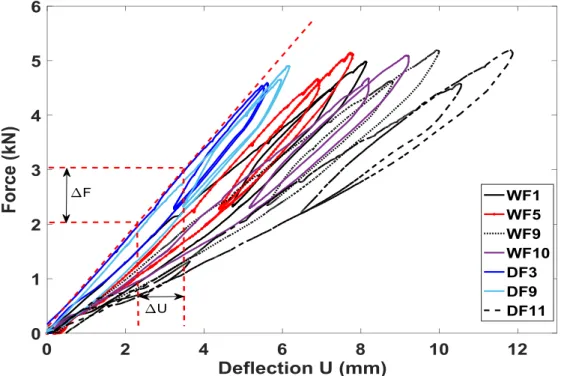
Fig. 7 presents the force-deflection curves of unnotched beams obtained during the static 4-points bending test described in Fig. 4.
Fig. 7. Force-deflection curves obtained from static bending of unnotched beams. F, U: data for
MOE computation.
Fig. 8 shows the influence of mean beam density given in Table 1 on EU, calculated according to
equation (2) and based on the slope F/U of the curves of Fig. 7: 92% of the differences in MOE
is explained by density (R2 =0.83). No inter-species effect is apparent on this reduced sampling. The prediction from [29] for the longitudinal Young’s modulus EL at 20°C (Equation 4) is indicated for
comparison, using the MC value of Table 1, and shows that the observed values of EU are higher to
expectations for all WF beams except for DF11 where is it unusually low.
Fig.8 Relation between the global MOE of unnotched beam (EU) and average beam density ()
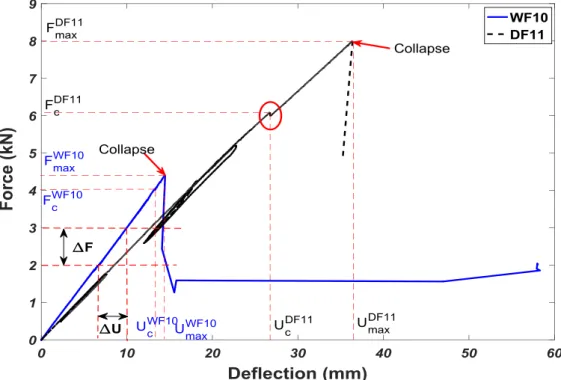
After being notched, WF10 and DF11 were loaded in 4-points bending until failure. These two specimens were initially chosen for their low density among the samples of their lot (Table 1 and Fig. 8). Fig. 9 presents their force-deflection curves. Note that WF10 was tested first at a rather rapid loading rate, and then for DF11 a lower loading rate was chosen to avoid a too rapid collapse. The maximal load (Fmax) supported by DF11 and WF10 is 8.0 kN and 4.4 kN, respectively. Some
discontinuities in the curves were observed during the loading allowing to define a critical load level Fc and displacement Uc (Table 3) for each species. The MOE for this new geometrical
configuration, taking into account the shear effects [27] is expressed by:
EN = (23/108)×(L3/tH3)×[1+(189/23)α3]×(F/U)×[1+] (5)
where α = 2L is the notching ratio and =(108/115)×(k)×(H/L)2×[1+(3/2)×]/[1+(189/23)×3] the shear correcting factor for the notched beam. This expression assumes that the notched beam is composed by three successive constant cross-section portions. The contribution of the transition zones between successive portions, on the global deflection, is neglected.
DF3
DF9
DF11
WF1
WF5
WF9
WF10
E
U(GPa) = 59.8×(g/cm
3) - 12.2
R² = 0.83
5
7
9
11
13
15
17
19
21
0,35
0,4
0,45
0,5
0,55
E
U(GP
a)
Density
(g/cm
3)
0.35
0.4 0.45 0.5 0.55
: Expected Young’s modulus (E
L)
Fig. 9. Preliminary bending tests performed on notched beams DF11 and WF10 until their collapse;
WF10 was loaded at 0.20 mm/sec and DF11 at 0.03 mm/sec.
Table 3 presents the mechanical characteristics of the notched beams DF11 and WF10 deduced from Fig. 9. Note that the higher loading rate can explain, for a part, the higher MOE of WF10. Based on these results, the loading for the creep test was set to approximately 4kN, except for DF11 and WF10 where it was reduced by drilling holes in the concrete blocks. The weight mc finally
applied to each beam is indicated in Table 1. A conventional loading ratio was computed by assuming a proportionality of the critical load to density, for each species:
%= (0/)×(g.mc+g.mb+g.me)/(Fc0+g.mb0+g.me0) (6)
where g is the acceleration of gravity, the other parameters are given in table 1 and the exponent 0 refers to DF11 for DF specimens and to WF10 for WF specimens. Rather than an estimate of a load level - since the reference used represent poorly their respective lot – this ratio was used to check that the applied load is lower than the expected failure load based on the test carried out on the lowest density beams. The calculated values of are given in Table 1.
Table 3: Principal characteristics of the notched beams DF11 and WF10
(kN) (mm) (kN) (mm)
WF10 4.04 13.27 4.5 14.46
DF11 6.01 26.74 8.01 36.39
3.2 Mechanical characterization of beams in creep tests
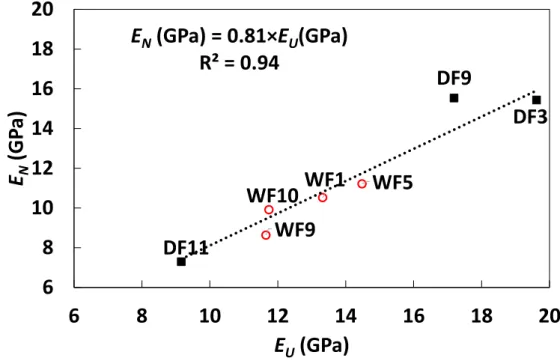
For the other notched beams, EN was estimated by considering the initial deflection Uin (defined in
Fig. 10. (a) Relationships between the MOE of notched beam EN and unnotched beam EU.
Uin will be used as initial deflection for the calculation of a relative deflection Δr:
Δr = q.U/Uin (7)
where q is a correcting factor accounting for the weight of the beam (mb) and of the equipment (me),
installed on the beam (Fig. 6) prior to the loading of the concrete blocks, see Table 1. Indeed these loads do not interfere in the measurement of the MOE related to the ratio between F and U-Uin, but
are involved in the creep response. A value of q=F/(F+g.mb+g.me) was assumed for each beam
tested in creep, neglecting as a rough approximation the difference of stress distribution between the dead loads and that resulting from the 4 points bending. The obtained value for q ranges from 0.89 to 0.91.
Note that Δr includes the direct contribution to the measured deflection of the thermal expansion of
the equipment and transverse expansion of the wood, due to the vertical gap between the external supports and the reference of the transducer. Assuming a metal thermal expansion of 1.1 10-5/°C and a wood swelling ratio of 0.2 %/%, a upper bound of daily variations of 20°C for T and of 1% for MC, over the half-height of 90 mm the reversible thermal expansion would amount to 20 m and the moisture expansion to 0.2 mm, corresponding to contributions to r of up to 0.001 and 0.02,
respectively, which can be reasonably neglected in the present analysis. As will be shown later, the variations of temperature and moisture content do have, indirectly, a significant impact on the deflection through the modified bending behaviour and crack geometry.
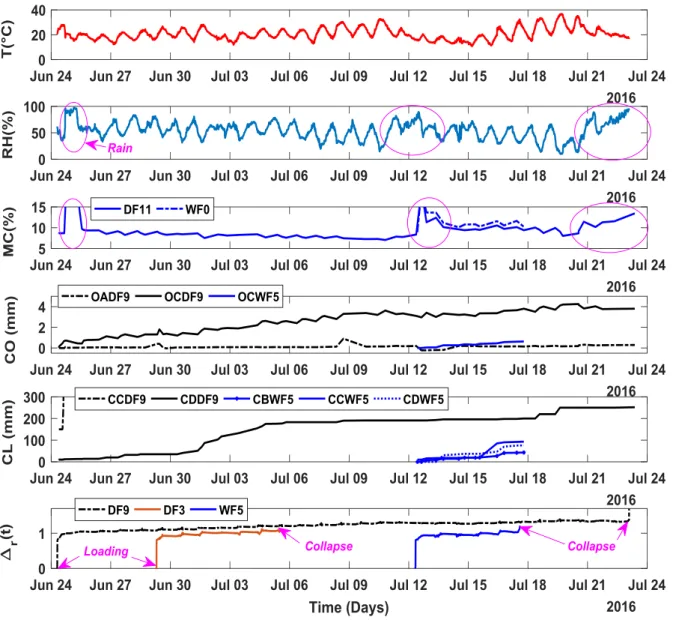
Fig. 11 and 12 present the results of the tests for the 5 loaded and 2 reference beams, Fig 11 for the first campaign of early Summer 2016 and Fig. 12 for the second of late Winter and early Spring 2017. For CO and CL, only the positions that reached non-zero values before the end of the test are shown. In case of WF9 for instance, both sides cracked in a rather balanced way, while for WF1 only one side cracked but to a dramatic extent (Fig. 12). For MC, the scale of the y-axis was set to hide values exceeding 20%, that all corresponded to unrealistically rapid change over one day, and could not be considered as reliable. Such artefact was due to the presence of liquid water close to the surface during rainy periods, indicated by ellipses.
DF3
DF9
DF11
WF10
WF5
WF9
WF1
E
N(GPa) = 0.81×E
U(GPa)
R² = 0.94
6
8
10
12
14
16
18
20
6
8
10
12
14
16
18
20
E
N(GP
a)
E
U(GPa)
The load ratio max, load duration tmax, and final relative deflection max are given in Table 1. For
WF, there is some consistency between the observed values: WF5 that was most heavily loaded, broke after 6 days only, and exhibited little creep, while WF1 and WF9, subjected to lower loads, broke after more than 3 months which plenty of time for the expression of creep. DF beams, however, were apparently subject to a much lower loading – considering their higher density – than WF1 and WF9, but broke after much shorter time. The comparison of these two situations suggest that WF10 used as reference for the computation of for WF beams, was exceptionally tough and indeed, a poor representant of its lot.
Fig. 11. Evolution of measured parameters for beams DF9, DF3 and WF5: T: temperature; RH:
relative humidity; MC: moisture content (of matched beams); CO: crack opening; CL: crack length;
Δr: relative deflection according to equation 7. For codes in legends of crack parameters CO and
CL, refer to §2.2.3 (N.B.: in CL graph, CCDF9 reached rapidly very high values, up to 1100 mm, excluded from the scale – see the full data in Fig. 19). The pink ellipses highlight the rainy periods.
Fig. 12: Evolution of of measured parameters for beams WF1 and WF9. Same as Fig. 11.
Table 4 shows statistics of hygrothermal parameters during the two periods of the creep tests (24/06-23/07/2016 and 12/01-28/4/2017). The presence of a thin layer of water-saturated wood on external surface perturbates the MC measurement, so that the highest values of measured MC (20% and above) should not be taken as true measurement of average MC through the thickness but as an indicator of rainy periods. In Fig. 12 for instance, the sharp apparent increase of MC mid January and early February indicate rainy days likely followed by wood moistening, causing a marked increase of deflection. These results are in accordance with the literature which shows that the creep rises during the moistening process of wood [21], [31]–[33].
Table 4: Statistics of climatic parameters during the creep tests.
DF11 DF3 and DF9 WF0 WF5 WF0 WF1 and WF9 MC(%) RH(%) T(°C) MC(%) RH(%) T(°C) MC(%) RH(%) T(°c) Min. 7.06 9.80 10.90 8.96 29.35 10.90 11.00 11.70 -7.70 Median 8.67 55.50 20.10 11.00 53.55 16.00 14.46 63.70 8.60 Mean 9.30 54.35 20.80 12.75 51.89 17.08 15.17 63.36 8.25 Max. 19.13 97.60 36.70 29.86 89.30 32.29 31.67 100.00 26.10
Date Start June 24 June 29, 2016 June 12, 2017 January 12, 2017
Fig. 13 shows a zoom during 5 days (31/3-4/4/2017) taken from data of Fig. 12. Within these daily variations, the deflection increases during humidification (Fig. 13a). Contrariwise, during the drying process (period of elevated temperature and low RH, Fig. 13a) the deflection almost returns to its initial position (fig. 13b) [26], [34]. This quasi cyclic response can be explained by the combined contribution of several effects of temperature and humidity, that affect reversibly the measured deflection. The slight perturbation due to half-thickness expansion of the beam has been already discussed in §3.2. The major effects are the positive influence of moisture content on the cross-section inertia, given by the term tH3 appearing in equation (5), and its negative influence on the longitudinal Young’s modulus EU. Practically, the latter effect dominates the former, so that,
eventually, a humidification leads to an increase of deflection and a drying, to a decrease.
Fig. 13. Variations over 5 days (31/3-4/4/2017): (a) Continuous monitoring of temperature (T, red
line),relative humidity (RH, blue), and manual measurement of average moisture content (MC) of matched beam WF0 (blue squares); (b) Continuous monitoring of relative deflection (Δr) of two WF
beams.
3.3 Relationships between RH, T and MC and crack behaviour. 3.3.1 Crack opening
Fig. 14 and 15 show the cracks opening appeared on all beams versus MC and T, respectively. The cracks tend to open with an increase of T (Fig. 15), corresponding to drying, while during humidification they tend to close (Fig. 14). These observations could be explained by the hygroscopic phenomenon of wood, with a volume increase during the moistening process causing crack closing, and a volume reduction during the drying process causing crack opening. Note that
(a)
are rapidly reached on both sides (see curves of OAWF1, OCWF1) as the average MC of the beam increase from an initial level of 10-12% to around 15-16%, without any crack occurrence at the beginning (CAWF1=0 until mid-February and CBWF1=0 until end of March). In April, when the wood was subjected to a significant drying, the shrinkage was compensated by actual crack opening resulting in an apparently constant value of CO, until beam WF1 eventually collapsed.
Fig. 14. Relationship between crack opening and moisture content.
3.3.2 Crack propagation
Fig. 16 and 17 present the crack length versus T and MC, respectively. As observed for the crack opening, there is a positive effect of T on crack propagation (Fig. 16), but no visible impact of MC increase (Fig. 17).
Fig. 16. Relationship between cracks length and temperature
Fig. 18 shows the relationship between CL and CO, measured on the same side of the beam. Fig. 18b focuses on a detail of the observed response to better understand the evolutions of the curves presented for all cases in Fig. 18a. The progression of CL is monotonic, while that of CO occurs both ways, so that the vertical axis gives also an indication of the chronology of the test. In all cases the curves begin at the origin, except for DF9 and WF5 for which a drying crack was visible on their face C before the loading. Horizontal segments from right to left correspond to the closing of the crack; they are sometimes associated to a slight CL increase. Horizontal segments from left to right, followed by inclined segments, indicate that the crack propagation (CL increase) is preceded by a crack opening without propagation. Such observation suggests a threshold effect.
Fig. 18. Relationship between cracks length and crack opening: (a) Data for all observed situations;
(b) Part of WF9C trajectory in Fig. 18a and interpretation of the relationship between crack length and crack opening.
Indeed, Fig. 14 to 17 suggest that crack initiation or propagation occurs during warming periods, characterized by a rise of T. On the basis of these observations, we can assume that it usually takes place during the drying process and that its occurrence is conditioned by the reaching of a critical opening. According to Fig. 18, three different cracking situations can be observed: initiation and propagation during drying determined by a threshold of crack opening (cf. (3) in Fig. 18b); crack closure and locking during humidification (Cf. (2) in Fig. 18b); crack propagation during humidification possibly due to the coupling with an additional mechanical stress such as a strong wind (Cf. (1) in Fig. 18b). The high risk of material failure being related to crack initiation and propagation the impact of the crack on the creep of the beam must be taken into account.
3.4 Effet of crack propagation on beam deflection and failure
The results of Fig. 11 to 13 show that the deflection increases during moistening, while those of Fig 14 to 18 suggest that the crack propagates during drying. In order to analyse the relationship between both phenomena, Fig. 19 combines, for each beam, crack propagation until beam failure, and relative deflection. The pink ellipses highlight the marked impact of the crack propagation on the deflection. In Fig. 19b for instance, the propagation of CBWF5 and CDWF5 (13/6 -14/6-15/6 and 16/6/2017) are immediately followed by an increase of WF5 deflection. Similar observation could be made for WF1 and WF9, except that in some cases, like the initiation of CAWF1 on 15/2, the consequence on the deflection is not immediate but spread during about 5 days. Here the occurrence of the crack was only observed on side A, and remained moderate until it started on side B as well from 27/3 (CBWF1>0, Fig. 19a). In the case of DF9 (Fig. 19c), a large crack was provoked by the loading on side C (CCDF9 ~ 1 m), but did not change much afterwards, while it
160 170 180 190 200 210 220 0 1 2 3 4 Cr ac k leng th (mm) Crack opening (mm)
initiation and propagation threshold defect
1
1 combined humidification and propagation
(1) (2) (3) 0 1 2 3 4 Crack Opening (mm) (a) (b)
appeared slowly on side D. Here no sudden delfection increase was observed until failure, possibly due to the occurrence of a complete crack on side C-D.
These results suggest that the deflection does not rise only during the moistening process due to increased compliance but also during the drying process due to crack propagation. They highlight the coupled effects of climatic changes and crack propagation on the lifetime of DF and WF beams.
Fig. 19. Evolution of deflection and crack length for WF1 (a), WF5 (b), WF9 (c), DF9 (d).
4 Conclusion
The impacts of environmental changes on the mechanical response on notched beams of DF and WF have been investigated on scale one beams with common features such as knots and other sources of grain deviation, corresponding to C24 standard criteria. The beams were loaded in 4-points bending in outdoors, unsheltered conditions. The experimental results exhibit a wide range of time to failure (6 to 104 days) and final relative deflections (1.1 to 2.0). The applied loads correspond to severe loading, much higher than service limited states according to Eurocodes. The load ratio used in this paper cannot be considered as a load level, especially for Douglas fir. Crack length and crack opening were measured daily until failure: CO ranged from 0 to 2 mm for WF and from 0 to 4 mm for DF; CL ranged from 0 to 1100 mm for DF and from 0 to 800 mm for WF. These observations suggest a better toughness of Douglas fir compared to white fir, a result that needs, however, to be verified on a wider sampling. The notched-beam loading history integrates the effect of natural climate, depending on loading date and time to failure. The obtained results
(a) (b)
wood softening favors deflection increase. During the drying process (T increase), there is a stiffening of wood but some crack initiation and, later, crack propagation, that contribute to the deflection. Crack propagation leads, eventually, to global beam collapse. The combined measurement of crack opening and length, in relation to hygrothermal parameters, is useful to identify the features of such cracking processes. This paper made it possible to set up an experimental database of global deflection evolution as a function of the humidification and drying cycles coupled with crack propagation. The next phase will consist in completing the experimental database and extend the analysis through mechanical
Acknowledgments
The authors would like to acknowledge the valuable contributions of the National Research Agency (ANR) for their financial support of this work through the CLIMBOIS ANR-13-JS09-0003-01 project, as well as the labeling awarded by France's ViaMéca cluster and the laboratory of physical meteorology (Lamp) of University Clermont Auvergne for the regular sending of meteorological data. The authors acknowledge also the CNRS for the financial support through the project “Ingéniérie verte” RUMO.
References
[1] F. Asdrubali, B. Ferracuti, L. Lombardi, C. Guattari, L. Evangelisti, and G. Grazieschi, “A review of structural, thermo-physical, acoustical, and environmental properties of wooden materials for building applications,” Building and Environment. 2017.
[2] N. Macchioni, M. Brunetti, B. Pizzo, P. Burato, M. Nocetti, and S. Palanti, “The timber structures in the Church of the Nativity in Bethlehem: Typologies and diagnosis,” J. Cult.
Herit., vol. 13, no. 4 SUPPL., pp. e42–e53, 2012.
[3] N. Angellier, F. Dubois, R. Moutou Pitti, M. Diakhaté, and R. S. Adjovi Loko, “Influence of hygrothermal effects in the fracture process in wood under creep loading,” Eng. Fract.
Mech., vol. 177, pp. 153–166, 2017.
[4] R. Moutou Pitti, F. Dubois, N. Sauvat, and E. Fournely, “Strain analysis in dried green wood: Experimentation and modelling approaches,” Eng. Fract. Mech., vol. 105, pp. 182–199, 2013.
[5] E. Toussaint, E. Fournely, R. Moutou Pitti, and M. Grédiac, “Studying the mechanical behavior of notched wood beams using full-field measurements,” Eng. Struct., vol. 113, pp. 277–286, 2016.
[6] I. Teodorescu, D. Ţǎpuşi, R. Erbaşu, E. Bastidas-Arteaga, and Y. Aoues, “Influence of the Climatic Changes on Wood Structures Behaviour,” in Energy Procedia, 2017.
[7] L. Brancheriau, H. Baillères, and D. Guitard, “Comparison between modulus of elasticity values calculated using 3 and 4 point bending tests on wooden samples,”Wood Sci. Technol., vol. 36, pp. 367–383, 2002.
[8] S. E. Hamdi, R. Moutou Pitti, and F. Dubois, “Temperature variation effect on crack growth in orthotropic medium: Finite element formulation for the viscoelastic behavior in thermal cracked wood-based materials,” Int. J. Solids Struct., vol. 115–116, pp. 1–13, 2017.
properties of aged wood and salvaged timber,” Constr. Build. Mater., vol. 114, pp. 681–687, 2016.
[10] J. Smardzewski, M. Słonina, and M. Maslej, “Stiffness and failure behaviour of wood based honeycomb sandwich corner joints in different climates,” Compos. Struct., vol. 168, pp. 153– 163, 2017.
[11] C. Bylund Melin and J. Bjurman, “Moisture gradients in wood subjected to relative humidity and temperatures simulating indoor climate variations as found in museums and historic buildings,” J. Cult. Herit., vol. 25, pp. 157–162, 2017.
[12] S. Merakeb, F. Dubois, and C. Petit, “Modélisation des hystérésis de sorption dans les matériaux hygroscopiques,” Comptes Rendus - Mec., 2009.
[13] O. Saifouni, J. F. Destrebecq, J. Froidevaux, and P. Navi, “Experimental study of the mechanosorptive behaviour of softwood in relaxation,” Wood Sci. Technol., vol. 50, no. 4, pp. 789–805, 2016.
[14] K. C. Hung, T. L. Wu, Y. L. Chen, and J. H. Wu, “Assessing the effect of wood acetylation on mechanical properties and extended creep behavior of wood/recycled-polypropylene composites,” Constr. Build. Mater., vol. 108, pp. 139–145, 2016.
[15] R. Moutou Pitti and A. Chateauneuf, “Statistical and reliability analysis for mixed-mode fracture tests applied to wood material,” Wood Sci. Technol., 2012.
[16] M. R. Attolini, F. Calvani, M. Galli, T. Nanni, L. Ruggiero, E. schaer and F. Zuanni., “The relationship between climatic variables and wood structure in Pinus halepensis Mill.,” Theor.
Appl. Climatol., vol. 41, no. 3, pp. 121–127, 1990.
[17] M. Verdet et al., “Creep performance of glued-in rod joints in controlled and variable climate conditions,” Int. J. Adhes. Adhes., vol. 75, no. January, pp. 47–56, 2017.
[18] S. Svensson and T. Toratti, “Mechanical response of wood perpendicular to grain when subjected to changes of humidity,” vol. 36, no. July 1997, 2002.
[19] K. J. Fridley, R. C. Tang, and L. a Soltis, “Moisture effects on load-duration behavior of lumber. Part {II}. Effect of cyclic relative humidity,” Wood Fiber Sci., vol. 24, no. 1, pp. 89– 98, 1992.
[20] P. U. A. Grossman, “Use of Leicester’s ‘rheological model for mechano-sorptive deflections of beams,’” Wood Sci. Technol., vol. 5, no. 3, pp. 232–235, 1971.
[21] A. K. Bledzki and O. Faruk, “Creep and impact properties of wood fibre-polypropylene composites: Influence of temperature and moisture content,” Compos. Sci. Technol., 2004. [22] C. F. Pambou Nziengui, S. Ikogou, and R. Moutou Pitti, “Impact of cyclic compressive
loading and moisture content on the mechanical behavior of Aucoumea Klaineana Pierre,”
Wood Mater. Sci. Eng., vol. 0, no. 0, pp. 1–7, 2017.
[25] P. J. Gustafsson, P. Hoffmeyer, and G. Valentin, “DOL behaviour of end-notched beams,”
Holz als Roh- und Werkst., vol. 56, pp. 307–317, 1998.
[26] T.-B. Tran et al., “Reliability assessment and updating of notched timber components subjected to environmental and mechanical loading,” Eng. Struct., vol. 166, 2018.
[27] S. P. Timoshenko, “LXVI. On the correction for shear of the differential equation for transverse vibrations of prismatic bars,” London, Edinburgh, Dublin Philos. Mag. J. Sci., vol. 41, no. 245, pp. 744–746, May 1921.
[28] S. Abohadima, M. Taha, and M. A. M. Abdeen, “General Analysis of Timoshenko Beams on Elastic Foundation,” vol. 2015, 2015.
[29] D. Guitard, Mécanique du matériau bois et composites. Cépaduès, 1987.
[30] L. C. Palka, “Predicting the effect of specific gravity, moisture content, temperature and strain rate on the elastic properties of softwoods,” Wood Sci. Technol., vol. 7, no. 2, pp. 127– 141, 1973.
[31] Z. P. Bažant and S. Meiri, “Measurements of compression creep of wood at humidity changes,” Wood Sci. Technol., vol. 19, no. 2, pp. 179–182, 1985.
[32] A. Hanhijarvi, “Advances in the knowledge of the influence of moisture changes on the long-term mechanical performance of timber structures,” Mater. Struct. Constr., vol. 33, no. 225, pp. 43–49, 2000.
[33] F. Dubois, H. Randriambololona, and C. Petit, “Creep in wood under variable climate conditions: Numerical modeling and experimental validation,” Mech. Time-Dependent
Mater., vol. 9, no. 2–3, pp. 173–202, 2005.
[34] M. Moutee, M. Fafard, Y. Fortin, and A. Laghdir, “Modeling the creep behavior of wood cantilever loaded at free end during drying,” Wood Fiber Sci., vol. 37, no. 3, pp. 521–534, 2005.