HAL Id: hal-01166300
https://hal-univ-rennes1.archives-ouvertes.fr/hal-01166300
Submitted on 19 Nov 2015HAL is a multi-disciplinary open access archive for the deposit and dissemination of sci-entific research documents, whether they are
pub-L’archive ouverte pluridisciplinaire HAL, est destinée au dépôt et à la diffusion de documents scientifiques de niveau recherche, publiés ou non,
group-based modeling approach
Guy Fagherazzi, Alice Vilier, Aurélie Affret, Beverley Balkau, Fabrice Bonnet,
Françoise Clavel-Chapelon
To cite this version:
Guy Fagherazzi, Alice Vilier, Aurélie Affret, Beverley Balkau, Fabrice Bonnet, et al.. The asso-ciation of body shape trajectories over the life course with type 2 diabetes risk in adulthood: a group-based modeling approach. Annals of Epidemiology, Elsevier Masson, 2015, 25 (10), pp.785-787. �10.1016/j.annepidem.2015.06.002�. �hal-01166300�
M
A
N
U
S
C
R
IP
T
A
C
C
E
P
T
E
D
Brief Communication
Guy Fagherazzi, PhD1,2; Alice Vilier, PhD1,2; Aurélie Affret, MSc1,2; Beverley Balkau, PhD1,2; Fabrice Bonnet, MD, PhD3,4; Françoise Clavel-Chapelon, PhD1,2
1: Inserm U1018, Center for Research in Epidemiology and Population Health (CESP), Villejuif, France 2: Paris-South University, Villejuif, France
3: CHU Rennes, France 4: Inserm U970, Paris
Correspondence (and reprint requests) to:
Guy Fagherazzi
Center for Research in Epidemiology and Population Health (CESP), INSERM (Institut National de la Santé et de la Recherche Médicale) U1018, Team 9, Lifestyle, genes and health:
integrative trans-generational epidemiology, Gustave Roussy Institute, 114 rue Edouard Vaillant, 94805 Villejuif Cedex, France
Telephone: +33 1 42 11 61 40 Fax: + 33 1 42 11 40 00
Email: guy.fagherazzi@gustaveroussy.fr
Running title: Body shape trajectory and incident Type 2 Diabetes
Abstract word count: 198 Main text word count: 1795
M
A
N
U
S
C
R
IP
T
A
C
C
E
P
T
E
D
Purpose: Low birth weight is a well-recognized risk factor for type 2 diabetes (T2D), but less is
known about risks associated with the evolution of body shape throughout life with incident T2D in adulthood.
Methods: In 80 110 women from the E3N cohort study, trajectories of self-reported body
shapes from age 8 to 35-40 years were derived using a group-based modeling approach and studied in relation with incident T2D
Results: Compared to women who maintained a stable mid-range body shape trajectory from 8
to 40 years, women in all other observed trajectories were at a higher risk of developing T2D in adulthood: the highest risk was observed for women who were lean at age 8 and had a sharp increase in body shape (HR=2.91[2.35-3.62]); their T2D risk was higher (P for homogeneity = 0.059) than for women who maintained the largest body shape (HR=2.18[1.76-2.69]).
Conclusions: A group-based modeling approach has identified trajectories of body shape
evolution with different risks of developing T2D in adulthood. A sharp increase in body shape after puberty in previously lean girls is a risk factor for the subsequent development of diabetes.
adulthood; body shape; childhood; cohort; group-based modeling; life course; trajectory; type 2 diabetes; risk;
M
A
N
U
S
C
R
IP
T
A
C
C
E
P
T
E
D
The association between low birth weight and type 2 diabetes (T2D) risk has been consistently suggested (1), including in our own E3N cohort (2). It has also been suggested that T2D risk was higher for obese adults who were also overweight or obese in childhood and adolescence than for those who were obese in adulthood only (3). These results are based on a pool of three moderately sized cohorts with participants categorized as overweight or obese in childhood and adulthood only. Little information is available on the influence of weight in between these periods (4) and correlations between an individual’s measurements at different time points are not accounted for. Moreover, most of the existing studies failed to adjust for adult BMI and therefore the associations observed may reflect the tracking of BMI across the lifespan.
Interestingly, where adult BMI was adjusted for, there was a weak inverse association between childhood BMI and metabolic variables, and those with a low BMI in childhood but obese during adulthood were at higher risk of T2D (5).
To our knowledge, there is no overview of the influence of the evolution of body shape over the lifespan on T2D risk in adulthood. Using data from the large prospective E3N cohort study with measures of body shape at various points in time, we derived trajectories of body shape from childhood to adulthood, and then studied the subsequent development of T2D at adulthood.
!
" !
#
The E3N cohort included 98 995 women living in France and covered by a national health insurance program. Participants, who were mostly teachers, were 40–65 years of age when they first entered the cohort between June 1990 and November 1991. Follow-up questionnaires were sent every 2–3 years thereafter to all participants, as described previously (6). The final study population includes 81 110 women, after exclusions of prevalent T2D cases and individuals with missing information on body shape at all time points (n=17 885).
In the first questionnaire in 1990, women were asked to report which drawing in a series of 8 Sørensen’s body shapes (7) best described their body shape at around the age of 8, at
M
A
N
U
S
C
R
IP
T
A
C
C
E
P
T
E
D
menarche, at ages 20-25 years, and at ages 35-40 years (see Figure 1). The 8 pictorial body shapes representing extreme thinness to obesity were previously validated in our population (8). In the following, women with the smallest body shape were described as “lean”. Weight and length at birth were also documented in the seventh questionnaire sent out in 2002, but were used only as adjustment covariates, as they could only be quantified as low/small, medium, or large.
#
$
Body shape trajectories, based on Sørensen’s body shapes scale at four different ages considered as longitudinal data, were constructed using Nagin’s approach to group-based trajectory modeling (9;10). This method is an application of finite mixture modeling and enabled us to define clusters of women with a similar evolution of body shape over time. This
methodology has never been applied in the context of etiological research of T2D risk factors. Trajectories were evaluated using the censored normal model of the SAS Proc Traj. Adjustment was made for birth weight and birth length as they were hypothesized to influence body shape trajectories. The optimal number of groups and shapes of trajectories was selected to best fit the data, as evaluated by a change in the Bayesian Information Criterion and the percentage of individuals included in each category. The body shape trajectories used cubic functions of age. Six trajectories were finally used, and are named ‘T1’ to ‘T6’ (see Figure 1).
% &
Univariate and multivariable Cox proportional hazards regression models, with age as the time scale, were fitted to estimate hazards ratios (HR) and 95% confidence intervals (CI) for the risk for developing T2D, according to these six trajectories. The list of the adjustment covariables is presented in Table 1.
'
(
)
When compared to women who always reported mid-range body shapes between age 8 and 35-40 years (trajectory T3), the participants in all other trajectories were at a significantly higher risk of developing T2D in adulthood in the multivariable adjusted model
M
A
N
U
S
C
R
IP
T
A
C
C
E
P
T
E
D
First, the lowest T2D risk was observed in women who were constantly in the upper mid-range of body shape (trajectory T5), parallel to the reference trajectory (HR=1.44, 95%CI: [1.23-1.69]). Then, being lean at age 8 with a modest increase in body shape at puberty (trajectory T2) or being always lean since age 8 (trajectory T1) were associated with slightly higher risks of T2D (HR=1.56, 95%CI: [1.35-1.81] and HR=1.57, 95%CI: [1.34-1.84] respectively).
A much higher risk was observed for those who reported the largest body shapes at all ages (trajectory T6, HR=2.18, 95%CI: [1.76-2.69]). Finally, the highest risk was observed for women who were lean at age 8 and who then had a sharp increase in body shape at puberty and thereafter (trajectory T4), as they had an almost 3-fold higher risk of developing T2D risk (HR=2.91 [2.35-3.62]).
)
In this large prospective cohort, we identified one body shape trajectory over the life course that was associated with a very high-risk of T2D in adulthood: women who were lean at age 8, who then had a large increase in their body shape at puberty and thereafter; they had an almost 3-fold increase in risk compared to those whose body shape stayed mid-range. This trajectory was associated with an even higher risk compared to always having a large body shape. These results have been obtained using a group-based modeling strategy that has not been used in T2D epidemiology before.
Our results are in line with previous studies focusing on the link between adiposity at different ages and T2D risk in adulthood. An earlier study in the E3N cohort showed that a low birth weight was associated with a higher risk of T2D in adulthood, especially when the participants reported being overweight in adulthood (2). However, these findings did not take into account the individual evolution of body shape between childhood and adulthood. Our results are also in agreement with a paper by Power et al (11) showing that an excessive BMI gain across the lifespan and an early onset of overweight/obesity was associated with impaired glucose
metabolism, only partially mediated by adult BMI. This strengthens the fact that it is important to have access to the entire individual’s history of body shape to be able to estimate T2D risk in adulthood, and not just BMI in adulthood. However, in contrast to our results, it has been shown in another study among British birth cohort participants, that T2D risk in adulthood was higher for obese adults who were also overweight or obese in childhood and adolescence than for those who were obese in adulthood only (3). We have also found an increased risk of T2D for participants who always had a large body shape from childhood to adulthood, but, interestingly,
M
A
N
U
S
C
R
IP
T
A
C
C
E
P
T
E
D
the highest risk was observed for those who were lean at age 8 and had a strong increase in body shape afterwards.
Strengths and limitations
We analyzed validated incident T2D cases, based on a well-defined algorithm combining self-reported information, causes of hospitalization and medico-administrative files on glucose-lowering drugs and insulin reimbursement, which reduces the risk of missing cases or false positive cases (2). Some residual misclassification with respect to diabetes status may exist, but it is likely to be non-differential. Measures of body shape were self-reported, but this 8 level pictorial scale was validated in our population. It was shown that the thinnest girls tended to overestimate their recalled body shapes, while normal or heavier girls tended to underestimate them. Such misclassification would only bias our relative risk estimates towards unity. Our results might not be generalizable to men, thus it would be important to conduct a similar study among men. This is the first study to use this method to investigate a relationship between complete trajectories of body shape from childhood to adulthood and T2D risk in adulthood, using an innovative group-based modeling technique. This method is particularly useful as it takes into account the correlations between body shape measurements at different periods over the life course.
Conclusion
Our study suggests that a group-based modeling approach is useful to estimate T2D risk in adulthood from body-shape data and has enabled us to identify trajectories of body shape evolution with a very high risk of developing T2D. A sharp increase in body shape from puberty in previously lean girls is a risk factor for the subsequent development of diabetes.
We are indebted to all the study participants and are grateful to the E3N group.
*
The study is supported by the Mutuelle Générale de l’Education Nationale, the Institut de Cancérologie Gustave Roussy and the Institut National de la Santé et de la Recherche Médicale. The validation of potential diabetes cases was supported by the European Union (Integrated Project LSHM-CT-2006–037197 in Framework Programme 6 of the European
M
A
N
U
S
C
R
IP
T
A
C
C
E
P
T
E
D
Community) InterAct project. Study sponsors had no role in designing the study, data analysis or interpretation, writing the manuscript, or the decision to submit the manuscript for publication.
)
The authors declare that there is no duality of interest associated with this manuscript.
Author contributions were as follows: GF designed the research, conducted the research; AV analysed data; GF, AV, AA, FB and BB interpreted the data; GF drafted the article, and BB, AA, FB and FCC revised it critically; FCC contributed substantially to data acquisition; GF had primary responsibility for the final content of the manuscript; all authors read and approved the final manuscript.
M
A
N
U
S
C
R
IP
T
A
C
C
E
P
T
E
D
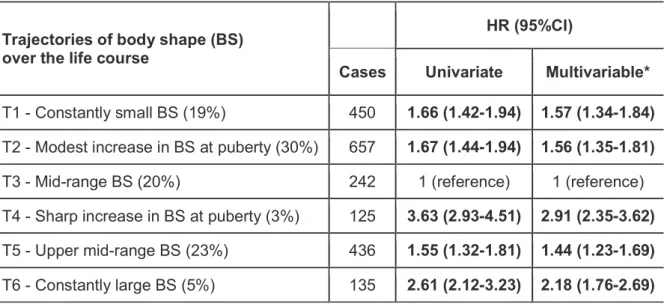
Table 1. Univariate and multivariable hazard ratios (HR) and 95% confidence intervals for incident type 2 diabetes
associated with the body shape trajectories. E3N Cohort data (n=81 110).
Trajectories of body shape (BS) over the life course
HR (95%CI)
Cases Univariate Multivariable*
T1 - Constantly small BS (19%) 450 1.66 (1.42-1.94) 1.57 (1.34-1.84)
T2 - Modest increase in BS at puberty (30%) 657 1.67 (1.44-1.94) 1.56 (1.35-1.81)
T3 - Mid-range BS (20%) 242 1 (reference) 1 (reference) T4 - Sharp increase in BS at puberty (3%) 125 3.63 (2.93-4.51) 2.91 (2.35-3.62)
T5 - Upper mid-range BS (23%) 436 1.55 (1.32-1.81) 1.44 (1.23-1.69)
T6 - Constantly large BS (5%) 135 2.61 (2.12-3.23) 2.18 (1.76-2.69)
* Multivariable models were adjusted for education level, smoking status, physical activity, hypertension, hypercholesterolemia, family history of diabetes, use of hormone replacement therapy, age at menarche, number of children, use of oral contraceptives, menopausal status, birth length and birth weight.
M
A
N
U
S
C
R
IP
T
A
C
C
E
P
T
E
D
A CCE P T E D M A N U S CRIP T L e g e n d F ig u re 1 . T ra je c to ri e s o f re tr o s p e c ti v e ly s e lf -r e p o rt e d b o d y s h a p e f ro m a g e 8 t o 3 5 -4 0 y e a rs w it h g ro u p -b a s e d m o d e lin g b a s e d o n S o re n s e n ’s s c a le o f b o d y s h a p e f o r th e E 3 N C o h o rt d a ta ( n = 8 0 1 1 0 ). P e rc e n ta g e s c o rr e s p o n d t o t h e i n c re a s e d r is k o f d e v e lo p in g T 2 D c o m p a re d t o i n d iv id u a ls i n t ra je c to ry T 3 , c h o s e n a s t h e r e fe re n c e c a te g o ry . A ll s h o w n i n c re a s e d r is k s w e re s ta ti s ti c a lly s ig n if ic a n t (P < 0 .0 5 ), w h e n c o m p a re d t o t ra je c to ry T 3 .M
A
N
U
S
C
R
IP
T
A
C
C
E
P
T
E
D
Reference List(1) Whincup PH, Kaye SJ, Owen CG, Huxley R, Cook DG, Anazawa S, et al. Birth weight and risk of type 2 diabetes: a systematic review. JAMA 2008 Dec 24;300(24):2886-97. (2) Lauzon-Guillain B, Balkau B, Charles MA, Romieu I, Boutron-Ruault MC,
Clavel-Chapelon F. Birth weight, body silhouette over the life course, and incident diabetes in 91,453 middle-aged women from the French Etude Epidemiologique de Femmes de la Mutuelle Generale de l'Education Nationale (E3N) Cohort. Diabetes Care 2010
Feb;33(2):298-303.
(3) Park MH, Sovio U, Viner RM, Hardy RJ, Kinra S. Overweight in childhood, adolescence and adulthood and cardiovascular risk in later life: pooled analysis of three british birth cohorts. PLoS One 2013;8(7):e70684.
(4) Eriksson JG, Kajantie E, Lampl M, Osmond C. Trajectories of body mass index among children who develop type 2 diabetes as adults. J Intern Med 2015 Feb 14.
(5) Lloyd LJ, Langley-Evans SC, McMullen S. Childhood obesity and risk of the adult metabolic syndrome: a systematic review. Int J Obes (Lond) 2012 Jan;36(1):1-11. (6) Fagherazzi G, Vilier A, Lajous M, Boutron-Ruault MC, Balkau B, Clavel-Chapelon F, et
al. Wine consumption throughout life is inversely associated with type 2 diabetes risk, but only in overweight individuals: results from a large female French cohort study. Eur J Epidemiol 2014 Nov;29(11):831-9.
(7) Sorensen TI, Stunkard AJ, Teasdale TW, Higgins MW. The accuracy of reports of weight: children's recall of their parents' weights 15 years earlier. Int J Obes 1983;7(2):115-22.
(8) Tehard B, van Liere MJ, Com NC, Clavel-Chapelon F. Anthropometric measurements and body silhouette of women: validity and perception. J Am Diet Assoc 2002
Dec;102(12):1779-84.
(9) Nagin D. Analyzing developmental trajectories: A semiparametric, group-based approach. Psychological Methods 1999 Jun;4(2):139-57.
(10) Jones B, Nagin D. Advances in Group-Based Trajectory Modeling and an SAS Procedure for Estimating Them. Sociological Methods Research 2007;35:542.
(11) Power C, Thomas C. Changes in BMI, duration of overweight and obesity, and glucose metabolism: 45 years of follow-up of a birth cohort. Diabetes Care 2011 Sep;34(9):1986-91.