Publisher’s version / Version de l'éditeur:
Vous avez des questions? Nous pouvons vous aider. Pour communiquer directement avec un auteur, consultez la première page de la revue dans laquelle son article a été publié afin de trouver ses coordonnées. Si vous n’arrivez pas à les repérer, communiquez avec nous à [email protected].
Questions? Contact the NRC Publications Archive team at
[email protected]. If you wish to email the authors directly, please see the first page of the publication for their contact information.
https://publications-cnrc.canada.ca/fra/droits
L’accès à ce site Web et l’utilisation de son contenu sont assujettis aux conditions présentées dans le site LISEZ CES CONDITIONS ATTENTIVEMENT AVANT D’UTILISER CE SITE WEB.
Building Research Note, 1982-01
READ THESE TERMS AND CONDITIONS CAREFULLY BEFORE USING THIS WEBSITE.
https://nrc-publications.canada.ca/eng/copyright
NRC Publications Archive Record / Notice des Archives des publications du CNRC : https://nrc-publications.canada.ca/eng/view/object/?id=bb9b37d8-2b3b-4f4d-a233-b909f67c9d29 https://publications-cnrc.canada.ca/fra/voir/objet/?id=bb9b37d8-2b3b-4f4d-a233-b909f67c9d29
NRC Publications Archive
Archives des publications du CNRC
This publication could be one of several versions: author’s original, accepted manuscript or the publisher’s version. / La version de cette publication peut être l’une des suivantes : la version prépublication de l’auteur, la version acceptée du manuscrit ou la version de l’éditeur.
For the publisher’s version, please access the DOI link below./ Pour consulter la version de l’éditeur, utilisez le lien DOI ci-dessous.
https://doi.org/10.4224/40000530
Access and use of this website and the material on it are subject to the Terms and Conditions set forth at
Recorded energy consumption in school buildings
RECORDED ENERGY C O N S W TION
IN
SCHOOL BUILDINGSA.H. Elmahdy
The Standing Committee an Energy Conservation in Buildings is a t t e m p t i n g , on behalf of t h e National Research C o u n c i l Associate Committee on the National Building Code, ta define appropriate energy
consmp tion Eargets for d i f f e r e n t classes of b u i l d i n g s . These targets
are p a r t i a l l y based on rhe energy consamption af existing buildings. I n
support of the work of the Standing C o m d t t e e , t h i s r e p o r t contains data on the annual energy consumption in elementary, j unior-high and
secondary/high s c h o o l buildings. These schools are Located in Ottawa, Toronto, Montreal, Winnipeg, Regina, Edmonton, Vancouver and various r e g i o n s in Ontario.
The data presented in this report have been extracted f r o m
i n f o r m a t i o n provided by various schools and boards of education and i t s accuracy has n o t been verified. Also, because of the multitude of
v a r i a b l e s i n v o l v e d and the n a t u r e of t h e d a t a distribution, no attempt was made to correlate the energy consumption w l t h other v a r i a b l e s such
as t h e floor area of schools.
Table 1 shows a sununary of the maximum, m i n i m u m and average f l o o r
areas and a n n u a l energy c o n s m p t i o n in
M J / d y r ,
f o r each sample ofs c h o o l s , together with other i n f o r m a t i o n on t h e type of school I n v o l v e d , t h e sample size
and
t h e year in which r h e dataw e r e
recorded.The information given in T a b l e 1 indicates t h a t energy
consump t i o n v a r i e s considerably within a specific l o c a t i o n , This is due to many f a c t o r s , such as the a c t i v i t y l e v e l in each s c h o o l , t h e type of construction, the h e a t i n g and c o o l i n g system used and t h e existence of energy conservation programs. For example, the P r o t e s t a n t Schaol Board
in Montreal has been a c t i v e l y involved
in
an energy conservation programf o r its school buildings. The r e s u l t s , which are listed in T a b l e I , i n d i c a t e that f o r a g i v e n group of high schools in the Board t h e average annual energy cansumption decreased from 1118
m/m2
yr. in 1976/77 t o1020 ~ ~ / m ~ ~ r . in 1978139. A s i m i l a r r e d u c t i o n occurred a l s o in i t s elementary schools, and
in
ather school boards as well ( e . g . , theOttma/CarEeton Board of E d u c a t i o n ) .
Since the d a t a presented in Table
1
cover a wide geographical area, it was necessary so take into account: the number of annual heating degree days i n t h e last f i v e years f o r the various school locations. Table 2 shows a summary of t h e annual heating degree days in degreesC e l s i u s below 1BnC*.
The a v a i l a b l e
school
samples are organized in one af two ways. One set-up shows the annual energy consumption for each i n d i v i d u a l school in a c e r t a i n location (Montreal, Toronto, O t t a w a , etc. ). The other s e t - u p , used by the Ontario M i n i s t r y of Education, presents t h e t o t a l energy consumption data for each s c h o o l board in the s i x regions:C e n t r a l , Eastern, Xid-Northern, Norrh-Eastern, Worth-Western and Western
Ontario.
Thus, although on f i r s t s i g h t the latter approach results i n
r a t h e r small numbers ( 4 2 , 16, 11, 17,
14
and17
school boards), the actual number of schools w i t h i n each school board is considerable (2524,652, 229, 244, 163 a n d 6 4 2 s c h o o l s , r e s p e c t i v e l y ) .
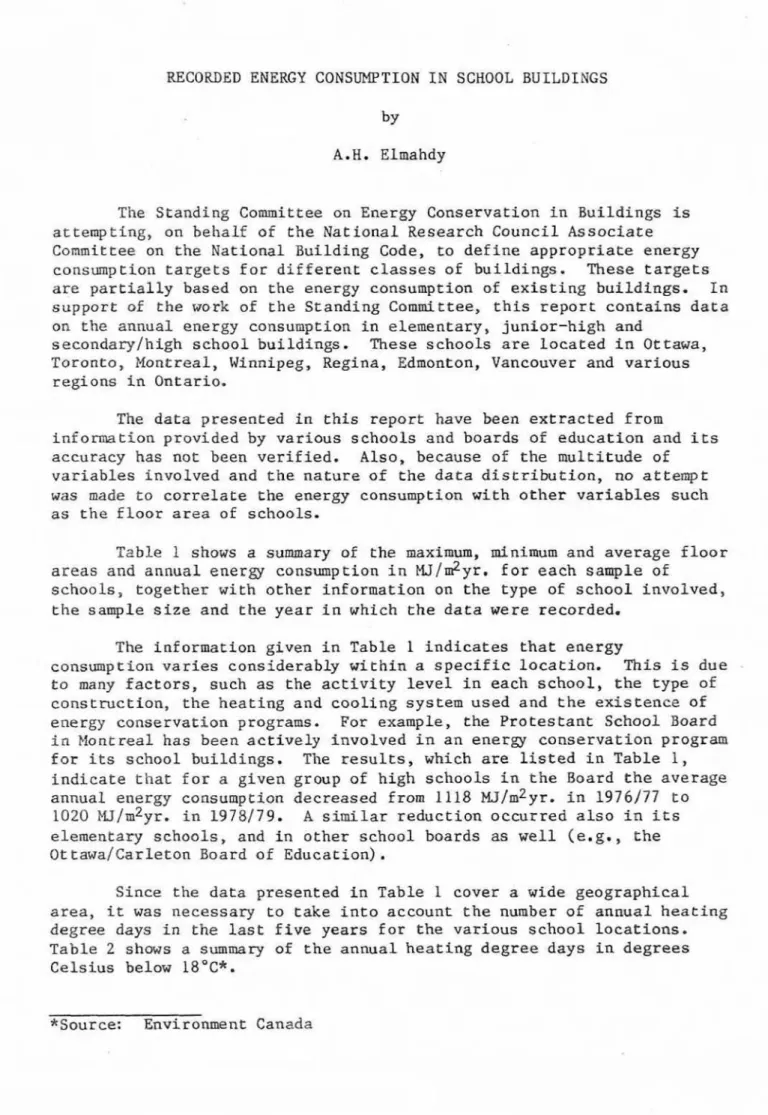
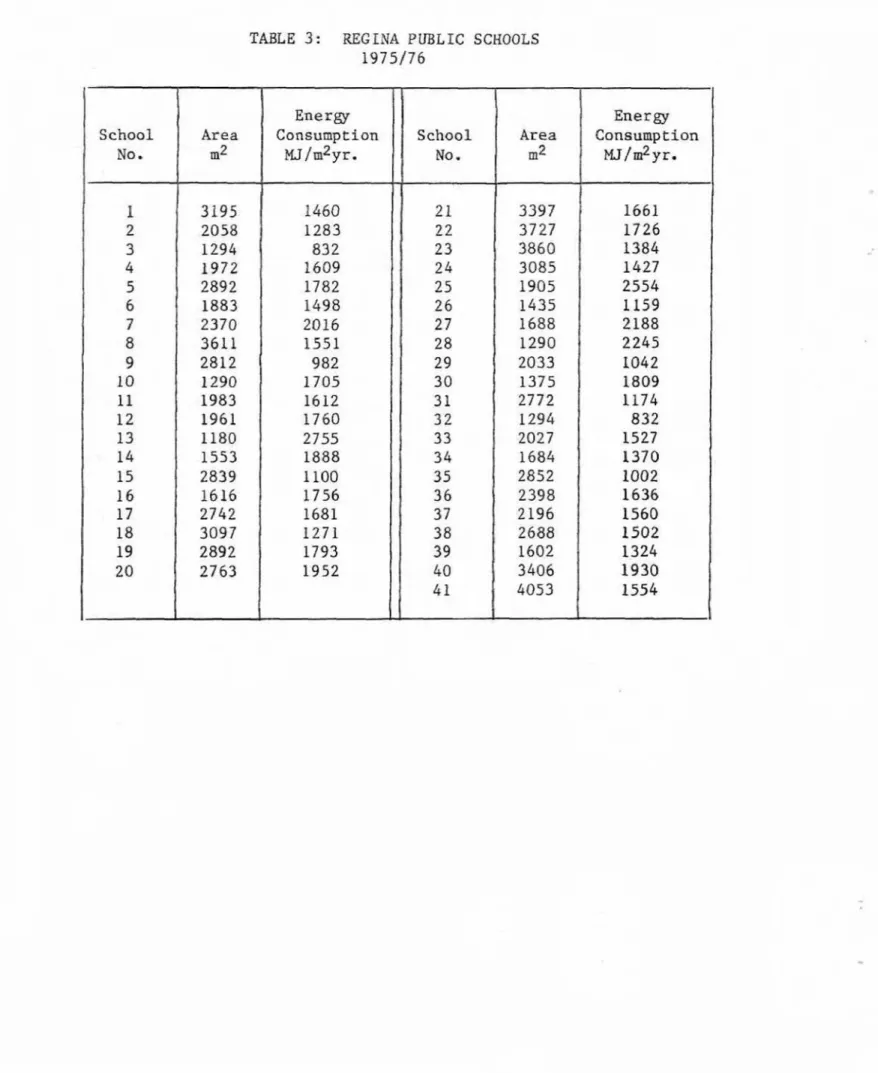
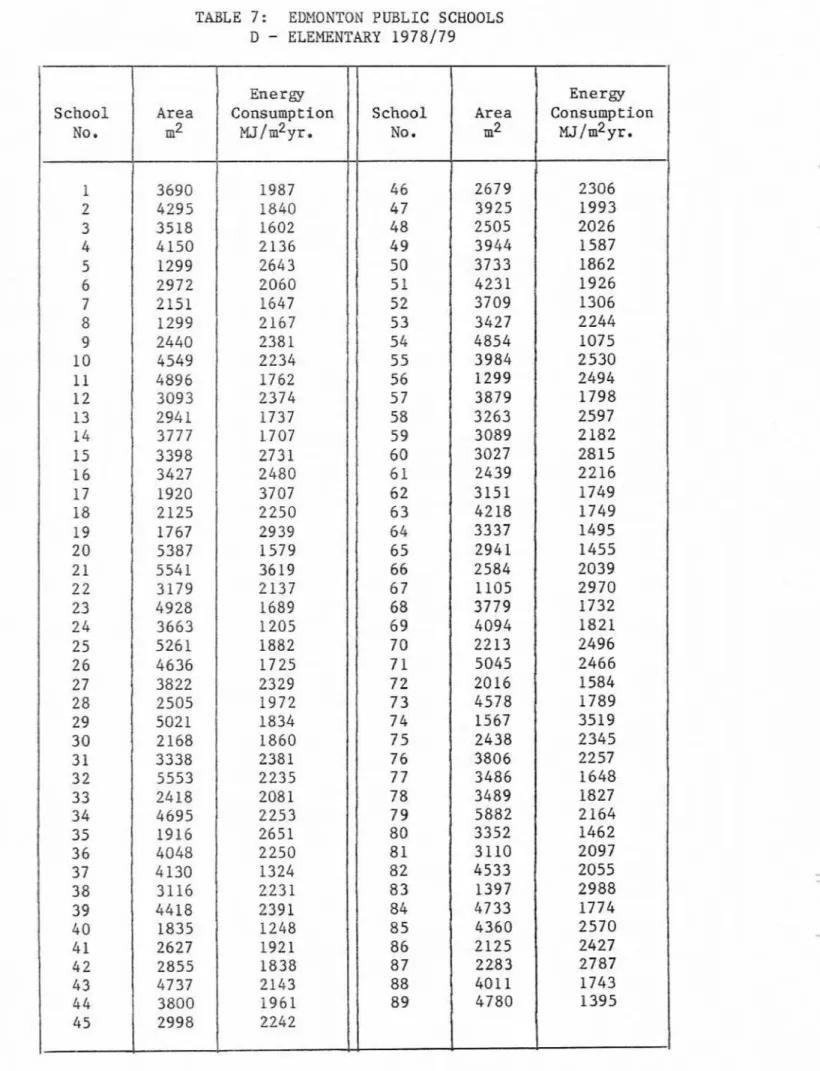
A c o m p l e t e listlng of energy consumption d a t a f o r various schools
and school boards is gPven in Tables 3 rhrough 2 3 . Also, F i g u r e s 1 through 32 show the p l o t s o f energy consumption in ~ ~ J d y r . versus floor area in m2. The vertical a x i s on the right-hand s i d e of each p l o t shows the frequency of occurrence in the corresponding energy consumption b i n s
i n d i c a t e d o n t h e vertical left-hand side of t h e plot.
When
more than one year of data f o r a particular group of schoolsw a s available, a p l o t was added to show a l l changes in energy
consumption greater than o r equal t o 0.3 G J / & ~ ~ . These p l o t s are shown
in Figures 11, 1 7 , 21, 27 and 3 1 .
ACKNOWLEDGEMENT
The author wishes to acknowledge the help provided by various schmf boards i n making the energy ccmsmption data available to the
D i v i s i o n of B u i l d i n g Research. The author a l s o wishes to thank
TAEiLE 2: SUMMXY OF HEATING
DEGREE
DAYSbelow
18"C,
July I - June 30Winnipeg
Int
'
l** (North-Western) OttawaInt'l
(North-Eastern) Toronto I n t '1 IlontrealInt
'
l*
Airport**
I n t e r n a t i o n a l Airport***
EstimatedTABLE 3: REGINA PUBLIC SCHOOLS
TAELE 4 :
EDMONTON
PUBLIC SCHOOLS TABLE5
: EDMONTON PUELIC SCHOOLSA
-
SECONDARY
1978/79
B -JUWIOR
HIGH 1978/79TABLE 6: EDMONTON PUBLIC
SCHOOLS
C - ELEMENTARY AND J U N I O R H I G H 1978179 School NO. 1 2 3 4 5 6 7 8 9 10 11 12 13 1 4 Area m2 18239 13747 26149 37262 1023 1 3999 12759 25120 17880 226 18 18740 3125 38729 21723 Energy Consumption MJ /mPyr. 1628 2650 2 3 4 6 2205 1704 1 3 9 4 2908 2688 2303 2309 2177 205 1 2694 3783TABLE 7:
EDMONTON
PUBLICSCHOOLS
D
-
ELEMENTARY 1978/79
TABLE
8: OTTAWA-CARLETON SECONDARY SCHOOLS I SchoolNo.
1
2 3 4 5 6 7 89
10 1 1 Area m2 16422 1 1729 12100 19061 12427' 20223 9 9 4 4 16970 6143 18773 16636E n e r g y Consump t i o n
w/&
yr.
1978
95
1 95 1 986 862 1216 1105LO64
1096
1540 7 88 1212 1973 1615 15531363
1326 1729 1796 127 1 1384 1348 1251 1728 19741794
1500 1294 1484 1728 1620 127 11395
1162 1279 182 1 1975 1976 134 1L348
1236 1240 1666 16001391
1081 15899
34 1469 1213 1162 8 9 1 942 1 4 14 1484 13101190
1364 7 87 1379TABLE 9 : OTTAWA-CARLETON E L E H E N T M SCHOOLS
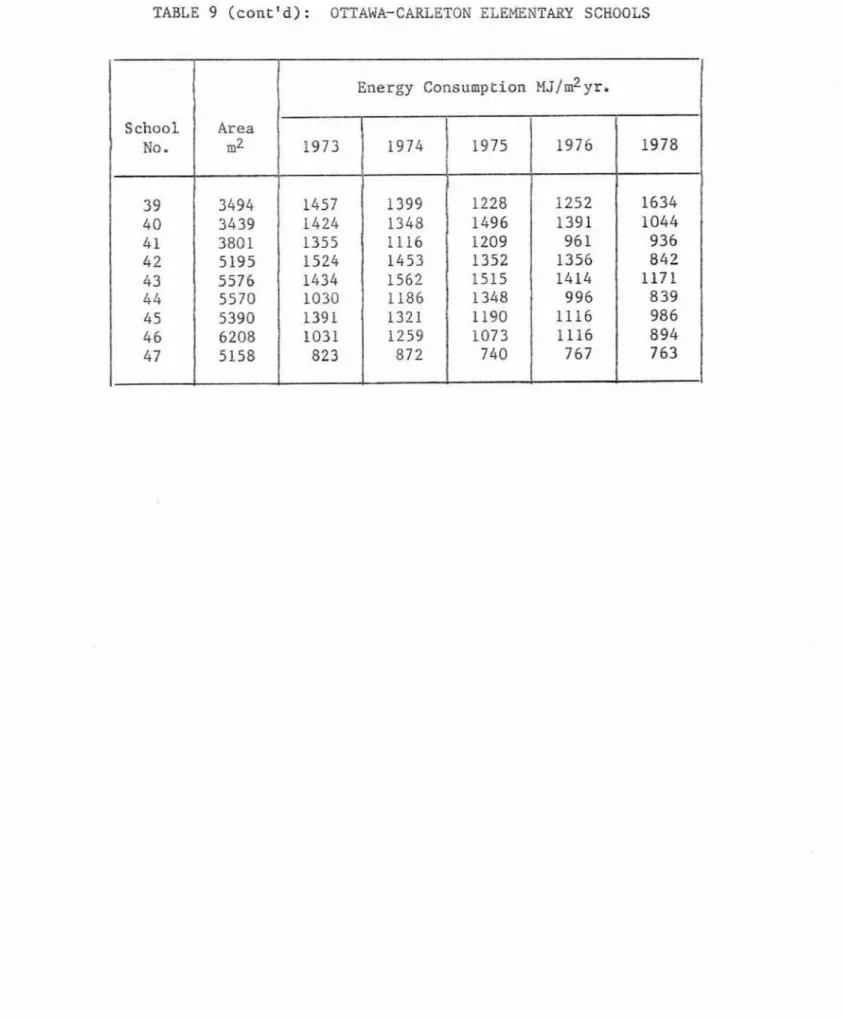
TABLE 9 (cont'd): OTTAWA-CARLETON ELEMENTARY SCHOOLS
S
choalNo.
39 40 4 1 4 2 4 3 4 4 45 4 6 47 Areamz
3494 3439 3801 5195 5576 5570 5390 62085158
Energy Consumption~ ~ / d y r .
1978 16341044
936 842117
E
839 986 894 763 1 9 7 3 1457 1 4 24 1355 I 5 2 4 1434 1030 1391 1031 823 1974 1975 1976 1252 1391 96 1 1356 1414 996 L116 1116 767 I 1399 1348 11 16 1 45
3 1562L
186 1321 1259 872 1228 , 1496 12091352
1515 l 3 4 8 1190 1073 740TABLE
10:
WINNIPEG PUBLIC ELEMENTARY SCHOOLS 1973TABLE 11: WINNIPEG
PUBLIC SECONDARY SCHOOLS
1973 School NO.
1
2 3 4 5 6 7 89
10 1 1 12 13P
4 15 Energy Consumptionw/rnzyr.
1593 Aream2
639
1220 1861 1984 203 1 2033 22002357
2462 2 4 6 3 2560 26672807
2810 3 160 S c h o o lNO.
1 2 1 3 4 5 6 7 8School
NO. 16 Area m2 7462 11632 13598 13886 15602 20781 15234 16357 Energy Consmprion~ ~ l r n ~ ~ r .
13 2 1 9571596
1352 1472 13LO
1879 1717 I Aream2
33 25 891
1906 1236 1810 1 4 5 3 577 1252 1248 1961 1697 1670 L589 1422 1159 Energy Consumption XJ/dyr. 16353537
3764 3 809 3820 3891 3903 4061 4099 4424 4 4 9 8 4674 5807 4 9 5 3 6074 17 18 19 20 2 1 22 2 3 1 24 25 26 27 28 29
301511
I1457
16662666
1182 1763 , 1213 1445 3030 713
1527 lQ15 1046 945TABLE 1 2 ( c o n t - ) :
TORONTO
ELEBENTARY SCHOOLS S c h o o l No. 6 1 6 2 6 3 6 4 6 5 66 6 7 6869
7071
7 273
7 4 7 5 76 7 778
7980
SchoolNo.
Aream2
6682 483716396
5232 5 5 6 7 46L
5 2497 3452 236 2610 1345 3197 9368 4628 6001 6440 10379 10362 8509 547
6 Area u? Energy Consumption w / m 2 y r . 1976177 18 10 1627 1503 1383L
228 1407 lo50 Energy Consumption w / m 2 y r . . 8 1 8 2 83; 84 1977/78 1542 1325 1480 1418 11 12 1333 8 33
1976177 1565 1352 13 10 103 1 8 6 5 4 6562 6884 78711977/78
1724 1484 1426 1209 8586
87 88 89 90 9 1 92 9 3 9 4 9 596
9 7 9899
100 1461 922 1414 2263 1728 1608 1294 1228 127 5 1170 1217 1035 984 7 4905099
1938 10720 883 9 7 6 2151 2290 1042 1325 1143 1542 1275 1190E
182 1004 1201 783 1314 1585 1104 8521658
1639 1186 9 2 7 1 1100 984 12 17 1585 12 131038
876
1058 1228 1066 6 6 3 9541 1608 4060 420 1751
1 6240 4739 4809 7 3 7 9 16830 9 7 066609
1209 1193 1 2 6 3 1438 1410 115 1 1 2 3 2 1275 1174 12838
8 7 787TABLE 15: EASTERN ONTARIO SCEOOL BOARDS
1977/78
TABLE 16: HID-NORTHERN
ONTARIO
SCHOOL BOARDS 1977/78TABLE 17: NORTHFEASTERN
ONTARIO SCHOOL
BOARDS1977178
TABLE
18: NORTH-WESTERNONTARIO SCHOOL BOARDS
1977178TABLE
19:
WESTEWONTARIO
SCHOOL BOARDSTABLE 20: PROTESTANT SCHOOL BOARD OF GREATER MONTREAL
HIGH SCHOOLS
TABLE 21:
PROTESTANT
SCHOOLBOAHI
OF GREATER NONTREAL ELEMENTARY SCHOOLSTABLE 2 1 (cont' d ) : PROTESTANT SCHOOL BQm OF GREATER MONTREAL
TABLE 23: B R I T I S H COLUMBIA
DELTA SCHOOL
DISTRICT NO. 3719
7 7FIGURE
1
REG
l NA
PUBLl
C
SCHOOLS
1975-19716
FIGURE
2
SECONDARY
SCHOOLS
FIGURE 3
JUNIOR-HIGH SCHOOLS
EDMONTON
1978-1979
FIGURE
4ELEMENTARY JUN I
OR-H
I
GH
SCHOOLS
EDMONTON 1978-1979
0 t I I
0 5 10 I5 20
FIGURE
5
ELEMENTARY
SCHOOLS
EDMONTON
1978-1979
Area
rn2
lo3
FIGURE 6
SECONDARY
SCHOOLS
FIGURE 7
SECONDARY
SCHOOLS
OTTAWA-CARLETON 1974
FIGURE
8 SECONDARY SCHOOLS
OTTAWA-CARLETON
1975
-
0-
PJ 9 C 0 O 3 t 0 0-
0 % 0 02
-
C IIE 3 wn
CJ L 5 4-
L"E
'.
I 3 0S
0 o m 0 IL U-
0 Arearn2
10'
.-
-CIe
2 - 3 IR B a MEAN c -d---~~--~---*-~---d---d----4----d---d--- aFIGURE
9
SECONDARY
SCHOOLS
OTTAWA-CARLETON
1976
2
A r e a
m10'
Fl
GURE 10
SECONDARY SCHOOLS
OTTAWA-CARLETON 1978
FI GURE 11 SECONDARY SCHOO
tS
OTTAWA-CARLETON 1973 AND 1978S ~ l e c t e d buildings showing a change i n energy conswrpti on
greotsr tlm 0.3 ~ ~ / r n ' ~ r .
0 Yn73 SAMPLES
+
m7& SAMPLES----
P73 TOTA M E MEAN---
1878 TOTAL SAlulPtE MEANArea
m2
7 0 ~
FIGURE 12
ELEMENTARY
SCHOOLS
OTTAWA-CARLETON
1973
r 0-
9,u
C ID 3 0 U - 0 9- 2 0 h 0 - c P) T 5-
4 - L >. NE
\ 3 - 23 C a -- 4E
2 - 3 0 0 0 O 0 p 0 0 m C 0 0 1 - n . 0 0 Oi?B O MEAN --2--~7---~-~n---u,---..---.F---.---.----..---.---4--- *o 0 0 0 O 0 0 m 0 0 0 I 0 r I .cIFl
GURE
13
ELEMENTARY
SCHOOLS
OTTAWA-CARLETON
1974
Area
m2Fl
GURE
14
ELEMENTARY
SCHOOLS
Fl
GURE
15 ELEMENTARY
SCHOOLS
OTTAWA-CARLETON 1976
Fl CURE 16
ELEMENTARY SCHOOLS
OTTAWA-CARLETON
1978
5 - 4-
L h'E
\=
3 - 3 C 0.-
4 - 0-
aJ
U c blO
k
3 9 0 - 0 rt 0a
X 0 7 c2
' 0 0 0.
7 V3 C 0 WFl 0 0 '8 8 o m ---,-a0*-a0--m--d---d=---4---d--- CP *e; P CI 0 1 * o 0 0 - 0 I 0 rn 0 a, 3 37z
2
-
50 0 , I I I 5 10 15 20 QArea rnZ
loJ
FIGURE 17 MMENTARY SCHOOLS OTTAWA-CARLETON 1973 AND 7378
Selectad buildings showing o c h g e i n energy c p n s y p t i o n greo t a r than 0.3 GJ/m yr.
0 1 8 7 3 ~ E S
+
m78SALPLES,--,1875 , TOTAL w lAUlN ,,, 1978 TOTAL W liEPH
Area
rn2
lo3
Fl
GURE 19
ELEMENTARY
SCHOOLS
TORONTO
1976-1977
FI
GURE
20
ELEMENTARY SCHOOLS
TORONTO 1977-1978
FlGURE 21 ELEMENTARY
SCHOOLS
TORONTO 1976-1978
Selected bundlnge ghbwlng a ehangr I n snargy eonwmptlon z
grwter than 0.3 GJ/m yr.
0 1978-
t
#77SCJQLES, , , , l076 TOTAL W kLAH
,--19n TOTAL ShPLE hEW
1
+I I t: I
5 10 15 20
Area
rn2
10"
Fl
GURE 22
SECONDARY
SCHOOLS
F1
GURE
23
SECONDARY SCHOOLS
TORONTO
1976-1977
Area
m2
Fl
GURE
24 HIGH SCHOOLS
MONTREAL 1976-7977
a-
0-
1 - 28 - I 4 3-
0 2 0 0 0=
Q 0 MEAN 'm---,_-__-m---d---d--d----_~-~---d----d---d----.---d---. O 8 $ o 0 0 0 0 0 0 D P 20 30 40 50 60 0 10 1-
0 0 I I I I rFl
GURE 25
H I G H
SCHOOLS
MONTREAL 1977-1978
FIGURE
26 HIGH SCHOOLS
MONTREAL 1978-1979
0 B MEAN 0 0 - - - m - - - d - - - * - - - M - - - & - - - 0 0 0 0: 0 0 0 I 1 I L I I I 0 5 10 15 20 25 30 35 - 0 - 0 - 0-
7 14 40Fl GURE ,27 H 1 43-l SCHOOLS MONTREAL 1976-1979
Selected buildings ahoalng n
change i n energy c o n a u p t l on greater thun OJ W/rn yr.
O 7R78 SA-
+ P78 SAM-
,,,- em TOTAL SAMPLE MEAN ,-la78 TOTAL -SAMPLE MEAN
Area rn'
70'
Fl
GURE
28 ELEMENTARY
SCHOOLS
Fl
GURE
29
ELEMENTARY SCHOOLS
MONTREAL 1977-1978
Fl
GURE 30 ELEMENTARY SCHOOLS
MONTREAL 1978-1979
Fl GURE 31 ELEMENTARY SCHOOLS MONTREAL 1976/77 AND 1978/79
Selected buildings showing o change i n energy cansump ti on
2
g r e a t e r t h n n 0.3 G S / ~ yr.
0 1976 SAMPLES
I978 SAMPLES
----, 197B TOTAL SAMPLE MEAFI! ,
,
, 1878 TOTAL SAhPLE MEAN