Publisher’s version / Version de l'éditeur:
Canadian Journal of Civil Engineering, 10, April 2, pp. 185-191, 1983-04-01
READ THESE TERMS AND CONDITIONS CAREFULLY BEFORE USING THIS WEBSITE. https://nrc-publications.canada.ca/eng/copyright
Vous avez des questions? Nous pouvons vous aider. Pour communiquer directement avec un auteur, consultez la première page de la revue dans laquelle son article a été publié afin de trouver ses coordonnées. Si vous n’arrivez pas à les repérer, communiquez avec nous à PublicationsArchive-ArchivesPublications@nrc-cnrc.gc.ca.
Questions? Contact the NRC Publications Archive team at
PublicationsArchive-ArchivesPublications@nrc-cnrc.gc.ca. If you wish to email the authors directly, please see the first page of the publication for their contact information.
NRC Publications Archive
Archives des publications du CNRC
This publication could be one of several versions: author’s original, accepted manuscript or the publisher’s version. / La version de cette publication peut être l’une des suivantes : la version prépublication de l’auteur, la version acceptée du manuscrit ou la version de l’éditeur.
Access and use of this website and the material on it are subject to the Terms and Conditions set forth at
Dynamic live loads at a rock concert
Pernica, G.
https://publications-cnrc.canada.ca/fra/droits
L’accès à ce site Web et l’utilisation de son contenu sont assujettis aux conditions présentées dans le site LISEZ CES CONDITIONS ATTENTIVEMENT AVANT D’UTILISER CE SITE WEB.
NRC Publications Record / Notice d'Archives des publications de CNRC:
https://nrc-publications.canada.ca/eng/view/object/?id=abe7c6ac-21bb-4988-877e-fdc8f5f7fbb6 https://publications-cnrc.canada.ca/fra/voir/objet/?id=abe7c6ac-21bb-4988-877e-fdc8f5f7fbb6I Ser I
TH1
N21d
no.
1111
c . 2BLDG
DYNAMIC LIVE LOADS A T A ROCK CONCERT
by G. Pernica
I
ANALYZED
Reprinted from
Canadian Journal of Civil Engineering
Volume 10, No. 2,1983
p.
185- 191
I
DBR Paper No. 11 1 1
Division of Building Research
Price $1.00
OTTAWA
T R C-
C I S T I-
7RLDC. RES.
L I B R A R Y
NRCC 22435
Pendant un c o n c e r t d e rock d e
3 h t e n u dans une a r & a , on
a effectu'e d e s mesures d e s v i b r a t i o n s pour dstermlner
l ' e f f e t d e s r h c t i o n s d e l ' a u d i t o i r e s u r l e comportement
dynamique d'une s u r f a c e a y a n t une f r'equence f ondamentale
i n f ' e r i e u r e B
5
Hz.
C e t t e s u r f a c e , q u i r e p o s a i t s u r d e s
p o u t r e s pr'efabriqu'ees e n b s t on pr'econtraint, 6 t a i t sournise
pgriodiquement
d e s battements d e p i e d s
e t
d e mains
3
d e s
fr'equences d e r s p g t i t i o n comprises e n t r e
2
e t 3
Hz.
On t r o u v e r a une pr'esentation d e s ph"eno&nes de rgsonnance
e t
d e quasi-rgsonnance q u i e n o n t rhult'es:
d e s
s u r c h a r g e s dynamiques o n t 6 t 6 calcul'ee
s e t
compar'ees
,
a i n s i que
les
s u r c h a r g e s s t a t i q u e s , aux v a l e u r s d e c a l c u l
p r e s c r i t e s dans l e Code n a t i o n a l du batiment.
Reprinted from
Canadian
Journal of
Civil Engineering
Reimpression du
Revue
canadienne de
genie civil
Dynamic live loads at a rock concert
G . PERNICA
Volume 10
Number 2
1983
Pages 185- 191
Nat~onal Research Consell nat~onal
I*
Counc~l Canada de recherches CanadaPnntcr! m Canada by K G Campbell Corpomoon
Dynamic
live loads at a rock concert
G . PERNICADivision of Building Research, National Research Council of Canada, Ottawa, Ont., Canada K I A OR6 Received April 30, 1982
Revised manuscript accepted January 4, 1983
Vibration measurements have been taken in a sports arena during a 3 h rock concert to determine the effect of audience
response on the dynamic behaviour of a stand area having a fundamental frequency below 5 Hz. The stand area, consisting
of precast, prestressed concrete beams, was subjected to intervals of foot stamping and hand clapping at repetition frequencies
between 2 and 3 Hz.
Amplitudes of the resulting resonant and near-resonant behaviour are presented; dynamic live loads are calculated and together with static live loads are compared with design loads specified in the National Building Code of Canada.
Can. 1. Civ. Eng. 10, 185-191 (1983)
Introduction
Sentence 4.1.6.3( 1) of the National Building Code of
Canada ( 1 9 8 0 ~ ) specifies a static live load of 4.8
kN/m2 (100 psf) for the design of floors or stands in active assemblv areas such as arenas or stadia. Al- though this value has not changed over several decades, floor systems designed to support such loads have changed. Floors have become lighter and more flexible with the introduction of higher strength materials, in-
,
creased spans, and improved design and analysis tech-niques. It is not uncommon today for existing floors or stands in active assembly areas to have fundamental
I frequencies less than 5 Hz and to weigh less than 4.8
!
kN/m2 (100 psf). Unfortunately, such floors are sus-I
ceptible to resonant or near-resonant behaviour as a result of audience response during musical per-
, formances and sporting events. Audiences can easily
'
produce rhythmic, impulsive forces with repetition fre-
I
quencies in the 1-3 Hz range by foot stamping or handI
clapping in time to music at a concert or in unison withcheers at a sporting event. Such forces can last several minutes and in floors possessing low fundamental fre- quencies can cause a build-up of vibrations that could conceivably result in damage to the structure. Because of this possibility, Commentary A on Part 4 of the National Building Code of Canada (1980b) has recom- mended since 1975 that fundamental frequencies less
than about 5 Hz be avoided for the design of floors in
active assembly occupancies. Nevertheless, it is not always possible for the designer to adhere to this recom- mendation because of economic and architectural con- straints. When these constraints are present, it might be prudent to assume a larger live load in design in order to account for substantial increases that might occur in the dynamic component of the live load as a result of resonant or near-resonant behaviour. Unfortunately, there is little information available on the magnitude of these dynamic effects (Irwin 1981). Until there is, it will be extremely difficult, if not impossible, to assess
the adequacy of the 4.8 kN/m2 (100 psf) design live load for each active occupancy structure that possesses a low fundamental frequency.
This paper gives further information on these dynam- ic effects. The magnitude of dynamic live loads and the amplitudes of resonant and near-resonant behaviour during a single rock concert at a sports arena are presented for one stand area having a fundamental fre-
quency below 5 Hz.
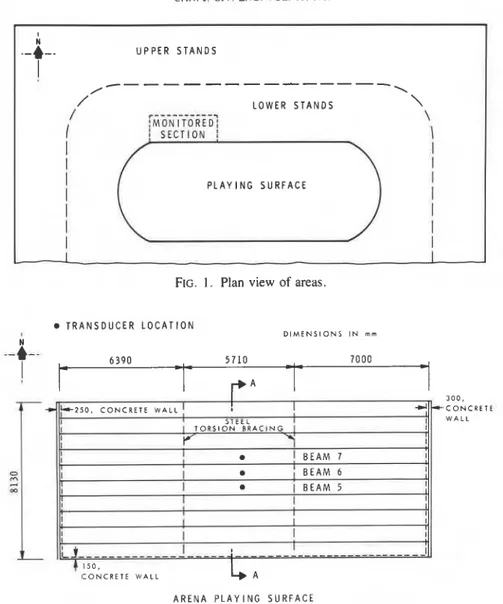
The study was undertaken at the instigation of the owner, who wished to determine whether some of the concrete beams comprising the lower stands (Fig. I ) were being severely stressed by audience response during rock concerts. The beams supported rows of steel-framed wooden seats with backs, and in turn were supported by concrete shear walls. During the previous year the arena had experienced a large increase in the number of rock concert performances. For most of them, hand clapping and foot stamping in unison by the entire audience to songs having a very pronounced and easy to follow beat had produced motions within some sections of the lower stands that were not only readily felt by arena personnel but were also visible to the naked eye. This suggested that the audience had produced and could readily produce resonant or near- resonant behaviour within the concrete beams com- prising the lower stands. With the hope of recording and witnessing such dynamic behaviour, vibration measurements were taken at the next rock concert performance. Arena staff commented after the performance that the concert had produced one of the largest sets of stand vibrations they had ever felt or seen; the performance had also attracted one of the largest audiences ever to witness a rock concert at the arena.
Stand description
Vibration measurements were taken in a section of the lower stands adjacent to the arena playing surface
CAN. J. CIV. ENG. VOL. 10. 1983 ;t U P P E R S T A N D S
I
/ /---
I \ / ,.-*----*-..-- L O W E R S T A N D S\
/ : M O N I T O R E O ; \1
I S E C T I O N1
I
1
I
I
P L A Y I N G S U R F A C EI
I
I
I
I
I
FIG. 1 . Plan view of areas.
T R A N S D U C E R L O C A T I O N
D I M E N S I O N S I N m m
I 300,
k - 2 5 0 . CONCRETE WALL I -d *CONCRETE
S T E E L I
I.
WALL I TORSION BRACING I 1 r' Y I I I I 1 I I I I!
B E A M 7 1 L 0 II
B E A M 6 I * L-
$1 I I I a [ B E A M 5 m I L I I I 1 I L 1 I I I I k----
--
-- - -
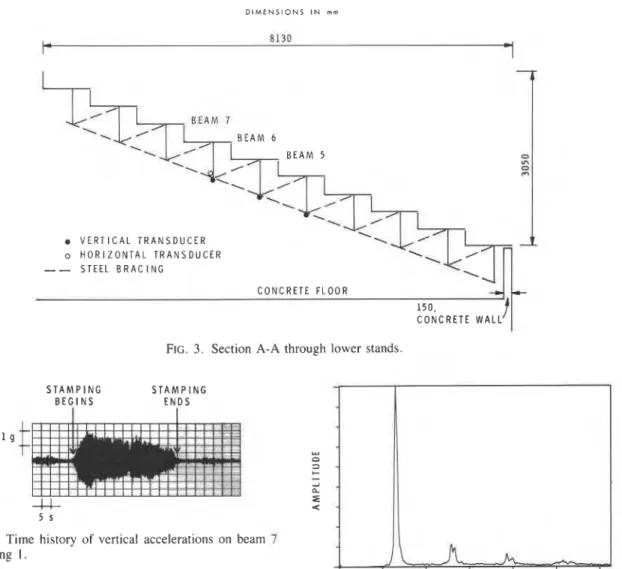
I CONCRETE WALL A A R E N A P L A Y I N G S U R F A C EFIG. 2. Structural layout of monitored section of lower stands.
(Fig. I). The 10 simply supported, precast, prestressed concrete beams in this section have a clear span of 18.8 m (61 ft 9 in.) between cast-in-place concrete shear walls (Fig. 2) and a cross section as shown in Fig. 3. The asymmetrical concrete beams are restrained from twisting during bending at two locations (Fig. 2) by steel bracing (torsion bracing) whose configuration is shown in Fig. 3.
Measurement procedure and data analysis
Measurements were taken at the mid-span of three consecutive concrete beams (beams 5, 6, and 7) by means of accelerometers fastened to the underside of the beams (Figs. 2 and 3). Measurements were taken in the vertical direction on all three beams and in the horizontal direction perpendicular to the span direction
on beam 7, which is the farthest of the three beams from the arena playing surface. Outputs from the acceler- ometers were appropriately amplified and low-pass fil- tered at 50 Hz before being recorded on a four-channel tape recorder. The vibrations of the beams were con- tinuously recorded throughout the 3 h rock concert. During this time approximately 25 songs were played to an audience that for the most part remained seated even during sessions of foot stamping and hand clapping. For most of the concert the monitored section of the lower stands was completely full of people, including the aisles, which were used by the audience as additional prime seating space close to the performers.
The accelerometer records were displayed on an os- cillograph in order to obtain a complete visual record of the vibrations of the beams during the 3 h concert.
PERNICA DIMENSIONS I N m m B E A M 6 V E R T I C A L T R A N S D U C E R o H O R I Z O N T A L T R A N S D U C E R
--
S T E E L B R A C I N G-
\ C O N C R E T E F L O O RJ L -
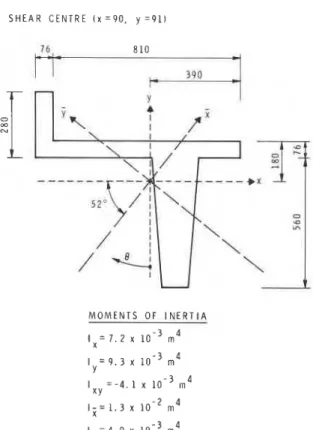
150, C O N C R E T E W A L L FIG. 3. Section A-A through lower stands.S T A M P I N G S T A M P I N G
B E G I N S E N D S
FIG. 4. Time history of vertical accelerations on beam 7 during song I.
Except during songs accompanied by foot stamping and hand clapping, peak vibration amplitudes rarely ex- ceeded 1% g. On the other hand, those produced by stamping/clapping continuously exceeded I % g. Stamping/clapping records that were continuously larger than 2% g for 30 s or more were analysed on a spectrum analyser. The same records were then low-pass filtered at approximately 1.5 times the most dominant spectral frequency (repetition or stamping frequency) and re-displayed on the oscillograph using an expanded time scale in order to obtain for each transducer the maximum peak amplitude of vibration at the stamping frequency and the number of occurrences or cycles of peak vibration amplitudes in 5% g acceler- ation intervals.
A typical time history of the vibrations produced by
12
F R E Q U E N C Y , H z
FIG. 5 . Fourier amplitude spectrum of vertical acceler- ations on beam 7 during song 1 .
tral frequency, 2.60 Hz, is the stamping frequency; the smaller spectral peaks occur at the harmonics. A seg- ment of the time history, low-pass filtered at 1.5 times the stamping frequency, is shown in Fig. 6 using an expanded time scale.
Vibrations produced by random audience movement during calm periods, for example during intervals be- tween songs, songs without foot stamping or hand clapping, were also analysed in a spectrum analyser to determine the natural frequencies of this section of the lower stands under full live load.
stamping/clapping is given in Fig. 4. Only the en-
velope of the peak amplitudes is evident because of the Results
compressed time scale. Figure 5 contains the Fourier Spectra of vibrations recorded during calm periods amplitude spectrum of this record. The dominant spec- suggest that there are four modes with frequencies less
188 CAN. I. CIV. E :NG. VOL. 10. 1983
S T A M P I N G I
B E G I N S
FIG. 6. Time history of vertical accelerations on beam 7 during song 1 low-pass filtered at 4.0 Hz.
D I M E N S I O N S I N m m
S H E A R C E N T R E I x = 9 0 , y = 9 1 1
M O M E N T S O F I N E R T I A
I x = 7 . 2 x m 4
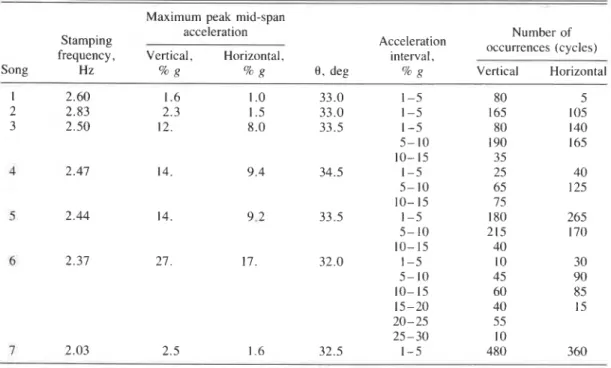
FIG. 7. Physical properties of concrete beam
than 3 Hz: 2.38, 2.58, 2.73, and 2.97 Hz. Each of the four modes appears, from results obtaified from beam 7 (magnitude and phase of vertical and horizontal mo- tions), to be associated primarily with bending about the weak principal centroidal axis, j (Fig. 7). Mode shapes for the lower stands could not be determined from existing experimental data. Neglecting torsional effects and assuming ( 1 ) that the beam is simply sup- ported at the shear walls, (2) that the concrete modulus of elasticity is 3.7 X 10"Pa (5.3 x l O6 psi), and (3)
that each seat is occupied, the calculated fundamental bending frequency about the weak centroidal axis is 2.2 Hz. Dimensions, moments of inertia, principal centroi- dal axes, and the location of the shear centre of the
asymmetrical concrete beam are given in Fig. 7. Foot stamping and hand clapping during seven songs produced peak vibration amplitudes (at the stamping frequency) that continuously exceeded I % g for 30 s or more. Table 1 contains the stamping/clapping fre- quency and the maximum peak mid-span accelerations at the stamping frequency recorded on beams 5, 6 , and 7 during each of the seven songs. Maximum peak accel- erations for each song occurred simultaneously. These results together with phase relation obtained from the visual oscillograph records suggest that, at the stamping frequencies, the dynamic shape of the monitored sec- tion of the lower stands perpendicular to the beam direc- tion is dish-shaped and symmetrical about the two cen- tral beams (beams 5 and 6), with maximum movement occurring at the two central beams.
During one of the seven songs, song 6 , the stamping frequency coincided with the fundamental frequency to produce the maximum peak accelerations recorded dur- ing the concert: for beam 7, 27% g in the vertical and 17% g in the horizontal directions at 2.37 Hz. These
accelerations would be considered "extremely
unpleasant" to "intolerable" on the Dieckmann K-value scale and from I S 0 263 1 - 1974(E) (International Stan- dard I S 0 2631-1974(E), 1974) have an "exposure limit" of about 2 h. During the same song, peak vertical and horizontal accelerations at 2.37 Hz continuously exceeded 5% g , the unpleasant range on the Dieckmann scale, for well over 1 min. From the build-up rate and the decay rate of the resonant response for the three beams the fundamental damping ratio of this section of the lower stands (with all seats occupied) was estimated to be 4.5%.
Maximum peak vertical and horizontal accelerations for beam 7 are repeated in Table 2. Angle 0 (Fig. 7) of the resultant maximum motion, measured clockwise from the negative y-axis, is shown in Table 2, rounded to the nearest 0.5 deg. For the seven songs shown in Table 2, 0 falls between 24 deg, the value calculated for a static uniformly distributed load applied vertically to the beam through its shear centre, and 38 deg, the value calculated for pure bending about the weak centroidal axis, j . This result, together with the slight variation of
0 with stamping frequency, suggests that although most of the motion of the beam is associated with bending about the j axis, pure bending about the j does not take place even at resonance (song 6).
The number of occurrences (cycles) of peak vertical and horizontal accelerations in 5% g acceleration inter- vals for beam 7 are also given in Table 2. Although the majority are for accelerations less than 5% g , as one would expect, there are over 3 15 occurrences of beam accelerations greater than 10% g and over 65 occur- rences greater than 20% g , all at frequencies below 3 Hz.
PERNICA
TABLE I . Maximum peak mid-span accelerations recorded on beams 5 . 6 and 7
Maximum peak mid-span acceleration, % g
Stamping Beam 7
frequency, Beam 5, Beam 6,
Song Hz vertical vertical Vertical Horizontal
TABLE 2. Peak vertical and horizontal mid-span accelerations on beam 7 Maximum peak mid-span
acceleration Stamping
frequency, Vertical, Horizontal,
Number of Acceleration occurrences (cycles)
interval.
- .
Song Hz % R 5% R 0 , deg % g Vertical Horizontal
Calculation of total live load
The total live load is the sum of the static live load, which is the load produced by the weight of all spec- tators sitting on the beam, plus the amplitude of the dynamic live load. Within this paper the latter is the static load that produces approximately the same de- flected shape of the beam as the rhythmic, impulsive forces generated by the audience. Dynamic live loads for each of the seven songs that produced large ampli- tude vibrations were calculated only for beam 7, since horizontal accelerations were not recorded on the other two beams.
Static live load
The static live load for beam 7 was estimated to be
1.5 kN/m' (32 psf). This is the load obtained by as- suming that all seats and aisle space on the beam were occupied and that the average weight per spectator was 68 kg (140 Ib).
Dynamic live load
Because the monitored section of the lower stands was completely full of spectators, the rhythmic, im- pulsive forces produced by the audience during foot stamping sessions were assumed to be uniformly dis- tributed along the beam. As a result, dynamic live loads were calculated by assuming that the static loads were also uniformly distributed along beam 7. The amplitude of each uniformly distributed static load (dynamic live
190 CAN. I. CIV. ENG. VOL. 10. 1983
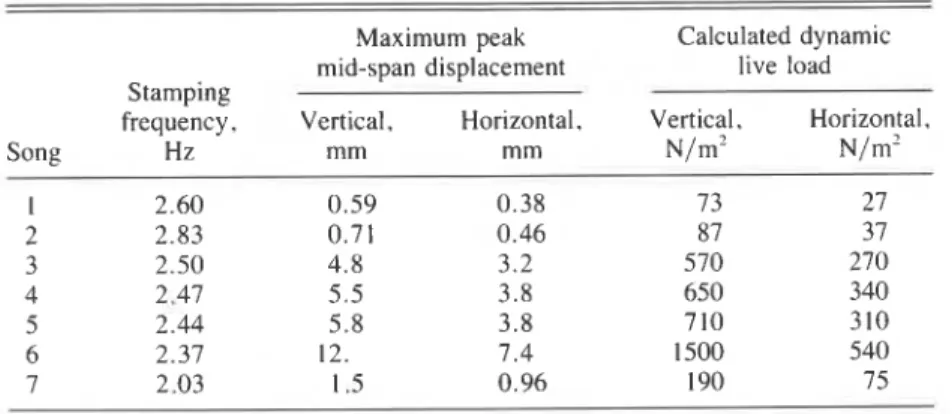
TABLE 3. Calculated dynamic live loads for beam 7
Maximum peak Calculated dynamic
mid-span displacement live load
Stamping
frequency, Vertical, Horizontal. Vertical, Horizontal,
Song Hz mm mm N/m' N/m2
load) was determined from the maximum peak dynamic midspan deflection, assuming that beam 7 was simply supported by the concrete shear walls, that torsional bracing prevented the beam from twisting, and that the dynamic shape of the deflected beam about a principal centroidal axis was
[ I ] d(x,t)
-
- U D L x ( ~ j - 2 ~ x 1+
x3) sin 2npt24 EI
where d(x,t) is the deflected shape in millimetres (in.), UDL is the amplitude of the uniformly distributed dy- namic live load in kN/m (Ib/in.), E is the modulus of elasticity in MPa (psi), I is the principal moment of inertia in mmvin.'), L is the span in millimetres (in.), and p is the stamping/clapping frequency in Hz.
From [ I ] the uniformly distributed load required to produce a maximum peak mid-span deflection, 6 about a principal centroidal axis is
384(EI)6
[2] UDL =
-
5 L"
Maximum peak mid-span deflections were calculated from maximum peak mid-span accelerations, assuming harmonic motion at frequency p. Principal moments of inertia (Fig. 7) and a modulus of elasticity of 3.7 x lo4 MPa (5.3 X 10⁶ psi) were used in 121. Vertical and
horizontal dynamic live loads (Table 3) were obtained by transforming the dynamic live loads calculated for the principal centroidal axes from (21 to the vertical and horizontal axes. These loads are probably about 10% less than the maxima that would have been obtained for each song in this section of the lower stands had hori- zontal accelerations been recorded on beams 5 and 6. The maximum dynamic live loads for beam 7 were obtained for song 6: 1.5 kN/m2 (32 psf) in the vertical direction and 0.54 kN/m2 ( I 1 psf) in the horizontal
direction. The maximum total vertical live load for beam 7 was therefore 3.0 kN/m2 (64 psf), which is
considerably below the 4.8 kN/m2 (I00 psf) design live load.
Discussion and summary
Of approximately 25 songs played during a 3 h rock concert about 12 were accompanied by hand clapping and foot stamping, and 7 of the 12 produced peak ver- tical harmonic accelerations in the stands that con- tinuously exceeded 1% g for at least 30 s. Each of the 12 songs had a stamping/clapping frequency between 2 and 3 Hz. The average, and what appears to be the frequency most susceptible to audience participation, was 2.5 Hz.
During song 6 resonance of the stands occurred. Maximum peak accelerations of 0.30 g in the vertical direction and 0.17 g in the horizontal direction at a frequency of 2.37 Hz were recorded. The calculated vertical dynamic live load during this song was 1.5 kN/m2 (32 psf), which is the same as the estimated static live load. Under existing occupancy conditions within the arena 1.5 k ~ / m ~ (32 psf) is probably the maximum static live load for this floor system, since the number of seated spectators per beam is effectively controlled by the presence of seats with arm rests and backs. As a result, it seems very unlikely that the total live load will ever exceed the design live load of 4.8 kN/m2 (100 psf); resonant accelerations would have to double for this to occur.
For songs 3-6, vibrations produced by the audience could be readily seen since maximum peak-to-peak re- sultant displacements were 12 mm (0.5 in.) or greater. Only at these extremely large dynamic amplitudes did the audience appear to be aware of the vibrations to which they were being subjected.
Acknowledgement
This paper is
a
contribution from the Division of Building Research, National Research Council of Canada, and is published with the approval of the Director of the Division.PERNICA 191
IRWIN, A. W. 1981. Live load and dynamic response of the Committee on the National Building Code, National Re- extendable front bays of the Playhouse Theatre, Edinburgh search Council of Canada, Ottawa, Ont., NRCC No. during 'The Who' concert. BSI Document No. 8 1
/
1 1560. 17303.INTERNATIONAL STANDARD I S 0 263 1 - 1974(E). 1974. Guide - 1980b. Supplement to the national building code of for the evaluation of the human exposure to whole-body Canada. Associate committee on the National Building vibration. Code, National Research Council of Canada, Ottawa, NBC. 1 9 8 0 ~ . National building code of Canada. Associate Ont., NRCC No. 17724.
I
This publication i s being d i s t r i b u t e d by the Divieion of Building R e s e a r c h of the National R e s e a r c h Council of Canada. I t should not be reproduced in whole o r in p a r t without p e r m i s e i o n of the original publisher. The Di- vision would b e glad t o b e of a e e i e t a n c e i n obtaining
s u c h permiseion.
Publications of the Division m a y b e obtained by m a i l - ing the a p p r o p r i a t e r e m i t t a n c e ( a Bank, Expreee, o r P o s t Office Money O r d e r , o r a cheque, m a d e payable to the R e c e i v e r G e n e r a l of Canada, c r e d i t NRG) to the National R e s e a r c h Council of Canada, Ottawa. K1A OR6. Stamps a r e not acceptable.
A l i s t of a l l publications of the Division i s available and m a y be obtained f r o m the Publications Section, Division of Building R e s e a r c h , National R e s e a r c h Council of Canada. Ottawa. KIA OR 6.