HAL Id: inserm-03223339
https://www.hal.inserm.fr/inserm-03223339
Submitted on 10 May 2021
HAL is a multi-disciplinary open access
archive for the deposit and dissemination of
sci-entific research documents, whether they are
pub-lished or not. The documents may come from
teaching and research institutions in France or
abroad, or from public or private research centers.
L’archive ouverte pluridisciplinaire HAL, est
destinée au dépôt et à la diffusion de documents
scientifiques de niveau recherche, publiés ou non,
émanant des établissements d’enseignement et de
recherche français ou étrangers, des laboratoires
publics ou privés.
Controlling for lesions, kinematics and physiological
noise: impact on fMRI results of spastic post-stroke
patients
Nabila Brihmat, Kader Boulanouar, Robert Darmana, Arnauld Biganzoli, D.
Gasq, Evelyne Castel-Lacanal, Philippe Marque, Isabelle Loubinoux
To cite this version:
Nabila Brihmat, Kader Boulanouar, Robert Darmana, Arnauld Biganzoli, D. Gasq, et al.. Controlling
for lesions, kinematics and physiological noise: impact on fMRI results of spastic post-stroke patients.
MethodsX, Elsevier, 2020, 7, pp.101056. �10.1016/j.mex.2020.101056�. �inserm-03223339�
ContentslistsavailableatScienceDirect
MethodsX
journal homepage:www.elsevier.com/locate/mex
Method
Article
Controlling
for
lesions,
kinematics
and
physiological
noise:
impact
on
fMRI
results
of
spastic
post-stroke
patients
Nabila
Brihmat
a,∗,
Kader
Boulanouar
a,
Robert
Darmana
a,
Arnauld
Biganzoli
a,
David
Gasq
a,b,
Evelyne
Castel-Lacanal
a,c,
Philippe
Marque
a,c,
Isabelle
Loubinoux
aa ToNIC, Toulouse NeuroImaging Center, Université de Toulouse, Inserm, UPS, France
b University Hospital of Toulouse, Department of Functional & Physiological Explorations, Toulouse, France c University Hospital of Toulouse, Department of Rehabilitation and Physical Medicine, Toulouse, France
abstract
Functional magneticresonance imaging(fMRI)isawidelyusedtechniqueforassessingbrainfunctioninboth healthy and pathologicalpopulations. Some factors, suchas motion, physiologicalnoise and lesionpresence, can contributeto signalchange andconfound thefMRIdata, butfMRIdataprocessingtechniqueshave been developed to correct for these confounding effects. Fifteen spastic subacute stroke patients underwent fMRI while performing ahighlycontrolled task(i.e. passiveextension oftheir affectedand unaffectedwrists). We investigated theimpactonactivationmapsoflesionmaskingduringpreprocessingand first-andsecond-level analyses, and ofadding wrist extension amplitudesand physiological dataas regressorsusing the Statistical ParametricMappingtoolbox(SPM12).
Weobservedasignificantdecreaseinsensorimotorregionactivationaftertheadditionoflesionmasksand movement/physiologicalregressorsduringtheprocessingofstrokepatients’fMRIdata.Ourresultsdemonstrate that:
• The unifiedsegmentation routine resultsin good normalizationaccuracy when dealing withstroke lesions regardlessoftheirsize;
• Addingagrouplesionmaskduringthesecond-levelanalysisseemstobeasuitableoptionwhennoneofthe patientshavelesionsintargetregions.Otherwise,nomaskingisacceptable;
• Movementamplitudeisasignificantcontributortothesensorimotoractivationobservedduringpassivewrist extensioninspasticstrokepatients;
∗ Corresponding author at: Nabila BRIHMAT, UMR 1214 – INSERM/UPS – ToNIC, Toulouse NeuroImaging Center, Hôpital
Purpan - Pavillon Baudot, 31024 Toulouse Cedex 3, France
E-mail addresses: nabila.br1812@gmail.com (N. Brihmat), kader.boulanouar@inserm.fr (K. Boulanouar), robert.dermana@inserm.fr (R. Darmana), arnauld.biganzoli@inserm.fr (A. Biganzoli), gasq.d@chu-toulouse.fr (D. Gasq), castel-lacanal.e@chu-toulouse.fr (E. Castel-Lacanal), marque.ph@chu-toulouse.fr (P. Marque), isabelle.loubinoux@inserm.fr (I. Loubinoux).
https://doi.org/10.1016/j.mex.2020.101056
2215-0161/© 2020 The Authors. Published by Elsevier B.V. This is an open access article under the CC BY license ( http://creativecommons.org/licenses/by/4.0/ )
• Movementfeaturesandphysiologicalnoisearerelevantfactorswheninterpretingforsensorimotoractivation instudiesofthemotorsysteminpatientswithbrainlesions.Theycanbeaddedasnuisancecovariatesduring largepatientgroups’analyses.
© 2020TheAuthors.PublishedbyElsevierB.V. ThisisanopenaccessarticleundertheCCBYlicense(http://creativecommons.org/licenses/by/4.0/) article info
Method name: Testing the effect of different fMRI data processing strategies using SPM12 toolbox:
•Effect of lesion masking during fMRI data preprocessing
•Addition of lesion mask during first-level analysis
•Addition of group lesion mask during second-level analysis
•Addition of wrist extension amplitudes and/or physiological noise data as regressors during first-level analysis
Keywords: Stroke, fMRI, Data processing, Motor task, Lesion masking, Physiological noise, Movement amplitude
Article history: Received 6 June 2019; Accepted 1 September 2020; Available online 9 September 2020
Specificationstable
Subject area: Neuroscience
More specific subject area:
Neuroscience Methodology
Addressing important issues in the analysis of stroke patients’ fMRI data and refining the processing routine.
Method name: Testing the effect of different fMRI data processing strategies using SPM12 toolbox:
• Effect of lesion masking during fMRI data preprocessing
• Addition of lesion mask during first-level analysis
• Addition of group lesion mask during second-level analysis
• Addition of wrist extension amplitudes and/or physiological noise data as regressors during
first-level analysis Name and reference of
original method: Lesion masking Brett, M. Spatial Normalization of Brain Images with Focal Lesions Using Cost Function Masking. Neuroimage 14, 486–500 (2001).
Ashburner, J. & Friston, K. J. Unified segmentation. Neuroimage 26, 839–851 (2005). Modelling of cardiovascular noise
Kasper, L. et al. The PhysIO Toolbox for Modeling Physiological Noise in fMRI Data. J.
Neurosci. Methods 276, 56–72 (2017). Effect of movement kinematics
Casellato, C. et al. Simultaneous measurements of kinematics and fMRI: compatibility assessment and case report on recovery evaluation of one stroke patient. J. Neuroeng. Rehabil. 7, 49 (2010).
Waldvogel, D., van Gelderen, P., Ishii, K. & Hallett, M. The effect of movement amplitude on ctivation in functional magnetic resonance imaging studies. J. Cereb. Blood Flow Metab. 19, 1209–1212 (1999).
Resource availability: MRIcron software (Rorden and Brett, 20 0 0; http://www.sph.sc.edu/comd/rorden/mricron/ )
SPM12 (Wellcome Trust Centre for Neuroimaging, London, UK; http://www.fil.ion.ucl.ac.uk/spm/ )
PhysIO Toolbox (Kasper et al., 2017;
http://www.translationalneuromodeling.org/tnu-checkphysretroicor-toolbox/ ) Labview program (Elliott et al., 2007; http://sine.ni.com/psp/app/doc/p/id/psp-357 ) OpenSesame Stimulation program (Mathôt et al., 2012; https://osdoc.cogsci.nl/3.2/download/ ) xjview slice rendering ( http://www.alivelearn.net/xjview )
Methoddetails
Rationale
fMRI isbasedon thedetectionofsubtlehemodynamically-drivenchanges associatedwithblood oxygenation intissue andvessels:the so-calledbloodoxygen level-dependent (BOLD)phenomenon
[1,2].Ideally,thereshouldbenoactivationotherthanthatresultingfromtask-specificchangesinthe BOLD signalinthe relevantregions. Unfortunately,numerousother factorsmaycontribute tosignal
changeandconfoundthefMRIdata,suchasheadmotion[3–5],physiologicalnoise[2,6–9],andlesion
[10,11] artifacts.
Brainlesionsmayinduceintensitychangesowingtoinflammationprocesses,lossordisplacement of brain tissues, anddilationof cerebrospinalfluid spaces. This maybias the spatialnormalization process and result in sensitivity loss and false negatives. There are several spatial normalization methodsthatuseaffineand/ornonlinearwarpingalgorithmsandregularizetheestimationofwarping parameters, including cost function masking (CFM) [10] and the unified automated segmentation techniqueusedintheSPMtoolbox[12].However,bestpracticeforthepreprocessingoflesionedbrain imagesisstillunclear[13,14].
TheanalysisoffMRIdataobtainedfromneurologicalpatientsaffectedbymovementimpairments, suchasstrokepatients,alsorequiresthemonitoringofmovementandtaskcompliance[15–17].Such movement informationisoftenentered asa regressorinthestatisticalanalysis, tostudyits impact onbrainactivation.Frequency-dependentchanges intheBOLD signalduringfingermovementshave beenstudied[4,18,19] buttherehasbeenlittleresearchontheeffectofmovementamplitude,owing totheneedforspecificrecordingmaterial.Thepredominanthypothesisaboutmovementkinematics isthat greatermovement amplitudeevokes alargerBOLD signal,assupportedbyWaldvogeletal.’s finding [20]. Other major known sources of signal noise are physiological processes such as heart ratefluctuations,therespiratorycycle[2,21],andtheinteractionbetweenthetwo[22],whichinduce substantialnon-neuralfluctuationsintheBOLDsignal.Methodsdevelopedtocorrectforphysiological noise are either data-driven or model-based. The latter consider cardiac-related regressor models
[6,23] built from data obtained via peripheral recordings of heart rate and/or respiratory cycles. The PhysIO Toolbox [8] is a fully automated model-based physiological noise correction tool that implements various noise models, including RETROICOR. Its flexibility, robustnessand capacity for significantnoisereductionhavebeendemonstratedinseveralfMRIstudies[8,24–27].
HavingaclearunderstandingoftheimpactofthesedifferentstrategiesonthedataandthefMRI motor task-relatedactivation inspasticstroke patientswouldbeusefulfordeciding whichofthese strategiestoadoptinthisparticularcase.
Materials
Data were obtained from 15 patients with first-ever stroke resulting in motor impairments (3 females;meanage=53.7± 15.5years;timesincestroke=5.6± 1.7weeks;meanFugl-Meyerscale score=44.8± 28.2/100;meanTardieuSpasticityScalescore=2.4± 0.8/4,where4indicatessevere spasticity).Writtenconsentwasobtainedfromallthepatients,inaccordancewiththeDeclarationof Helsinki, andthestudywasapprovedby the localinstitutionalreview board(Comité deProtection desPersonnesSud-OuestetOutre-MerII,March2016).
During thefMRI examination,patientswere ina supineposition inthescanner, withtheir eyes closed. Before each scanning session, they were given instructions andfamiliarized withthe fMRI paradigm. We administered a passive wrist extension task. Task instructions and auditory stimuli indicating movement frequency were provided to the patients through headphones. The auditory stimuli continuedacross theactivation (A)andrest(R) trials oftheblocked designparadigm. Each functional run lasted5 minutesandconsisted of10 30-strials, alternating betweenR andAtrials. During theRtrials,patientswere instructedto restandnot tothinkaboutthemovement, whereas duringtheAtrials,theexaminer,whowaspresentinthefMRIroom,mobilizedthepatients’wristby raisingandloweringtheirhandfrom0° toitsmaximumamplitudewithafrequencyof0.5Hz.Fifteen passivemovementswereperformedperAtrial.Eachfunctionalrunwasperformedtwice,onceusing the unaffected wristandonce theaffected(i.e.spastic) one.Movement amplitudeswere monitored and recordedwith homemadeMR-compatible goniometersattached tothe patients’ wrists (Fig. 1). These goniometers,which didnot restrict their movements, were connectedto aPC located inthe console room.The recordingwaspacedby theMRI trigger.The datawere storeddigitally,usingNI Labview 2009software (National Instruments Corp.,Austin, TX, USA) [28] installed on the PC,and subsequentlyanalyzedoffline.
ImageswereacquiredusingaPhilipsdStreamAchieva3TMRIscannerequippedwitha32-channel headcoil(PhilipsMedicalSystems,Best,Netherlands).Duringeach ofthetwofunctionalruns, echo
Fig. 1. Picture of experimental setup showing homemade MR-compatible goniometer attached to patient’s wrist in MRI scanner room. Patient’s wrist is at rest, corresponding to an angle of 0 °.
planar imaging (EPI) sequences were acquired (TR = 2500 ms, TE = 3000 ms, flip angle = 90°, FOV=240∗240mm²,matrixsize= 80∗80,voxelsize =3∗3∗3mm3,resultingin47axialslices
pervolumeparalleltotheAC-PCplane).120volumeswereacquiredperrun,allowingtheacquisition oftheentirebrain.T1-weightedstructuralimageswereacquiredusinganMPRAGEsequence(TR=8 ms,TE =3.7ms, TI=520ms,flipangle=8°,FOV= 240∗240mm²,voxelsize= 1∗ 1∗1mm3),
resultinginthe acquisition of170sagittal slices.FLAIRimageswere acquiredaspartoftheroutine imaging protocol (TR = 8000 ms, TI = 2400 ms, FOV = 240 ∗ 240 mm², voxel size = 1 ∗ 1 ∗ 1 mm3, 170 sagittal slices).The start of theacquisition wassynchronized withthe auditorystimulus
presentationprogram(i.e.OpenSesamesoftware[29]),andtheLabviewprogramwasusedtomonitor andrecord movement amplitudesduring the experiment. Patients’ heartbeatwas measured during thefunctionalscans,usinganMR-compatiblepulseplethysmograph,providedwiththeMRIscanner, placedontheirindexfinger.Thephysiologicaldataweresampledatafrequencyof500Hz,recorded inascanphyslogfileusingthescannersoftware,andwereanalyzedoff line.
Procedures
Lesionmasking
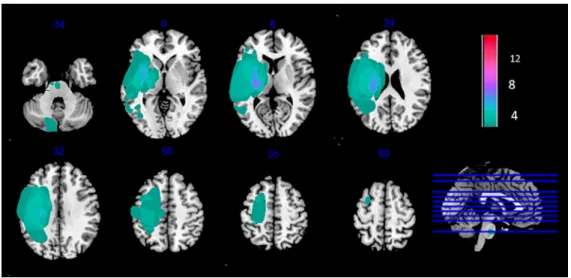
Foreach patient,wecreatedabinarylesionmaskdepictingthelesionboundaries,usingMRIcron software(RordenandBrett,2000;http://www.sph.sc.edu/comd/rorden/mricron/).Thelesionwasfirst identified using the T1 and FLAIR sequences, after which the lesion volume of interest (VOI) was drawn oneachaffected sliceofthe T1weightedimage. TheVOI wasthen smoothedusinga 4-mm FWHMGaussianfilterwitha0.1%threshold[10].Alesion-maskedT1wasthencreatedbymergingthe specific patient’sT1andlesionVOI,usingthe‘Imcalc’function ofSPM12Toolbox(WellcomeCentre for HumanNeuroimaging, London, UK; http://www.fil.ion.ucl.ac.uk/spm/) with the formulai1 ∗ .i2. Theindividual binarylesionmaskswerenormalizedandusedtocreateacolor-codedlesionoverlap map ofthelesionedvoxels acrossthebrain.Fig.2 providesanoverviewofallthepatients’lesioned brainareas.
Physiologicaldataanalysis
The physiological data were analyzed using the physIO Toolbox ([8], http://www. translationalneuromodeling.org/tnu-checkphysretroicor-toolbox/). Cardiac noise modeling took place infivemajorsteps:thereadingofthescanphyslogfile;synchronizationofthisfilewithscantiming
Fig. 2. Lesion overlap map of individual lesion masks obtained from spastic stroke patients ( N = 15). Individual maps were overlaid on a T1 template in MNI space. Right lesions were flipped to left hemisphere. MNI coordinates are given for each transverse section (z-axis), and a sagittal slice is shown for visualization. Color scale indicates number of patients who had a lesion in a given voxel. Stroke lesions were mainly centered on the posterior limb of the internal capsule. Some patients had very large lesions.
parameters;preprocessingofperipheralphysiologicaldata;applicationofapeakdetectionalgorithm to retrieve meaningful physiological measures and improve the signal-to-noise ratio. A third-order cardiac voxelwise phase Fourierexpansion wasthen modelledasa nuisanceregressor accordingto RETROICOR. Thus, the analysis consistedin using the cardiac-related physiological noise regressors we obtained as the “multiple regressors” entry for the first-level generalized linear model (GLM) specificationinSPM.Thephysiologicaldataofthreepatientswereexcludedfromtheanalysis,owing tosignallossduringtherecordingand/orpoormodelingperformance.Onlydatafromtheremaining 12patientswereusedfortheanalysesinvolvingphysiologicalregressors.
fMRIdataanalysis&results
PreprocessingandfMRIdataanalysiswerecarriedoutusingtheSPM12toolbox.
Standard image preprocessing steps were performed. TheT1 anatomicalvolume wassegmented (using the unified segmentation model), with or without taking the lesion into account, and normalized. Each patient’sfunctional volumeswere corrected for slicetiming difference, realigned, co-registered with the T1 anatomical volume, spatially normalized to the Montreal Neurological Institute (MNI)template(usingthedeformation fieldcalculatedduringthesegmentationstepofthe T1anatomicalvolume), andsmoothedusinga 6∗6 ∗6mm3 Gaussiankernel,toreduce variability
betweenpatients.Inordertotestfortheeffectoflesionmasking,thepreprocessingwasperformedby takingornottakingeachpatient’slesionintoaccountduringthepreprocessing.Qualitychecksof co-registration,segmentation,andnormalization(seeFig.S1)withandwithoutlesionmaskingrevealed nodifferences.
For the baseline comparison, individual statistical maps were then computed for each patient, usingtheGLMimplementedinSPM12.Brainareasactivatedineachofthetwoexperimental tasks-passive movement of the unaffected hand (PMvt_UH; Fig. 3, left panel) and the affected hand (PMvt_AH; Fig.4,left panel)were revealedwithsimpleeffectcomparisons(contrastbetweenAand R trials). PMvt_UH significantly activated (familywise error (FWE)-corrected p < 0.05) well known sensorimotor areas, including the contralesional sensorimotor cortex (S1M1) and the ipsilesional cerebellum(Fig.3,leftpanel).ForPMvt_AH,weobservedthesamepatternofsensorimotoractivation,
Fig. 3. Group comparisons for unaffected hand. Left panel: Brain activation associated with passive extension of unaffected hand (baseline comparison: task vs rest; PMvt_UH). Sensorimotor activation resulting from use of (a) individual lesion-masked T1 as explicit mask during first-level analysis (PMvt_UH + mT1), (b) extension amplitude regressor (PMvt_UH + EACov), (c) cardiac physiological regressor (PMvt_UH + PhysCov), and (d) extension amplitudes and cardiac physiological regressors (PMvt_UH + EAPhysCov) as nuisance covariates. Right panel: Pairwise comparisons between contrast images resulting from different processing pathways (a to d) and baseline condition. Test 2. PMvt_UH > PMvt_UH + mT1. Test 3. PMvt_UH > PMvt_UH + EACov. Test 4. PMvt_UH > PM_UH + PhysCov. Test 5. PMvt_UH > PMvt_UH + EAPhysCov. We found increased activation in the PMvt_UH condition compared with the others, but no decreased activation. Activations are displayed at p < 0.05 familywise error-corrected for multiple comparisons) at the voxel level. Color bars show significance level (t values) for each experimental condition. IL: ipsilesional hemisphere; cL: contralesional hemisphere.
butwithlessintenseandextensiveactivationinthecontralesionalS1M1andipsilesionalcerebellum (Fig.4,leftpanel).Atareducedexploratorythresholdofp<0.001uncorrectedwitha40-voxelextent threshold,weobservedamorebilateralpatternofsensorimotoractivation,andtheactivationofthe inferior andmedial frontalgyri(ventralanddorsalpremotorcortex andsupplementarymotorarea, Brodmannarea(BA)6)andbilateralinferiorparietallobule(BA40).Wefoundadditionalactivationin theinsula(BA13)andthalamuscontralateraltothemovementside(Fig.4).Theseactivationpatterns corroboratedfindingsintheliteratureonstrokepatientsperformingthistypeofmotortask[30–32].
Fig. 4. Group comparisons for affected hand. Left panel: Brain activity associated with passive extension of affected wrist (baseline comparison: task vs. rest; PMvt_AH). Brain activation resulting from use of (a) individual lesion-masked T1 as explicit masks during first- level analysis (PMvt_AH + mT1); (b) extension amplitude regressor as covariate (PMvt_AH + EACov). Right panel: Pairwise comparisons between contrast images resulting from different processing pathways (a, b) and baseline condition. Test 2. PMvt_AH > PMvt_AH + mT1. Test 3. PMvt_AH > PMvt_AH + EACov. We found increased activation in the PMvt_AH condition compared with the others, but no decreased activation. Baseline comparisons are displayed at reduced exploratory threshold of p < 0.001 uncorrected, with 40-voxel extent threshold. For pairwise comparisons, small volume correction was applied. Color bars show significance level for each experimental condition (t values). IL: ipsilesional hemisphere; cL: contralesional hemisphere.
We then re-ran the first-level analysis for each patient with an explicit mask (patient-specific lesion-masked T1) to exclude the lesioned area from theindividual statisticalanalysis. We also performed analyses with the addition of the normalized wrist extension amplitude and/or physiologicalnoiseregressors,toassesstheirimpactonthefMRIresults.Thesinglepatientcontrasts were followed by second-level models. One-sample t tests were used to create group maps for each processing pathway and for each experimental task (Figs. 3a-d, and 4a & b). Paired t tests were performed between the contrast images resulting from the different processing pathways. Results of the analyses concerning the unaffected hand are displayed at a statistical threshold of
p < 0.05 FWE-corrected, andTest conditions 3-5 were maskedinclusively withthe main effect of the PMvt_UH. Giventhata previous studyamongstroke patientshadfound that activationelicited by the AH was less intense at the sensorimotor region coordinates [31], we searched for effects by applying the small volume corrected method (SVC), using a 15-mm sphere centered on the ipsilesional S1M1,contralesionalparietal cortex,andcerebellumcoordinates.Weapplieda corrected threshold ofp= 0.05. The resultingcontrastmaps were thenoverlaid using xjviewslicerendering (http://www.alivelearn.net/xjview).TheMNIcoordinatesandthetvaluesforeachactivatedarea are setoutinthesupplementarytables.
Wethenperformedsixdifferentpairwiseteststolookattheeffectsofeachprocessingstrategy:
• Test1:Effect ofusingindividuallesionmaskduringpreprocessing(maskT1N)onactivationresults (PMvt_UH/AHvs.PMvt_UH/AH+maskT1N)(resultsnotshown)
Pairwisecomparisonsbetweentheindividualfunctionalfirst-levelmapsobtainedwhenthelesion was taken into account during the preprocessing of the stroke patients’ fMRI data revealed no significant difference (p > 0.05) in group sensorimotor activation, compared with the condition where no masking was applied. Lesion masking during preprocessing may not be responsible for theactivation optimizationandextensionaspreviouslythought[10,14].CFMseems nottoinfluence normalizationaccuracywhendealingwithimageswithsubacutelesionsduetostroke,whateverthe lesion size. The resulting segmented andnormalized T1 images ofone patient with a large lesion (with andwithout lesion masking)are provided in Supplemental Fig.S1. The unifiedsegmentation
routine used in SPM12 seemedto model the lesions better than the other normalizationmethods (affine ornonlineartransformations), evenin thecaseoflargelesions (Fig.S1). The CFMprocedure does not really exclude the area from the process, but rather implements the solution applied to theunmaskedportionsoftheimage tothearea underthemask[11].Itimprovesnormalizationand provides moresensitiveresults.However,evenifdrawing precisionisnot acriticalparametertobe takeninto account[11,15],theactual manual maskingprocedureis time consuming, particularlyin the case of large cortical-subcortical lesions that affect almost all the slices. Furthermore, besides its subjectivity[12,34],theremaybe other abnormalitiesinthelesioned brainoutsidethosedrawn within the mask,meaning that thenormalizationprocess is still notoptimal. We thereforesuggest that lesion masking maynot be a necessary step duringpreprocessing in cases where the unified segmentationroutineisused[14,35].Wethereforedecidedtouseimagesthathadbeenpreprocessed withoutlesionmaskingforthesubsequentanalyses(Path1).
• Test 2: Effect of adding masked-T1 as explicit mask during first-level analysis (PMvt_UH/AH vs. PMvt_UH/AH+mT1)
Explicitlymaskingtheindividualfirst-levelstatisticalanalysiswithalesion-maskedT1significantly reduced the level of activation of the contralesional S1M1 and ipsilesional cerebellum (p -FWE-corrected < 0.05) induced by the passive unaffected wrist extension task in the PMvt_UH >
PMvt_UH +mT1contrast(Fig.3,Test2). Wefound asimilar result(p< 0.05SVC)fortheaffected hand(Fig.4,Test2).
The individual maskswere drawnon high-resolutionT1images,andthe lesionsmayhave been slightly overestimated when applied on less resolved EPI images during the first-level analyses, resultinginthelossofperilesionalactivationelicitedbythepassivewrist movementthatmayhave reflected reorganization processes. Moreover, the excluded voxels were not onlyin the perilesional areas. Distant voxels were also excluded from the analysis after the addition of the masks. Given theseresults,andtoavoidcarryovereffectsofthedifferentstrategiesonthesubsequentanalyses,we decidednottoexplicitlymaskatthefirstlevel(Path2).
• Test 3: Effect of adding extension amplitude regressors as covariates (PMvt_UH/AH vs. PMvt_UH/AH+EACov)
TheS1M1andcerebellaractivationsobservedduringPMvt_UH(Fig.3)andPMvt_AH(Fig.4)were significantly decreased by the addition of extension amplitudes as regressors duringthe first-level analysis(Figs.3 and4,rightpanels).Therewasnodifferenceincerebellaractivationfortheaffected hand(Fig.4,Test3).Regressionanalysisonthegrouprevealedapositivecorrelationbetweenpatients’ meanandmaximum wrist extension amplitudesandthe S1M1andcerebellum activationobserved duringPMvt_UH,andS1M1activationduringPMvt_AH(p<0.05;resultsnotshown).
Movementfeatures andtheirassociatedcorticalactivationscanenrichfMRIobtainedinformation andmaketheunderlyingresultseasiertointerpret[16,20,33,34].InthestudybyCaselattoetal.[16], the addition ofkinematic regressors didnot add anynewinformation abouta healthy participant, andtheresultingcorticalmapsremainedunchanged. However,inthecaseofahemipareticpatient, itoptimizedtheactivationmap,byextendingit.Thisresultwasnotobservedinourgroupofspastic stroke patientswithheterogeneouslesionlocationsandsizes, probablybecause themovement was passive,andperfectlytimedandcontrolled.Differencesinmovementkinematicsmayhavebeendue either tointra-individual loweringofwrist extension amplitudesresulting fromspasticity triggered by movement inthe course ofthe experiment, orto increased compensatory muscle contractions. Theymayhaveledtothepositivecorrelationobserved,responsibleforthereducedmotoractivation when the amplitude regressor was included. These parameters seemed to contribute significantly to sensorimotor activation duringPMvt_AH. This shows the need to control and report movement kinematics such as rate and amplitude during fMRI experiments, especially when dealing with voluntary movements, whichare lesseasy to control. This conclusion is even more relevantwhen dealingwithanimpairedpopulationwherenotallthepatientshavethesamekinematicsforagiven movement. Quantifyingmovement kinematicsandincludingthem duringmodelestimationmaybe crucial forinterpreting the fMRI results, in orderto link the observed differencesto differences in movementparameters,occurrenceofinvoluntarymovements,effectofrehabilitationintervention,or
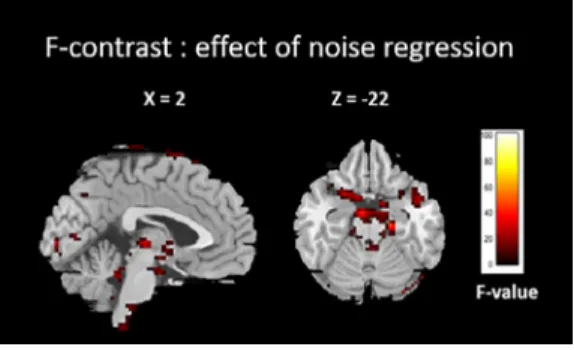
Fig. 5. F-contrast showing result of adding cardiac physiological regressor as nuisance covariate in first-level analysis.
recovery[15,16,19].Oncethishasbeendone,someauthorsmaychoosetokeepornotthemovement amplitudevariable,dependingontheirrecordingconditionsandpurpose.
• Test 4: Effect of adding cardiac physiological regressors as nuisance covariates (PMvt_UH/AH vs. PMvt_UH/AH+PhysCov)
We performed an F-contrast in order to look at the effect of adding the cardiac physiological regressorsasnuisancecovariatesduringthefirst-levelanalysisandthustoconfirmitsrelevance.The F-map foronepatient isshowninFig.5.Thebrainstem, pons,cerebellarboundaries, andventricles matchtheknown cardiacnoisesitesreportedinthe literature[8,35–37].Thispatternwasobserved formostpatients,thussuggestingthatthePhysIOToolboxofferseffectivemodel-basedcardiacnoise correction.
Adding cardiac physiological regressors as nuisance covariates also significantly reduced the sensorimotoractivationseenduringPMvt_UH (Fig.3,Test4).ForPMvt_AH,nosignificantdifferences werefound,evenwhentheSVCwasapplied.
ManystudieshavediscussedtheimpactofphysiologicalnoiseonthesensitivityoffMRIanalyses. An increase inheart rateandrespiratoryvariation isobserved duringactive periodsoftask-related paradigms, resulting in a correlation between the nuisance regressors and the fMRI contrast [38]. These task-correlated physiological fluctuations result in decreased specificity of the fMRI signal regarding the true neural signal [35]. Inclusion of nuisance regressors for cardiac and respiratory fluctuationscan thusremove thebias inthecontrastestimates.The PhysIOToolboxisespecially to be recommended,givenits robustnessandeaseof use,particularlywhendealingwithpathological populations more prone to motionand physiologicalartifacts [39].The quality of the results does, however,havetobechecked,giventhatinsome cases,thepatient’sheartbeatmaynotbe detected, owingtosayexcessivemotionorsignalloss,andmaythusresultinpoorphysiologicalnoisemodeling andcorrection.Itmayalsobeadvisabletomodelrespiratoryfluctuations.
• Test 5: Effect of adding extension amplitude and cardiac physiological regressors as covariates (PMvt_UH/AHvs.PMvt_UH/AH+EAPhysCov)
Adding both extension amplitude andcardiac physiologicalregressors ascovariates significantly decreased the sensorimotor activation resulting fromPMvt_UH (Fig. 4, Test 5). No differences were found forcerebellaractivitywhen analyzingtheactivation resultingfromPMvt_AH. The absenceof an effectfor the affectedhand can be explained by the smallnumber ofpatients included inthis analysis (12 out of 15) andthe lower residual activation of the lesioned hemisphere, which made it harderto findsignificant results.Anotherhypothesis is that themovement wasmoredifficult to performwiththeaffectedwrist,giventhatsomepatientsmayhaveexperiencedspasticityduringthe tasktrials,limitingcompletionofthetaskandthusitsphysiologicalcorrelates.
However, evenifthislaststrategy wasresponsible fora lossofactivation,applyingphysiological noise correction andconsideringmovement kinematics informationmaymakeit easierto interpret the resultsanddraw amoredirect linkbetweenthe brainactivationthat is observedandthetask
performed by the studied population. We therefore recommend the final path (Path 3) before the subsequentsecond-levelanalysis.
• Test6:Effectofaddingagrouplesionmapasanexplicitmaskduringthesecond-levelanalysis Interestingly,theadditionofthegrouplesionmap(Fig.2)asanexplicitmaskduringthe second-level analysis did not significantly affect the degree of activation (result not shown). The maps resulting from the pairwise comparisons with nonmasked baseline contrasts seems to have only removedafewvoxels inthesensorimotorregions.The problemofexcluded distantvoxelsraised in
Test 2 did not arise when we used the group lesion mask during the second-level analysis.Thus, masking at the group level may be more appropriate when none of the patients have lesions in thetarget regions.Otherwise,nomaskingisacceptable.Inourstudy,we deemedthatsensorimotor activationwasrelevantforthepatientsgroup,thuswechosetonotmaskatthesecond-level.
Finalconsiderations
Inthepresentstudy,weexploredtheeffectsofdifferentprocessingstrategiesonthefMRIresults ofa selectedportion ofthestroke population,namelyspasticstroke patients. Thelatter havemore severe motorimpairments,andtheir spasticityhinderstheir abilitytoperform motortasks andthe interpretation oftheresults.Eventhough some processingstrategies(i.e.addition ofkinematicand physiological data as regressors) seem to reduce the degree of cerebral activation observed, they also help to identify key factors and make the observed results easier to interpret. A direct link canthus bedrawn betweenthe activationobservedandtask-specificchanges intheBOLDsignal in therelevantregions.Consequently,insimilarconditions,werecommendthethreepathshighlighted in the graphicalabstract to analyze spasticstroke fMRI data. Ofcourse, this iseven more suitable when dealing with large groups of stroke patients withstrong task-related BOLD signals.There is nowaneedtostandardizetheneuroimagingprocessingmethod.Thedifferencesthataresometimes observed between similarly designed studies may partlybe explained by differences in processing methods [40,41].One solutionwouldbe to designstandardized procedures, validatedbya panel of neuroimagingexperts,whichcouldthenbeintegratedintoscanners’processingsoftware.Thechoice oftheseprocedureswoulddependonthestudydesignandthepopulationbeingstudied.Thiswould yieldpreprocessedimagesandresultsthatwouldallowforeasiercomparisonsbetweenneuroimaging studies.
DeclarationofCompetingInterest
TheAuthorsdeclarethatthereisnoconflictofinterest.
Acknowledgements
WethanktheINSERM/UPSUMR1214technicalplatformfortheirhelpinsettinguptheacquisition oftheMRIsequences.The presentfMRIstudywasconductedasan ancillarystudyofatrialfunded by a FrenchGovernmentgrant underthe aegisof theFrench HospitalProgramof ClinicalResearch (PHRCno.1014001).ItwasjointlyfundedbytheMERZFrancepharmaceuticallaboratoryandalocal grantfromtheToulouseMind&BrainResearchInstitute(TMBI).
Supplementarymaterials
The MNIcoordinatesandthet-values foreachactivatedarea are reportedinthesupplementary tables.
The supplementary figure (S1) showsthe segmentation and normalization results for a patient withalargestrokelesion.
Supplementarymaterialassociatedwiththisarticlecanbefound,intheonlineversion,atdoi:10. 1016/j.mex.2020.101056.
References
[1] B. Biswal, F.Z. Yetkin, V.M. Haughton, J.S. Hyde, Functional connectivity in the motor cortex of resting human brain using echo-planar MRI, Magn. Reson. Med. 34 (1995) 537–541, doi: 10.1002/mrm.1910340409 .
[2] K. Murphy, R.M. Birn, P.A. Bandettini, Resting-state fMRI confounds and cleanup, Neuroimage 80 (2013) 349–359, doi: 10. 1016/j.neuroimage.2013.04.001 .
[3] R. Patriat, R.C. Reynolds, R.M. Birn, An improved model of motion-related signal changes in fMRI, Neuroimage 144 (2017) 74–82, doi: 10.1016/j.neuroimage.2016.08.051 .
[4] E. Seto, G. Sela, W.E. McIlroy, S.E. Black, W.R. Staines, M.J. Bronskill, et al., Quantifying Head Motion Associated with Motor Tasks Used in fMRI, Neuroimage 14 (2001) 284–297, doi: 10.1006/nimg.2001.0829 .
[5] T. Johnstone, K.S. Ores Walsh, L.L. Greischar, A.L. Alexander, A.S. Fox, R.J. Davidson, et al., Motion correction and the use of motion covariates in multiple-subject fMRI analysis, Hum. Brain Mapp. 27 (2006) 779–788, doi: 10.1002/hbm.20219 . [6] C. Chang, J.P. Cunningham, G.H. Glover, Influence of heart rate on the BOLD signal: the cardiac response function,
Neuroimage 44 (2009) 857–869, doi: 10.1016/j.neuroimage.2008.09.029 .
[7] Hua Liu, T.Z. Luping Song, Changes in brain activation in stroke patients after mental practice and physical exercise: a functional MRI study, Neural Regen. Res. 9 (2014) 1474–1484, doi: 10.4103/1673-5374.139465 .
[8] L. Kasper, S. Bollmann, A.O. Diaconescu, C. Hutton, J. Heinzle, S. Iglesias, et al., The PhysIO toolbox for modeling physiological noise in fMRI data, J. Neurosci. Methods 276 (2017) 56–72, doi: 10.1016/j.jneumeth.2016.10.019 .
[9] Y. Tong, Frederick B deB, Studying the spatial distribution of physiological effects on bold signals using ultrafast fMRI, Front. Hum. Neurosci. 8 (2014) 1–8, doi: 10.3389/fnhum.2014.00196 .
[10] M. Brett, Spatial normalization of brain images with focal lesions using cost function masking, Neuroimage 14 (2001) 486–500, doi: 10.1006/nimg.2001.0845 .
[11] M.L. Seghier, A. Ramlackhansingh, J. Crinion, A.P. Leff, C.J. Price, Lesion identification using unified segmentation- normalisation models and fuzzy clustering, Neuroimage 41 (2008) 1253–1266, doi: 10.1016/j.neuroimage.2008.03.028 . [12] J. Ashburner, K.J. Friston, Unified segmentation, Neuroimage 26 (2005) 839–851, doi: 10.1016/j.neuroimage.2005.02.018 . [13] J. Crinion, J. Ashburner, A. Leff, M. Brett, C. Price, K. Friston, Spatial normalization of lesioned brains: performance
evaluation and impact on fMRI analyses, Neuroimage 37 (2007) 866–875, doi: 10.1016/j.neuroimage.2007.04.065 . [14] S.M. Andersen, S.Z. Rapcsak, P.M. Beeson, Cost function masking during normalization of brains with focal lesions: still a
necessity? Neuroimage 53 (2010) 78–84, doi: 10.1016/j.neuroimage.2010.06.003 .
[15] O. Ciccarelli, A.T. Toosy, J.F. Marsden, C.M. Wheeler-Kingshott, C. Sahyoun, P.M. Matthews, et al., Identifying brain regions for integrative sensorimotor processing with ankle movements, Exp. Brain Res. 166 (2005) 31–42, doi: 10.1007/ s0 0221-0 05-2335-5 .
[16] C. Casellato, S. Ferrante, M. Gandolla, N. Volonterio, G. Ferrigno, G. Baselli, et al., Simultaneous measurements of kinematics and fMRI: compatibility assessment and case report on recovery evaluation of one stroke patient, J. Neuroeng. Rehabil. 7 (2010) 49, doi: 10.1186/1743-0 0 03-7-49 .
[17] T.H. Dai, J.Z. Liu, V. Saghal, R.W. Brown, G.H. Yue, Relationship between muscle output and functional MRI-measured brain activation, Exp. Brain Res. 140 (2001) 290–300, doi: 10.1007/s002210100815 .
[18] N. Sadato, V. Ibañez, G. Campbell, M.-P. Deiber, D. Le Bihan, M. Hallett, Frequency-dependent changes of regional cerebral blood flow during finger movements: functional MRI compared to PET, J. Cereb. Blood Flow Metab. 17 (1997) 670–679, doi: 10.1097/0 0 0 04647-1997060 0 0-0 0 0 08 .
[19] B.J. MacIntosh, R. Mraz, N. Baker, F. Tam, W.R. Staines, S.J. Graham, Optimizing the experimental design for ankle dorsiflexion fMRI, Neuroimage 22 (2004) 1619–1627, doi: 10.1016/j.neuroimage.2004.03.035 .
[20] D. Waldvogel, P. van Gelderen, K. Ishii, M. Hallett, The effect of movement amplitude on activation in functional magnetic resonance imaging studies, J. Cereb. Blood Flow Metab. 19 (1999) 1209–1212, doi: 10.1097/0 0 0 04647-1999110 0 0-0 0 0 04 . [21] K. Murphy, A.D. Harris, R.G. Wise, Robustly measuring vascular reactivity differences with breath-hold: normalising
stimulus-evoked and resting state BOLD fMRI data, Neuroimage 54 (2011) 369–379, doi: 10.1016/j.neuroimage.2010.07.059 . [22] J.A. Hirsch, B. Bishop, Respiratory sinus arrhythmia in humans: how breathing pattern modulates heart rate, Am. J. Physiol.
241 (1981) 620–629, doi: 10.1016/j.cmpb.20 04.03.0 04 .
[23] J. Pinto, S. Nunes, M. Bianciardi, A. Dias, L.M. Silveira, L.L. Wald, et al., Improved 7 Tesla resting-state fMRI connectivity measurements by cluster-based modeling of respiratory volume and heart rate effects, Neuroimage 153 (2017) 262–272, doi: 10.1016/j.neuroimage.2017.04.009 .
[24] M. Grueschow, R. Polania, T.A. Hare, C.C. Ruff, Automatic versus choice-dependent value representations in the human brain, Neuron 85 (2015) 874–885, doi: 10.1016/j.neuron.2014.12.054 .
[25] T.U. Hauser, L.T. Hunt, R. Iannaccone, S. Walitza, D. Brandeis, S. Brem, et al., Temporally dissociable contributions of human medial prefrontal subregions to reward-guided learning, J. Neurosci. 35 (2015) 11209–11220, doi: 10.1523/JNEUROSCI. 0560-15.2015 .
[26] A.P.R. Smith-Collins, K. Luyt, A. Heep, R.A. Kauppinen, High frequency functional brain networks in neonates revealed by rapid acquisition resting state fMRI, Hum. Brain Mapp. 36 (2015) 24 83–24 94, doi: 10.1002/hbm.22786 .
[27] T.U. Hauser, R. Iannaccone, J. Ball, C. Mathys, D. Brandeis, S. Walitza, et al., Role of the medial prefrontal cortex in impaired decision making in juvenile attention-deficit/hyperactivity disorder, JAMA Psychiatry 71 (2014) 1165, doi: 10.1001/ jamapsychiatry.2014.1093 .
[28] C. Elliott, V. Vijayakumar, W. Zink, R. Hansen, National instruments labview: a programming environment for laboratory automation and measurement, J. Lab Autom 12 (2007) 17–24, doi: 10.1016/j.jala.2006.07.012 .
[29] S. Mathôt, D. Schreij, J. Theeuwes, OpenSesame: an open-source, graphical experiment builder for the social sciences, Behav. Res. Methods 44 (2012) 314–324, doi: 10.3758/s13428- 011- 0168- 7 .
[30] I. Loubinoux , C. Carel , J. Pariente , S. Dechaumont , J.-F. Albucher , P. Marque , et al. , Correlation between cerebral reorganization and motor recovery after subcortical infarcts, Neuroimage 20 (2003) 2166–2180 .
[31] D. Tombari, I. Loubinoux, J. Pariente, A. Gerdelat, J.F. Albucher, J. Tardy, et al., A longitudinal fMRI study: In recovering and then in clinically stable sub-cortical stroke patients, Neuroimage 23 (2004) 827–839, doi: 10.1016/j.neuroimage.2004.07.058 .
[32] A.J. Szameitat, S. Shen, A. Conforto, A. Sterr, Cortical activation during executed, imagined, observed, and passive wrist movements in healthy volunteers and stroke patients, Neuroimage 62 (2012) 266–280, doi: 10.1016/j.neuroimage.2012.05. 009 .
[33] Menon S., Yu M., Kay K., Khatib O. Haptic fMRI: accurately estimating neural responses in motor, pre-motor, and somatosensory cortex during complex motor tasks. IEEE Eng Med Biol Soc 2014:2040–5. doi:10.1109/EMBC.2014.6944017. [34] C. Enzinger, H. Johansen-Berg, H. Dawes, M. Bogdanovic, J. Collett, C. Guy, et al., Functional MRI correlates of lower limb
function in stroke victims with gait impairment, Stroke 39 (2008) 1507–1513, doi: 10.1161/STROKEAHA.107.501999 . [35] J.C.W. Brooks, O.K. Faull, K.T.S. Pattinson, M. Jenkinson, Physiological Noise in Brainstem fMRI, Front. Hum. Neurosci. 7
(2013) 1–13, doi: 10.3389/fnhum.2013.00623 .
[36] A.O. Diaconescu, C. Mathys, L.A.E. Weber, L. Kasper, J. Mauer, K.E. Stephan, Hierarchical prediction errors in midbrain and septum during social learning, Soc. Cogn. Affect Neurosci. 12 (2017) 618–634, doi: 10.1093/scan/nsw171 .
[37] C. Hutton, O. Josephs, J. Stadler, E. Featherstone, A. Reid, O. Speck, et al., The impact of physiological noise correction on fMRI at 7T, Neuroimage 57 (2011) 101–112, doi: 10.1016/j.neuroimage.2011.04.018 .
[38] J. Ladstein, H.R. Evensmoen, A.K. Haberg, A. Kristoffersen, P.E. Goa, Effect of task-correlated physiological fluctuations and motion in 2D and 3D echo-planar imaging in a higher cognitive level fMRI paradigm, Front. Neurosci. 10 (2016) 1–13, doi: 10.3389/fnins.2016.00225 .
[39] S.S. Poil, S. Bollmann, C. Ghisleni, R.L. O’Gorman, P. Klaver, J. Ball, et al., Age dependent electroencephalographic changes in attention-deficit/hyperactivity disorder (ADHD), Clin. Neurophysiol. 125 (2014) 1626–1638, doi: 10.1016/j.clinph.2013.12.118 . [40] M. Lindquist, Neuroimaging results altered by varying analysis pipelines., Nature 582 (7810) (2020) 36–37, doi: 10.1038/
d41586- 020- 01282- z .
[41] R. Botvinik-Nezer, F. Holzmeister, C.F. Camerer, A. Dreber, J. Huber, M. Johannesson, et al., Variability in the analysis of a single neuroimaging dataset by many teams, Nature 582 (7810) (2020) 84–88, doi: 10.1038/s41586- 020- 2314- 9 .