READ THESE TERMS AND CONDITIONS CAREFULLY BEFORE USING THIS WEBSITE. https://nrc-publications.canada.ca/eng/copyright
Vous avez des questions? Nous pouvons vous aider. Pour communiquer directement avec un auteur, consultez la première page de la revue dans laquelle son article a été publié afin de trouver ses coordonnées. Si vous n’arrivez pas à les repérer, communiquez avec nous à PublicationsArchive-ArchivesPublications@nrc-cnrc.gc.ca.
Questions? Contact the NRC Publications Archive team at
PublicationsArchive-ArchivesPublications@nrc-cnrc.gc.ca. If you wish to email the authors directly, please see the first page of the publication for their contact information.
NRC Publications Archive
Archives des publications du CNRC
This publication could be one of several versions: author’s original, accepted manuscript or the publisher’s version. / La version de cette publication peut être l’une des suivantes : la version prépublication de l’auteur, la version acceptée du manuscrit ou la version de l’éditeur.
Access and use of this website and the material on it are subject to the Terms and Conditions set forth at Pressure equalization performance of a metal and glass curtain wall Ganguli, U.; Quirouette, R. L.
https://publications-cnrc.canada.ca/fra/droits
L’accès à ce site Web et l’utilisation de son contenu sont assujettis aux conditions présentées dans le site LISEZ CES CONDITIONS ATTENTIVEMENT AVANT D’UTILISER CE SITE WEB.
NRC Publications Record / Notice d'Archives des publications de CNRC: https://nrc-publications.canada.ca/eng/view/object/?id=61891932-f90f-4334-98c8-4a37035d570b https://publications-cnrc.canada.ca/fra/voir/objet/?id=61891932-f90f-4334-98c8-4a37035d570b
Ser TH1
N21d National Research Conseil national no. 1 5 4 2
1
*
1
Council Canada de recherches Canadac. 2
BLDG I Institute for Research in recherche en lnstitut de
. -- - Construction construction
Pressure Equalization Performance of
a
Metal and Glass Curtain Wall
by U. Ganguli and R.L. QuirouetteANALYZED
Appeared in Proceedings
1987 CSCE Centennial Conference Montreal, Quebec, May 19 - 22,1987 Vol. 1, p. 127-144
(IRC Paper No. 1542)
Reprinted with permission
Price $5.00 NRCC 29024 I N R C
-
C1-I i I R C I L I B R A R Y iT h i s p a p e r i s b e i n g d i s t r i b u t e d i n r e p r i n t f o r m by t h e I n s t i t u t e f o r R e s e a r c h i n C o n s t r u c t i o n . A l i s t of b u i l d i n g p r a c t i c e and r e s e a r c h p u b l i c a t i o n s a v a i l a b l e from t h e I n s t i t u t e may b e o b t a i n e d by w r i t i n g t o t h e P u b l i c a t i o n s S e c t i o n , I n s t i t u t e f o r R e s e a r c h i n C o n s t r u c t i o n , N a t i o n a l R e s e a r c h C o u n c i l o f C a n a d a , O t t a w a , O n t a r i o , K1A 0R6. Ce document e s t d i s t r i b u 6 s o u s f o r m e d e t i r C - a - p a r t p a r 1' I n s t i t u t de r e c h e r c h e en c o n s t r u c t i o n . On p e u t o b t e n i r u n e l i s t e d e s p u b l i c a t i o n s d e 1 ' Z n s t i t u t p o r t a n t s u r l e s t e c h n i q u e s ou les r e c h e r c h e s e n m t i k r e d e b d t i m e n t e n G c r i v a n t 3 l a S e c t i o n d e s p u b l i c a t i o n s , I n s t i t u t d e r e c h e r c h e e n c o n s t r u c t i o n , C o n s e i l n a t i o n a l d e r e c h e r c h e s d u C a n a d a , O t t a w a ( O n t a r i o ) , K1A O R 6 .
PRESSURE EQUALIZATION PSRFORMANCE OF A METAL AND GLASS CURTAIN WALL
U. Ganguli' and R.L. Quirouette2
ABSTRACT
The open rain screen principle presupposes that if the pressure difference across the vented cladding of an exterior wall system is zero, then one of the factors that drives rain into the building envelope is inhibited. Laboratory measurements of the time taken for pressures to equalize across the glass cladding of a metal and glass curtain wall unit and the subsequent transient load on it are presented and discussed. Aspects needing further consideration are also
identified.
l,*Researcher, Institute for Research in Construction, National Research Council Canada, Ottawa, Ontario, KIA OR6.
SOMMAIRE
Le principe de l'hcran pare-pluie ouvert presuppose que si la diffkrence de pression de part et d'autre du parement ventile d'un systhme de mur exterieur est nulle, l'un des facteurs qui fait penktrer la pluie dans l'enveloppe du bitiment devient inoperant. Les auteurs dbcrivent et Ctudient les mesures faites en laboratoire pour determiner le delai d'egalisation des pressions de part et d'autre du parement de verre d'un mur-rideau
A
allege de metal et verre, ainsi que la chargetransitoire subsbquente A laquelle le parement est soumis. On y indique
INTRODUCTION
The weather tightness of a wall system is usually provided by either of two methods. The first, called the "Face Seal Approach," attempts to seal the building envelope at the cladding surface. In this method, weather tightness is usually achieved through the use of
sealants (gunnable and solid). Experience indicates, however, that such weather tightness is difficult to maintain because of the limited
tolerance of some sealants to thermal, wind, and moisture induced movement of cladding components. The ultraviolet component of solar energy and harsh weather conditions are also known to adversely affect the durability of some sealants. Consequently, as the building ages, the cladding system deteriorates and openings appear in the building envelope. The control of smoke, fire, noise, indoor air quality become increasingly difficult. Air leakage through the envelope also results in wastage of energy and increases the threat of wind driven rain and condensation in the wall of the moisture content of exfiltrating air
(Quirouette, 1986). The concern is that such problems occur far too soon in the life of a building envelope, to the annoyance and cost of building owners. To improve on such shortlived performance an alternate method based on the "rain screen principle" was developed.
A rain screen wall is a double layered wall with an air space
(cavity) separating the two layers. The cavity is vented and drained to the outside by openings in the outer layer. These openings allow
equalization of the cavity pressure with the local external pressure. When pressures equalize across the outer wythe (rain screen) then wind driven rain is prevented from penetrating the rain screen. However, because the cavity pressure rises or falls with the exterior pressure,
the wind pressure is then transferred to the inner wythe (air barrier; Quirouette, 1985). The rain screen is primarily used to shade the inner parts of the wall from direct attack by sun and rain. The successful implementation of the rain screen principle requires' compartments
between the rain screen and air barrier. Otherwise, when wind blows at the building the cavity will afford a passageway for the flow of air along the cavity. Such air movement may subsequently entrain
significant quantities of rain and snow into the cavity. Flashings are incorporated into the wall design so that any water that may enter the cavity can effectively drain out.
Even though the rain screen principle is used extensively by
architects, little is known of the parameters that control the pressure equalization performance of such wall systems. In the absence of such design information the rain screen cladding is usually designed for the entire wind load. However, should pressures equalize across the rain screen, it should be feasible to design the cladding and its anchors for a fraction of the wind load. Wind tunnel studies (MH Ltd., 1984) as well as recent field measurements on precast sandwich panels (Ganguli and Dalgliesh, 1987) support this contention. At the present time builders are often required to test their curtain wall systems by measuring the water penetration under a static pressure difference
(137 Pa) in accordance with the ASTM test method E331. The structural integrity of curtain wall systems is also verified by ASTM test method E330. The latter test includes subjecting the wall assembly to a predetermined hourly wind load and a ten second gust.
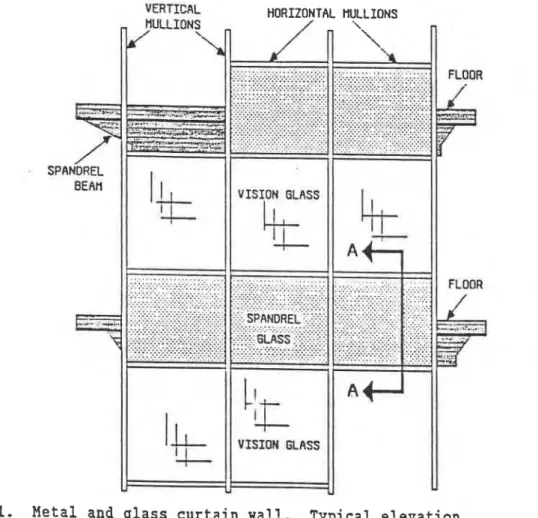
In this paper the pressure equalization performance of a metal and glass curtain wall spandrel system (Fig. 1) is examined with the purpose of understanding how the transient load on the rain screen may be
reduced by varying the wall system properties.
Fig. 1. .~.~.'.'.'.'.~.'i.'. .. ... ... ... :.: ... ... ... ... ...:....:... A'.. .'A ... ....:...:.. .:.> ::i:.. ... ... ..:...:.. ;;; ... ... ...
Metal and glass curtain wall. Typical elevation.
DESCRIPTION OF METAL AND GLASS CURTAIN WALL
A glass and metal curtain wall (spandrel section), 1067 x 1092 mm consisting of a 6 mm clear, tempered glass (rain screen cladding) and a
22-guage galvanized sheet steel backpan (air barrier and vapour
retarder) was used in this study. A 120 mm deep air space between the metal pan and glass is partially filled (100 mm) with medium density
glass fiber insulation. The cavity (.I5 m3) is isolated from the next
spandrel section or the vision glass above and below by a system of horizontal and vertical mullions (Fig. 1)
.
HORZZONTAL SHAP OH W I O N COVER INSULATION HETAL SPANDREL GLASS
-4lll
<
VENT SLOTS GRSKETS U SERLS
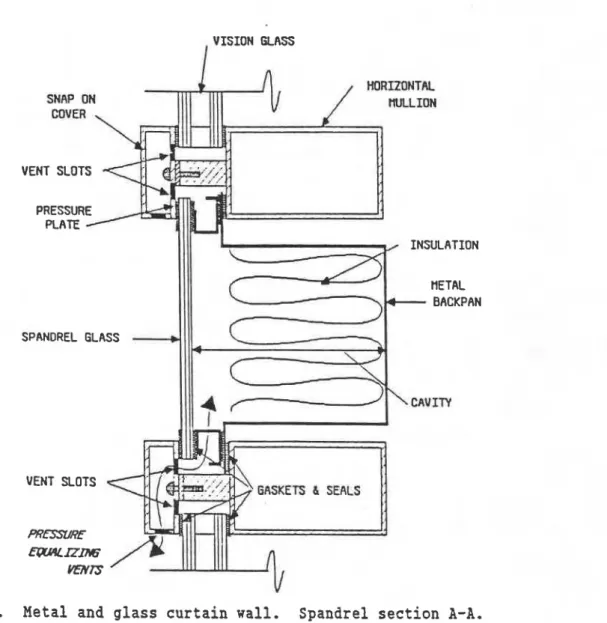
Fig. 2. Metal and glass curtain wall. Spandrel section A-A.
The spandrel panel cavity (Fig. 2) is drained and vented to the outside by 3 slots (6
x
18 mm) cut in a horizontal pressure plate installed at the bottom of the spandrel section and by two additional slots on a pressure plate installed over the top horizontal mullion. These pressure plates connect the main cavity of the spandrel panel to a much smaller cavity between the snap on covers and the pressure plates. The snap on covers, while providing the exterior finish, are sealed to the pressure plates and have two 6 mm diameter holes on the underside at the extremities. These drain holes are used to eliminate any water that may accumulate behind the spandrel glass and to vent the cavity. Hence, the venting area serving the cavity must must draw or expel air through the drain holes and through the s 1 o t s . h the pressure plates.Through wall air leakage was simulated by drilling four holes, each of area 127 mmz, in the metal backpan (air barrier) Simulated air leakage could then be adjusted to four rates by fitting these holes with stoppers.
EQUIPMENT AND INSTRUMENTATION
The spandrel panel was mounted and supported in a 1550 x 1550 x 250 mm deep wood frame enclosure made of plywood panels (Fig. 3). A
commercial vacuum cleaner, connected to a flanged extrusion from the test box, was used to pressurize and depressurize the air within the test box. Pressures on the surface of the glass as well as between the glass and metal backpan were measured with the aid of pressure
transducers.
Two Viatran (wheatstone bridge) differential pressure transducers of range +lo00 Pa and an electronic micromanometer of range 26 kPa, accurate to within 3%, were used to measure the pressures. The response of the transducers and tubing was flat (no distortion) up to 10 Hz. The electrical signals from the transducers were fed into a Watanabe strip chart recorder (frequency response 100 Hz) and pressure versus time curves were obtained and analyzed.
TEST PROCEDURE
The test procedure consisted of increasing (or decreasing) the
pressure in the test box to 900 Pa above (or below) the ambient
conditions of the laboratory and recording the pressure difference across the glass and metal backpan for various values of the ratio of the venting area/leakage area. This determined the'pressure
equalization performance for a steady wind. To simulate the gusting effect of wind on the face of a building the pressure in the test box was forced to return to atmospheric pressure (ambient laboratory
condition) by releasing the test box pressure quickly. This constituted the dynamic portion of the test, The transient pressure difference across the glass cladding and metal backpan were recorded for several
values of venting areas (for a fixed cavity volume, 0.15 m3) and for
normal as well as increased stiffness of the metal backpan (air barrier).
MEASUREMENTS AND DISCUSSION Static Tests
Air leakage in an exterior wall system usually arises because of imperfect seals in the joints between the elements of the wall assembly or due to excessive air permeability of the materials, e.g. concrete block, fiberboard panels, open cell polystyrene insulation etc. For a metal and glass curtain wall the air permeability of sheet metal is too small to measure so that the problem of leakage arises mainly at the joints between the metal pan flanges and the mullion shoulders.
In this paper frequent reference is made to "venting" and "leakage" areas. Venting areas refer to intentional and unintentional openings in the cladding (rain screen) that aid pressure equalization across it. The unintentional venting is provided by gaps and cracks that connect the curtain wall cavity to the air enclosed within the testbox. The holes drilled in the metal backpan are referred to as leakage area.
In this section the effect of leakage area on the pressure
difference across the glass cladding is examined to determine a ratio of vent area/leakage area that will result in minimal pressure differences across the glass.
First, in order to determine the existing unintentional venting area in the joints of the curtain wall unit, all the intentional venting areas were sealed off. The pressure in the test box was raised to 100,
300 and 900 Pa in turn and at each setting the pressure differences
across the glass and backpan were measured. The continuity and usual incompressible flow equations may be used to relate differences in pressure across the glass cladding and the metal backpan to the venting and leakage areas respectively:
(1 ) Continuity Equation:
( 2 ) Incompressible Flow Equations:
Vrr = C n ( r s )
-
(pressure difference across rain screen)J 6
2
-
(pressure difference across air barrier) 6From (1) and (2):
A e b CD c r s ) pressure difference across rain screen
( 3 ) =
A r s CD c * b )
/
pressure difference across air barrierwhere A is the leakage or venting area, V the flow velocity, the
subscripts r s and st, represent the rain screen (glass cladding) and air
barrier (metal backpan) respectively, CD represents the coefficient of discharge of the openings and 6 the density of air.
In general, the coefficient of discharge, CD, and the flow exponent (here, 0.5) depend on the nature of the opening and flow respectively. The flow exponent varies from 0.5 for laminar flow to 1.0 for turbulent flow. If CD for the unintentional venting and backpan leakage can be assumed to be the same, then
Aa b pressure difference across rain screen (4) - =
J
A r s pressure difference across air barrier
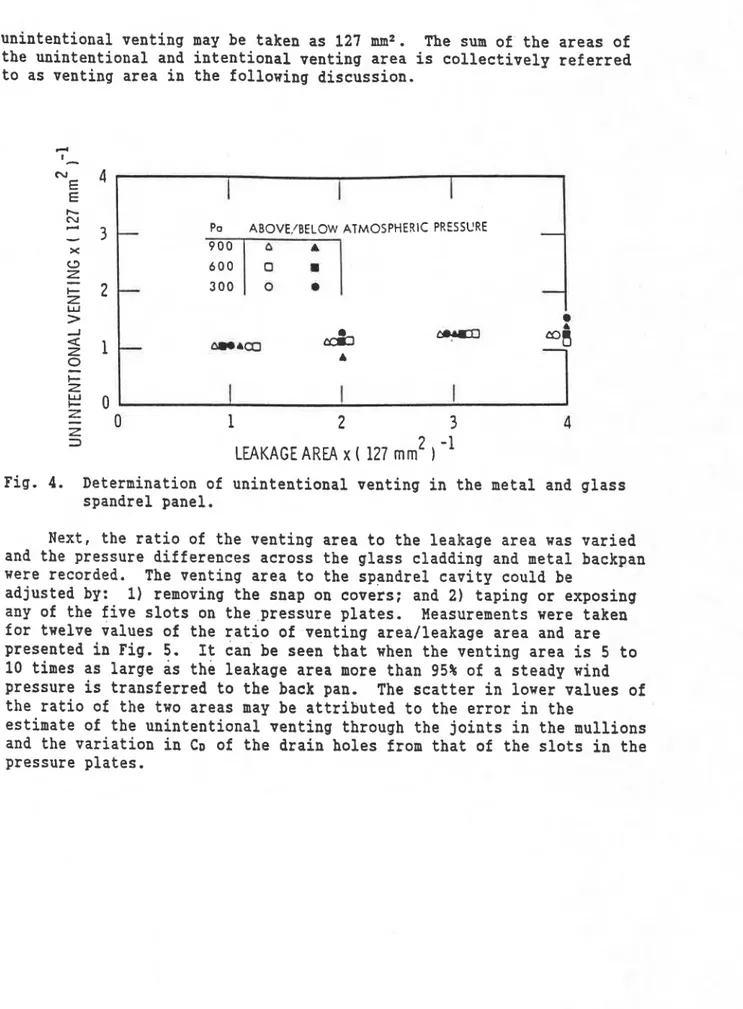
A plot of the unintentional venting area versus the leakage area
for four leakage settings is presented in Fig. 4. The unintentional venting area was calculated (Eq. 4) from the measured pressure
differences and assuming that the flow exponent (0.5) and CD for the unintentional venting in the spandrel glass connections and the opening in the backpan are the same. *From Fig. 4 it may be seen that the
unintentional venting area increases as the backpan leakage area is increased. In the test procedure the backpan leakage was set to zero
unintentional venting may be taken as 127 mm2. The sum of the areas of the unintentional and intentional venting area is collectively referred to as venting area in the following discussion.
Po ABOVE,/BELOW ATMOSPHERIC PRESSURE
300
L
3 2 -1
LEAKAGE AREA x ( 127 mm )
Fig. 4. Determination of unintentional venting in the metal and glass spandrel panel.
Next, the ratio of the venting area to the leakage area was varied and the pressure differences across the glass cladding and metal backpan were recorded. The venting area to the spandrel cavity could be
adjusted by: 1) removing the snap on covers; and 2) taping or exposing any of the five slots on the pressure plates. Measurements were taken for twelve values of the ratio of venting arealleakage area and are presented in Fig. 5. It can be seen that when the venting area is 5 to 10 times as large as the leakage area more than 95% of a steady wind pressure is transferred to the back pan. The scatter in lower values of the ratio of the two areas may be attributed to the error in the
estimate of the unintentional venting through the joints in the mullions and the variation in CD of the drain holes from that of the slots in the pressure plates.
VENTING AREA I LEAKAGE AREA
Fig. 5. The pressure across the glass cladding expressed as a
percentage of the total static pressure difference across the curtain wall versus the ratio of venting area/leakage area.
Equation 4 was used to calculate the differences in pressures
across the spandrel glass and backpan for various values of the ratio of the two areas and are in close agreement with measured values. Similar data and performance characteristics were found by Killip et al. (1984).
A large enough ratio of venting area to leakage area, though, ensuring that most of a steady wind load will be transferred to the backpan, does not impose any restriction on the quantity of air leaking through the curtain wall. A standard set by The Architectural Aluminium Manufacturers Association is that an acceptable leakage rate is 0.32 l i t r e d s per square metre of projected area (0.06 cfm per square foot) for a pressure difference of 75 Pa across the curtain wall. If the value of CD for an assumed leakage varies from 0.5 to 0.65, and the flow exponent is taken as 0.5, the allowable leakage area in the backpan is approximately 4 0 to 55 mm2 per square metre of projected area. On the basis of such an estimate the minimum venting area for this panel
(surface area of glass 1.16 m2) should be 460-640 mm2 so that over 95% of a steady wind load is transferred to the backpan. The venting area normally used is less than 100 mm2.
Dynamic Tests
Under dynamic conditions, pressure differences across the glass cladding should equalize within seconds. This may be demonstrated qualitatively by the following example: a 160 km/h wind (44 m/s) has a
dynamic pressure equivalent to approximately 1000 Pa. Since the
atmospheric pressure is about 100 kPa, the pressure in the cavity must change by only 1% so that pressures across the rain screen equalize. This can be readily achieved by a flow of air of volume 1% of the cavity volume. This is a fairly small volume and pressures are therefore able to equalize rapidly. In the above illustration it is assumed that the walls of the compartment are rigid.
In practice the wind pressure fluctuates constantly, the linings (backpan, seals, mullions) leak and the wall components can deflect. The effect of these parameters on the pressure equalization performance of the metal and glass curtain wall unit are examined in the following sections.
Effect of rate of Dressure change. For the more general situation of gusting winds the ratio of the cavity volume to the venting area, the relative stiffnesses of the glass and the backpan, the rate at which pressures increase and decrease due to eddies, and the airtightness of the compartment all determine the length of time taken for pressures to equalize across the vented glass cladding as well as the resulting transient load on it.
At the present time there is very little information on correlation of peak gust pressures with the rates of pressure change. In conducting field measurements (Ganguli and Dalgliesh, 1987) it has been observed that the: rate at which pressures change on the face of a building vary between 1500 and 4000 Pa/s.
Adapters were designed to fit over the exhaust port of the pressure release valve. These adapters reduced the exhaust area of the test box to 1/2 and 114 of. its initial discharge area so that three rates of pressure increase or decrease could be simulated. The pressure in the test box varied exponentially with time and the time rate of pressure change was maximum at t = 0. The rate at which pressures change are identified by the slope of the pressure vs. time curves at time t = 0.
Three rates of pressure change were simulated (53%): 3500, 1600, 900 Pa/s and the resulting transient pressure differences across the glass, as well as the time taken for pressures to equalize were recorded
(Fig. 6 ) for an initial starting pressure of 900 Pa above atmospheric. The rates of pressure change above have been rounded off to present the relative order of magnitudes.
I B ' . '
1-
-
TEST BOX PRESSURE
X ~ M O
pa/$-
-
-
-
-
-
-
-
3 1% c--
I \ PRESS. DIFFERENCL \7
\ ACROSSGLASS 8c
I L I-
-
TEST BOX PRESSURE
P -- 900 Pa/$
-
-
-
-
-
-
-
PRESS DIFFERENCE ACROSS GLASS- " 0 1 2 3 4 5 0 1 2 3 4 5 0 1 2 3 4 5TIME,
s
Fig. 6. The pressure equalization performance for three rates of pressure change. (Vent area = 227 mm2, cavity volume =
0.15 m3, leakage = 0)
It can be seen from Fig. 6 that rapid changes of 'pressure on the surface of the building will result in high transient loads on the spandrel glass. The performance of the spandrel system was the same
(23%) when the starting pressure was 900 Pa below atmospheric. The National Building Code of Canada recommends designing
structures for a 3-5 second gust. Field investigations (Ganguli and Dalgliesh; Ganguli, 1987) indicate, however, that the gusts that cause severe pressure differences across the cladding are approximately triangular and last from 0.1
-
1 second. At the present time these large pressure differences across the rain screen cladding areattributed to gusts that are of limited spatial extent so that the full impact of these gusts are limited to only a portion of the cladding panel. The measurements presented above indicate that the response time of the mass of air in the cavity relative to the rate of pressure
buildup is also an important consideration.
The initial, higher then atmospheric pressure, in the test box caused a deflection of the metal backpan. Subsequent decay of the test box pressure then caused the backpan to return to its original position- One would normally expect the backpan to oscillate back and forth about its equilibrium position .before coming to rest. A similar oscillatory
motion of the glass cladding and the mass of air within the cavity might be expected. These oscillatory motions would (within the frequency response of the instrumentation) in turn show up as oscillations of the cavity pressure. However, measurements indicated that the cavity
pressure decayed without any oscillatory behaviour. This is contrary to the predictions of related analytical models developed (Bolmes, 1979;
Liu et al., 1981; Sathoff et al., 1983) to predict the behaviour of
building internal pressures when subject to a step change. Their
assumptions of 1) a step change in pressure and 2 ) rigid walls probably
influence the predictions so that the building internal pressure is expected to oscillate and overshoot the equilibrium pressure. The present measurements agree qualitatively with wind tunnel studies of
internal pressures of low rise buildings (Stathopoulos, 1980) and field
measurements of building internal pressures (Liu et al., 1985)
Effect of cavity volume/venting area. When a gust hits a building the pressure in the cavity may equalize with the local external pressure by a flow of air into or out of the cavlty. The cavity pressure may also equalize, at least partially, by a deflection of the spandrel glass. The effects of changing the ratio of the cavity volume/venting area and the stiffness ratio of the back pan to the spandrel glass are examined in the present and next section respectively. In the following
discussion results are presented only for the fastest rate of pressure
e 60 I
1
I I 1I
I
I3
Z CAVITY VOLUMEflENTING AREA, m
0 5 0 -
-
n-
-
-
-
I I 1 1 1 1 0 1 2 3 4 5 6 7 8 9 1 0 TIME,s
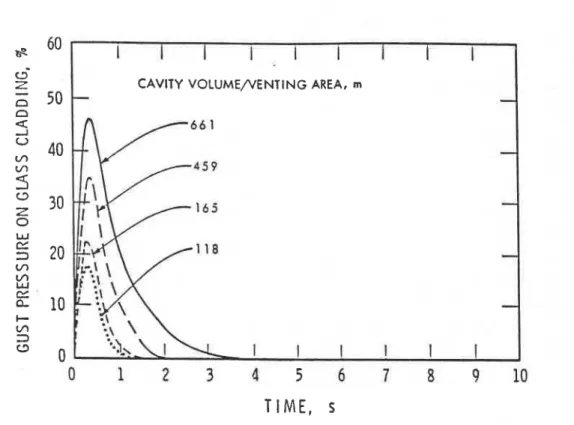
Fig. 7. The pressure equalization performance for various ratios of cavity volumelventing area.
Figure 7 presents the effect of varying the venting area for a fixed cavity volume (0.15 n3). Measurements, for four values of the
ratio of cavity vollventing area indicate that a substantial reduction in the pressure difference across the glass cladding can result by
increasing the venting area. The ratio of cavity volume to venting area used is normally greater than 1500 m.
Effect of increasinq the stiffness of metal backoan. I n this study the backpan was stiffened so that, at its centre point, its nominal
deflection of 10 mm (11 mm under pressure, 8 mm under suction) was reduced to 1.5 mm, at a pressure difference of 1000 Pa. The maximum pressure differences across the glass cladding before and after
stiffening are presented below for various values of the ratio of cavity volume/venting area.
Cavity Volume Maximum Pressure Difference Across Glass Normal Backpan Stiffened Backpan Venting Area. ( % ) ( % )
In practice it may be difficult to achieve the above-mentioned stiffness and indeed there may be little point in increasing the stiffness ratio beyond a certain limit at which point improvements in performance can be matched more easily by increasing the venting area.
(The deflection of the glass at its centre point was 4 mm for a 1000 Pa pressure difference. 1
Effect of leakage. It was indicated earlier (Static Tests) that the ratio venting arealleakage area served to determine the fraction of the steady wind load on the glass cladding and metal backpan. Leakage in the air barrier (backpan and joints) is detrimental to the performance of a rain screen system when subject to dynamic conditions as well.
The normal procedure for most of the tests involved a rapid depressurization of the box pressure from an initial value of 900 Pa above atmospheric to the ambient pressure. In this test it was necessary to reverse the procedure, because, when wind blows at a building the pressure on the side of the metal backpan facing the building interior is, in general, very different from the pressure on the glass cladding. -Normally, this pressure difference would serve to prestress the metal pan and enhance its normal stiffness marginally. In
this test only it was more important to simulate the difference in steady pressures on either side of a curtain wall (when on a building) because the cavity is in direct contact, through the leakage in the backpan connections, to the building interior.
In order to simulate the above mentioned situation, the pressure in the test box was increased from ambient conditions to 900 Pa at a
nominal rate of 600 Pals. This was the fastest rate for the buildup of pressure that could be achieved. Also, as the leakage in the backpan was varied the rate at which the pressure in the test box increased could not be maintained at 600 Pals so that a systematic study could not be performed.
TEST BOX PRESSURE
VENTING AREA
LEAKAGE AREA = 127 m m
LEAKAGE AREA = 0
TIME.
s
Fig. 8. The effect of leakage on the pressure equalization performance of the wall system under dynamic conditions (volume = 0.15 m3
.
Figure 8 presents an example situation where the leakage in the backpan clearly increases the transient load on the glass from 11% to 18% of the gust load when the leakage area was increased from a nominal value of 0 to 127 mm2.
CONCLUSION
In a metal and glass curtain wall designed on the principle of the rain screen, if the venting area is 5 to 10 times larger than the
leakage area then more than 95% of a steady wind load is transferred t o the backpan or other air barrier assemblies.
For a normal setting, with unintentional venting (gaps, cracks, etc.) adding to the venting area the transient pressure difference across the spandrel glass for simulated gusts was 40
-
45% of the applied gust pressure (900 Pa). For these tests the time taken for pressures to equalize was 3-5 seconds.The pressure equalization performance of the metal and glass
curtain wall was easily improved by increasing the vent area. When the cavity volume/vent area was reduced from 661 m to 118 m the transient pressure difference across the spandrel glass was reduced from 45% to
17%.
Stiffening of the bachpan also has an affect on the pressure equalization performance of the system. For example, stiffening the backpan from a nominal deflection of 10 mm to 1.5 mm (at a 1000 Pa pressure difference) reduced the transient pressure difference across the spandrel glass by 5
-
10% of the applied gust load. In practice, however, beyond maintaining sufficient rigidity of the air barrier(stiffness of air barrierlrain screen 21) it may not be necessary to stiffen the air barrier excessively since the benefits this provides can be easily matched by simply increasing the vent area. Clearly, however, the vent area cannot be increased without limit since the cladding must satisfactorily perform its other duties.
Openings in an air barrier pose a greater threat to the performance of a curtain wall system than an identical leakage in the elements used to compartment the cavity. The justification for this statement lies in the fact that while both may lead to rain penetration, the former allows exfiltration of warm humid air in the winter months. This may lead to the formation of ice within the panel, which in turn may cause stresses to appear on the glass or in the joints. There is the added danger of icicles forming at the drain holes in the snap on covers. Once these holes are covered the cavity pressure cannot equalize with the external pressure and the entire wind load will then appear on the glzss
cladding. Moreover, extensive lateral flow can occur only when wind blows at a building, while infiltration and exfiltration can occur all year round, especially in commercial buildings since the building interior is normally pressurized.
It is desirable to restrict the velocity of incoming air for a given volumetric flow rate, since greater velocities will entrain rain more easily. This may require that the ratio of venting area/leakage area exceed that dictated by either the allowable leakage or the volume of the cavity (whichever is greater).
Research correlating gust sizes with rates of pressure changes and studies relating wind flow to moisture entrainment> would assist in developing and improving existing standards for open rain screen walls-
ACKNOXLEDGEMENTS
The cooperation of Mr. Stan Metrick, The Ford Glass Company and assistance provided by J.D. Atkins and F.W.K. Hummel for data
REFERENCES
GANGULI, U. 1987 (January/February). Air pressures within walls. Construction Canada (in press).
GANGULI, U. and DALGLIESH, U.A. '1987. Wind pressures on open rain screen walls: Place Air Canada. American Society of Civil Engineers (to be published).
r
ROLMES, J.D. 1979. Mean and fluctuating internal pressures induced by wind. Proceedings, Fifth International Conference on Wind
Engineering, Vol. 1, Fort Collins, Colorado, July 8-14, 1979, pp. 435-450.
KILLIP, I.R. and CHEETHAM, D.W. 1984. The *revention of rain
penetration through external walls and joints by means of pressure equalization. Building and Environment, Vol. 19, No. 2, pp. 81-91. Printed in Great Britain.
LIU, H. and SATHOFF, P.J. 1981 (April). Building internal pressure: Sudden change. Proceedings of the American Society of Civil
Engineers, Journal of the Engineering Mechanics Division, Vol. 107, No. EM2, pp. 309-321.
LIU, H. and FARTASH, MORTEZA. 1985. Field measurement of building internal pressure. Proceedings, Fifth National Conference on Wind Engineering, pp. 4B51-4B58.
MORRISON HERSHFIELD. 1984. A wind tunnel investigation of rain screen wall systems. Contract No. 15SR.31944-0014. Guelph, Ontario. QUIROUETTE, R.L. 1985 (July)
.
The difference between a vapour barrierand air barrier. Building Practice Note No. 54, Division of Building Research, National Research Council of Canada, Ottawa, ISSN 0701-5216.
QUIROUETTE, R.L. 1986 (November/December
.
Air barriers: Amisunderstcod element. Construction Canada.
SATHOFF, P.J. and LIU, H. 1983 (June). Internal pressure of multi-room buildings. Proceedings of the American Society of Civil Engineers, Journal of Engineering Mechanics, VoP. 109, No. 3, pp. 908-919. STATHOPOULOS, T., SURRY, D., and DAVENPORT, A.G. 1980. Internal
pressure characteristics of low-rise buildings due to wind action. Proceedings, fifth ~nternational Conference on Wind ~ngineering