HAL Id: hal-03214925
https://hal.archives-ouvertes.fr/hal-03214925
Submitted on 3 May 2021
HAL is a multi-disciplinary open access
archive for the deposit and dissemination of
sci-entific research documents, whether they are
pub-lished or not. The documents may come from
teaching and research institutions in France or
abroad, or from public or private research centers.
L’archive ouverte pluridisciplinaire HAL, est
destinée au dépôt et à la diffusion de documents
scientifiques de niveau recherche, publiés ou non,
émanant des établissements d’enseignement et de
recherche français ou étrangers, des laboratoires
publics ou privés.
The dry season intensity as a key driver of NPP trends
Guillermo Murray-tortarolo, Pierre Friedlingstein, Stephen Sitch, Sonia
Seneviratne, Imogen Fletcher, Brigitte Mueller, Peter Greve, Alessandro
Anav, Yi Liu, Anders Ahlström, et al.
To cite this version:
Guillermo Murray-tortarolo, Pierre Friedlingstein, Stephen Sitch, Sonia Seneviratne, Imogen Fletcher,
et al.. The dry season intensity as a key driver of NPP trends. Geophysical Research Letters, American
Geophysical Union, 2016, 43 (6), pp.2632-2639. �10.1002/2016GL068240�. �hal-03214925�
The dry season intensity as a key driver
of NPP trends
Guillermo Murray-Tortarolo1, Pierre Friedlingstein1, Stephen Sitch2, Sonia I. Seneviratne3, Imogen Fletcher1, Brigitte Mueller3,4, Peter Greve3, Alessandro Anav1, Yi Liu5, Anders Ahlström6, Chris Huntingford7, Sam Levis8, Peter Levy9, Mark Lomas10, Benjamin Poulter11, Nicholas Viovy12, Sonke Zaehle13, and Ning Zeng14
1
College of Engineering, Mathematics and Physical Sciences, University of Exeter, Exeter, United Kingdom,2College of Life Sciences, University of Exeter, Exeter, United Kingdom,3Institute for Atmospheric and Climate Science, ETH Zürich, Zürich,
Switzerland,4Environment Canada, Climate Research Division, Toronto, Ontario, Canada,5ARC Centre of Excellence for Climate Systems Science & Climate Change Research Centre, University of New South Wales, Sydney, New South Wales, Australia,6Lund University, Lund, Sweden,7Centre for Ecology and Hydrology, Benson Lane, Wallingford, United Kingdom,
8National Center for Atmospheric Research, Boulder, Colorado, USA,9Centre for Ecology and Hydrology, Bush Estate,
Penicuik, United Kingdom,10Department of Animal & Plant Sciences, University of Sheffield, Sheffield, United Kingdom,
11Laboratoire des Sciences du Climat et de l’Environnement, CEA CNRS UVSQ, Gif-sur-Yvette, France,12Max Planck Institute
for Biogeochemistry, Jena, Germany,13Department of Atmospheric and Oceanic Science, University of Maryland, College Park, Maryland, USA,14Karlsruhe Institute of Technology, Garmisch-Partenkirchen, Germany
Abstract
We analyze the impacts of changing dry season length and intensity on vegetation productivity and biomass. Our results show a wetness asymmetry in dry ecosystems, with dry seasons becoming drier and wet seasons becoming wetter, likely caused by climate change. The increasingly intense dry seasons were consistently correlated with a decreasing trend in net primary productivity (NPP) and biomass from different products and could potentially mean a reduction of 10–13% in NPP by 2100. We found that annual NPP in dry ecosystems is particularly sensitive to the intensity of the dry season, whereas an increase in precipitation during the wet season has a smaller effect. We conclude that changes in water availability over the dry season affect vegetation throughout the whole year, driving changes in regional NPP. Moreover, these results suggest that usage of seasonal waterfluxes is necessary to improve our understanding of the link between water availability and the land carbon cycle.1. Introduction
Global temperatures have risen over the last century due to anthropogenic greenhouse gas emissions. As a consequence of warming, there has been an intensification of the global hydrological cycle, altering patterns of precipitation (P) and evapotranspiration (E) [Allen et al., 2010; Held and Soden, 2006; Ciais et al., 2013; Jung et al., 2010]. This points to changes on the global water cycle, although long-term global trends in hydrological variables are difficult to distinguish from decadal variability. This is partly due to the uncertainty of the underlying observa-tional data sets [Peel and McMahon, 2006; Seneviratne, 2012] but also by the limited length of most of the available time series, which makes it difficult to distinguish between short-term and long-term variabilities [Miralles et al., 2014]. As a result, the simple paradigm“wet gets wetter and dry gets drier” has been challenged recently [Greve et al., 2014]. Nonetheless, some regional (or latitudinal) trends can be identified [Sheffield et al., 2012; Zhang et al., 2007], and a global increase in the range between dry versus wet season precipitation has been reported [Chou et al., 2013], particularly over the tropics [Feng et al., 2013].
Soil moisture controls plant photosynthesis, influences growth and mortality and thus affects net primary productivity (NPP) and biomass [Doughty et al., 2015; Nemani et al., 2003; Reichstein et al., 2013]. There are several examples of this mechanistic relationship: The 2003 heat wave and drought in Europe was responsible for a steep decline in NPP [Ciais et al., 2005]; over the Amazon, the dry season has increased leading to morefires and lower NPP [Fu et al., 2013], and climate-driven drought was responsible for the continuous decrease in NPP over the Mongolian steppe [Liu et al., 2013]. Nevertheless, the effects of changes in seasonal water availability on annual NPP and biomass over the globe remain remarkably unknown (supporting information Text S1).
The concept of dry season is common in the literature, yet there is no single definition. Some studies use afixed time period to delimit dry seasons (e.g., driest 2 or 6 month period) [Westerling et al., 2006], while
Geophysical Research Letters
RESEARCH LETTER
10.1002/2016GL068240 Key Points:
• We show that the dry season has become more intense over the arid regions in recent decades
• We find a linear relationship between such increased intensity and a decrease in NPP.
• The trend is predicted to continue over the future, reducing global NPP between 10 and 13% by 2100 Supporting Information: • Supporting Information S1 Correspondence to: G. Murray-Tortarolo, gnm202@exeter.ac.uk Citation:
Murray-Tortarolo, G., et al. (2016), The dry season intensity as a key driver of NPP trends, Geophys. Res. Lett., 43, 2632–2639, doi:10.1002/2016GL068240. Received 12 FEB 2016
Accepted 10 MAR 2016
Accepted article online 15 MAR 2016 Published online 31 MAR 2016
©2016. American Geophysical Union. All Rights Reserved.
other definitions assume dry season length varies and are based on climate thresholds [Malhi et al., 2009; Zeng et al., 2005]. In order to investigate the link between changes in the availability of water contained in the land surface and NPP, we consider two seasonal indices based on net waterfluxes, i.e., the difference between evapotranspiration (E) and precipitation (P) and link them to the vegetation productivity from different sources. Thefirst index is the dry season length (DSL), which is defined as the cumulative number of months in which E is larger than P over a year (Figure 1a). The second index is the
Figure 1. Annual average (a) dry season length (d yr 1) and (b) dry season intensity (mm yr 1) calculated during the period 1989–2005, (c) dry season intensity trend (mm yr 2) during 1989–2005, (d) binned dry season intensity trend plotted against dry season length, while the red line represents the linear regression through the data (p< 0.001, r2= 0.67), and (e) median value for the regression slope of (Figure 1d) plus error, results from 1000 bootstrap simulations (box and whisker) for different datasets: observations, TRENDY-DGVMs, and CMIP5 ESMs (historical, natural forcing, and two future RCPs). Green: 1989–2005, red: 1901–2005, blue: 2006–2100. In grey mean slope value for 15 year periods (last year).
dry season intensity (DSI), defined as the cumulative value of E minus P during months when E is higher than P (Figure 1b).
2. Data and Methods
2.1. Data Sets
Our work is based on three time periods: 1989–2005 (where most observations for P and E are available), 1901–2005 (using a mixture of models and observations), and 2006–2100 (using Coupled Model Intercomparison Project Phase 5 (CMIP5) model output). We use observed monthly precipitation (P) data from CRU3.1 (Climate Research Unit) [Harris et al., 2013], Climate Prediction Center (CPC) [Higgins et al., 2000] and Global Precipitation Climatology Project [Adler et al., 2003] for the period 1989–2005 and from CRU3.1 for the extended period 1901–2005. For the period 1989–2005, we use monthly evapotranspiration (E) from the landflux-merged product [Mueller et al., 2013], which represents the ensemble of 24 different E data sets and is the closest data available to observations as it is compiled from in situ observations, satellite data, and models forced with observations. For the century time scale, 1901–2005, we use modeled monthly NPP and E from an ensemble of nine Dynamic Global Vegetation Models (DGVMs) from the S2 (CO2 + Climate) and S1 (CO2only) simulations of the Treends in net land carbon exchange (TRENDY) intercompar-ison project [Sitch et al., 2015] and also an ensemble from 16 Earth System Models (ESMs) from CMIP5 [Taylor et al., 2011]. The 0.25° annual passive microwave satellite-based vegetation optical depth (VOD) global pro-duct from 1989 to 2005 is used as implemented by Liu et al. [2011]. VOD is an indicator of vegetation water content of aboveground biomass and is able to capture long-term biomass changes over various land cover types at the global scale [Liu et al., 2011]. Monthly P, E, and NPP for the period 2006–2100 were extracted from an ensemble of 16 CMIP5 ESMs from simulations for the future greenhouse gas pathway scenarios RCP2.6 (Representative Concentration Pathways) and RCP8.5. We also compare our calculations for Dry Season Intensity (DSI) with satellite measurements of soil moisture from the European Space Agency Climate Change Initiative (ESA CCI) product [Dorigo et al., 2012] and the Palmer Drought Severity Index, as computed by Dai [2011a, 2011b] for the period 1989–2005 at an annual scale (see also supporting information Text S2). All data were regridded to a common 1° × 1° grid. In order to remove especially low productivity/desert areas, a mask is applied whereby grid cells where NPP is less than 5% of mean global (~50 g C m 2yr 1) are excluded.
It is important to notice that we tried to use state-of-the-art data sets, but we cannot guarantee full indepen-dency across them. For example some of the E products used in the landflux-merged product are based on P from CRU or CPC, similarly in PDSI and DSI. Nonetheless, we employed several data sets for each variable, which is likely to minimize the risk of data dependency.
2.2. Dry Season Intensity and Length
We used two indices of water availability:
1. Dry season length (DSL) is defined as the consecutive number of months where E > P. There can be multiple dry seasons in 1 year (see supporting information Text S3), and DSL is the sum of all. As DSL is the mean across multiple years and to facilitate the visualization of the data, we multiply the mean DSL for each grid by 30 and presented the result as days. We defined arid and semiarid regions as those having more than 4 months of DSL and wet regions as the rest.
2. Dry season intensity (DSI) is computed as the cumulative E P during the dry season. This is done allowing the integration to go across years, but DSI is defined as the maximum value for each year (i.e., in the event of two or more dry periods within a year). The same definition is used for wet season intensity (WSI) but inte-grating while P> E.
Importantly, all indices (WSI, DSL, and DSI) allow for the seasons to span over different calendar years; hence, their values are aligned with the vegetation phenology.
2.3. Data Analyses
We calculated the linear gridded trend in DSI, DSL, WSI, NPP, and biomass for each grid for the period 1989–2005 inclusive and for the different vegetation types as in Ramankutty and Foley [1999]. We plotted the trend in DSI against binned DSL values, by dividing DSL into 100 intervals (each size 3.65 days), so each point on the plot
corresponds to the mean of all grids with the same DSL value. To calculate the error on the regression slope we run a bootstrap test randomly removing 20% of the data and recalculating its value; this procedure was replicated 1000 times. The results are plotted in“box and whiskers” format. The same protocol was applied for the modeled data over the identical 17 year period, the twentieth century and the two future scenarios. We linked the trend in DSI to the trend in NPP using multiple products for vegetation productivity (supporting infor-mation Text S4). To calculate the DSI trend for the point-based observations (Long-Term Ecological Research (LTER) and FLUXNET), we used their own P and the nearest grid point for E from the landflux product; for the global pro-ducts we used DSI as calculated using the three P propro-ducts and ET from the landflux merge product. Global NPP and biomass trends from the DGVMs come from the S2 simulations (Climate + CO2). To compare the interannual variability of DSI and NPP, we used detrended NPP and calculated their correlation based on annual mean values. Finally, we removed the effect of CO2fertilization from NPP by using the S2-S1 runs (climate effect only) and we split the trend into dry and wet seasons, comparing them with the trend in DSI and WSI. We plotted all possible data combinations as binned linear regressions.
In allfigures m represents the slope of the linear regression and p values are also reported.
3. Results and Discussion
When linear trends in DSI were calculated for the period 1989–2005 (for which more E estimates are available), clear regional patterns emerged (Figure 1c). We found an increase in DSI (i.e., it is getting drier) over many arid and semiarid regions (regions with>4 months of DSL). On average, all arid and semiarid ecosystems (savannah, deserts, grasslands, shrublands, and the tropical dry forest) faced longer DSL (+1.1 d yr 1) higher DSI (+0.8 mm yr 1). In contrast, most wet ecosystems (regions with<4 months of DSL) (boreal forest, mixed forest, broadleaf deciduous, temperate needleleaf, and deciduous) experienced shorter and less intense dry seasons (DSL: 0.8 d yr 1, DSI: 0.9 mm yr 1). However, despite being wet ecosystems, both the tropical wet and the temperate broadleaf forests were exposed to longer (0.2 and 0.3 d yr 1, respectively) and more intense (+0.4 and +0.5 mm yr 1) dry seasons. This is consistent withfindings for these types of ecosystems by other authors [e.g., Zeng et al., 2005; Phillips et al., 2009; Doughty et al., 2015] (see also supporting information Texts S1 and S5). We found that the trends in DSI were correlated to the trends in PDSI from independent data sets [Dai, 2011a, 2011b] (r = 0.75) to soil moisture derived from the DGVMs (r = 0.59) and to soil moisture from satellite observa-tions (r = 0.41) [Dorigo et al., 2010], which shows consistency of the drying/wetting regions across the planet for this time period (supporting information Text S2). This suggests that DSI can ultimately be used as a proxy of soil water availability and its trends (at least during the dry season), with the advantage of including ecologically meaningful units that clearly link to vegetation processes (i.e., change in NPP per mm of water deficit). The trend in DSI increased linearly with DSL (p = 3e–23, r2= 0.67) (Figure 1d and 1989–2005 in Text S3). This indi-cates that over these 17 years, the dry season became more severe over arid and semiarid ecosystems but decreased in intensity over the wet regions (see also supporting information Text S6). Such an increase in dryness over the arid ecosystems happens in spite of the expected decreasing effect of global dimming on pan evapora-tion [Roderick et al., 2002], which should in turn lead to lower values for DSI. However, because of the short time-frame, this could be driven by the natural variability of the system. To rule this out, we replicated the observed results using E calculated from nines DGVMs to explore the behavior of the system further back in the twentieth century, as well as simulations from 16 CMIP5 models under natural and all forcing. We plot the value for the slope and calculate its error based on 1000 bootstrap simulations using 80% of the data. In all cases, a positive slope means that the dry season gets drier in regions with arid ecosystems than in areas where wet ecosystems are present. The same pattern was found in the observation-based products and models for the 17 year time period, with remarkably similar slope values (m = 0.03 mm yr 2d 1of dry season) (Figure 1e, green). Over the period 1901–2005, only a small change in intensity across ecosystems was observed, mostly due to the last 30 years (Figure 1e, red). However, when the century was split into 15 year intervals, the increased E P imbalance became more evident in the 1989–2005 time period. Over these 17 years the consistent trend in CMIP5 simulations under all forcing and the difference with the simulations under natural forcing suggest that the observed trend is unlikely to be driven by the natural variability of the Earth System, but it is rather an effect of anthropogenic climate change. The pattern is also similar for the two future scenarios: the low-emission scenario RCP2.6 revealed a similar slope to the present day, in spite of temperature and precipitation stabilization
at the end of the 21st century; in the more extreme RCP8.5 scenario the slope was almost twice as strong (Figure 1e, blue). Hence, both the recent observational-based data and the model projections display a similar tendency toward an increased intensity in regions with long dry seasons. However, decadal variability could also play a role for the former given the limited length of the considered time period.
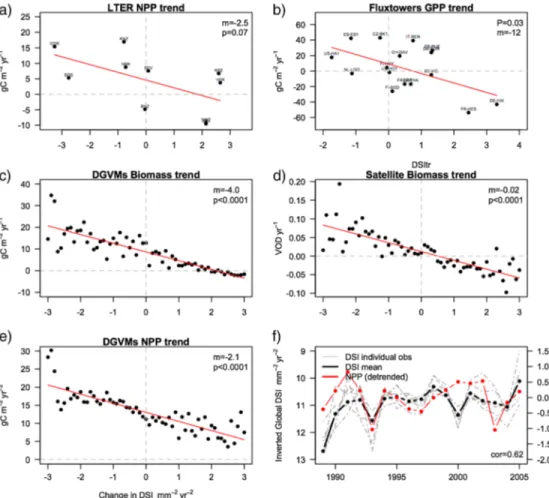
As the dry season intensity represents the maximum water deficit for the vegetation [Engelbrecht et al., 2006, 2007], we hypothesize that this asymmetric trend in the intensity must also have a visible signal on the vege-tation productivity. To test this, we used NPP fromfield observed data sets (LTER and FLUXNET sites) and glo-bal products for NPP and biomass (DGVMs and satellite) and compared their trend against the change in DSI (supporting information Text S7). In all cases, we found a consistent negative correlation between DSI and the vegetation productivity or biomass trend (Figure 2). In other words, as the dry season gets longer and more intense in arid ecosystems, the vegetation productivity and biomass decrease (see also supporting informa-tion Text S1). Although modeled results suggest that the trend in NPP is always positive (as a result of CO2 fertilization) we found smaller NPP trends in regions of positive DSI and negative NPP trends when the effect of CO2was removed. In addition, we found that the temporal evolution of the anomalies in global annual NPP was correlated (0.62) with the mean DSI of the planet (Figure 2f), although the relationship was stronger when DSI values were more extreme (e.g., 1992–1995) than when they were closer to the average (e.g., 2000–2003), when global NPP likely responds to other drivers. This extends on the argument of Poulter et al. [2014] and Ahlström et al. [2015] who showed a large contribution of arid and semiarid ecosystems to the interannual variability of the C cycle, driven by the patterns we showed above.
Figure 2. Correlation between the trend in the cumulative E P during the dry season and the trend in the annual vegetation productivity using different products. (top) Point-based observations. (a) Long-term ecological research NPP for nine sites (letters indicate the names). (b) Fluxtower GPP for 13 sites (letters indicate the names). For site names and info see supporting information Table S4. (bottom) Global products. (c) DGVM biomass, (d) Satellite VOD, (e) DGVMs NPP, and (f) temporal evolution (1989–2005) of the mean global DSI (mean of six possible combinations of observed data sets) against the anomaly in global NPP from nine DGVMs; grey lines represent individual combinations for different E and P observations.
It is notable that the impact of increasing DSI over the land C cycle begins over the last 30 years, after which the land C cycle sensitivity to DSI is expected to remain at present-day levels for the next 100 years (supporting information Text S7). This implies that during that period, arid ecosystems will face longer and more intense dry seasons, which alone would in turn lead to a NPP reduction of 50–310 g C m 2, depending on the future climate scenario. This translates to a global reduction of 10–13% of total NPP by 2100 due to increased dryness (supporting information 8).
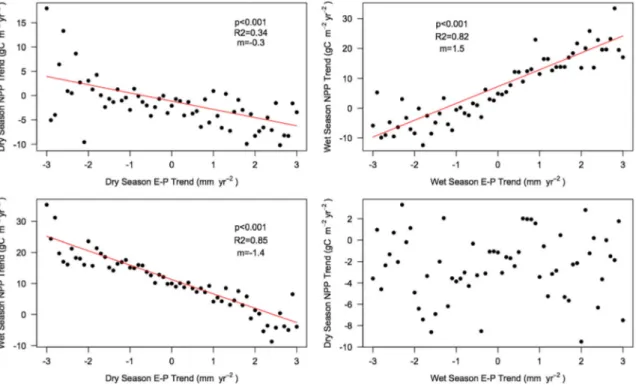
To explore why the effect of increasing dryness in one season drives the trend in annual NPP, we removed the CO2fertilization effect (focusing on the climate effect only), split NPP between wet and dry seasons and compared it with the change in wet and dry season intensity during that time. We found that the wet season intensity (WSI) trends were linked only to changes in NPP during the wet season but not during the rest of the year (Figure 3). In contrast, the effect of changing dryness in the dry season appeared in both seasons. This suggests that changes in DSI also affect productivity during the wet season.
We propose two possible mechanisms for this process:first, increasingly dry soils take longer to recover, leading to shorter effective growing seasons and longer time periods with closed stomata. This in turn leads to C starvation and reduces C reserves, leaf area index, and NPP, which in the long term also reduces biomass growth [Adams et al., 2009]. The second possible mechanism is an increase in mortality as a consequence of hydraulic failure, which in turn leads to decreasing NPP [McDowell et al., 2008]. Such a decrease in NPP and an increase in mortality due to a greater DSI have been recently observed over the Amazon [Doughty et al., 2015]. On the other hand, changes in the wet season are not carried through to the dry season, mainly because excess water is not stored and is likely lost as subsurfaceflow or river runoff. This result could be partly related to limitations of the dry/wet season intensity metrics to capture real soil moisture availability, particularly, in the ability of the WSI to reproduce saturated soils (as soil water capacity is not taken into account in the calculations) and because our indices may not be able to capture the temporal memory of soil moisture dynamics for all types of ecosystems. Nonetheless, Cadule et al. [2010] found a similar pattern when compar-ing wet and dry years across the globe, with dry years havcompar-ing a larger effect on NPP than wet ones. Therefore, it seems that an increase in dryness has a much larger impact on vegetation productivity than an excess of water both seasonally and annually.
Figure 3. Seasonal effect of changes in water availability (E P) on seasonal NPP for climate simulations only. (top left) Dry season NPP trend against dry season E P trend. (Top right) Wet season NPP trend against wet season E P trend. (bottom) The same effect, but across seasons.
We conclude that changes in water availability over the dry season affect vegetation throughout the whole year, driving trends in NPP globally at different time scales (past, present, and future under climate change). Our seasonal index, the dry season intensity, gives a strong estimate of the expected evolution of NPP using simple calculations derived from a basic water balance. Moreover, we propose that usage of seasonal water fluxes is necessary to improve our understanding of the link between water availability and the land carbon cycle, as the effects of changes during specific seasons might be lost on an annual time scale. Finally, our results suggest that the strength of the carbon-climate feedback might intensify in the future, reducing natural offsetting of fossil fuel emissions through vegetation capture of atmospheric CO2as a consequence of increased seasonality and dryness intensity.
References
Adams, H. D., M. Guardiola-Claramonte, G. A. Barron-Gafford, J. C. Villegas, D. D. Breshears, C. B. Zou, P. A. Troch, and T. E. Huxman (2009), Temperature sensitivity of drought-induced tree mortality portends increased regional die-off under global change-type drought, Proc. Natl. Acad. Sci. U.S.A., doi:10.1073/pnas.0901438106.
Adler, R. F., et al. (2003), The Version-2 Global Precipitation Climatology Project (GPCP) monthly precipitation analysis (1979–present), J. Hydrometeorol., 4, 1147–1167, doi:10.1175/1525-7541(2003)004<1147:TVGPCP>2.0.CO;2.
Ahlström, A., et al. (2015), The dominant role of semi-arid ecosystems in the trend and variability of the land CO2sink, Science, 348, 895–899,
doi:10.1126/science.aaa1668.
Allen, C. D., et al. (2010), A global overview of drought and heat-induced tree mortality reveals emerging climate change risks for forests, For. Ecol. Manage., 259, 660–684, doi:10.1016/j.foreco.2009.09.001.
Cadule, P., P. Friedlingstein, L. Bopp, S. Sitch, C. D. Jones, P. Ciais, S. L. Piao, and P. Peylin (2010), Benchmarking coupled climate-carbon models against long-term atmospheric CO2measurements, Global Biogeochem. Cycles, 24, GB2016,
doi:10.1029/2009GB003556.
Chou, C., J. C. H. Chiang, C.-W. Lan, C.-H. Chung, Y.-C. Liao, and C.-J. Lee (2013), Increase in the range between wet and dry season precipitation, Nat. Geosci., 6, 263–267, doi:10.1038/ngeo1744.
Ciais, P., et al. (2005), Europe-wide reduction in primary productivity caused by the heat and drought in 2003, Nature, 437, 529–533, doi:10.1038/nature03972.
Ciais, P., et al. (2013), Carbon and Other Biogeochemical Cycles, in Cli- mate Change 2013: The Physical Science Basis. Contribution of Working Group I to the Fifth Assessment Report of the Intergovernmental Panel on Climate Change, edited by T. F. Stocker, et al., Cambridge Univ. Press, Cambridge, U. K., and New York.
Dai, A. (2011a), Characteristics and trends in various forms of the Palmer Drought Severity Index (PDSI) during 1900–2008, J. Geophys. Res., 116, D12115, doi:10.1029/2010JD015541.
Dai, A. (2011b), Drought under global warming: A review, Wiley Interdiscip. Rev. Clim. Change, 2, 45–65, doi:10.1002/wcc.81.
Dorigo, W. A., K. Scipal, R. M. Parinussa, Y. Y. Liu, W. Wagner, R. A. M. de Jeu, and V. Naeimi (2010), Error characterisation of global active and passive microwave soil moisture datasets, Hydrol. Earth Syst. Sci., 14, 2605–2616, doi:10.5194/hess-14-2605-2010.
Dorigo, W., R. de Jeu, D. Chung, R. Parinussa, Y. Liu, W. Wagner, and D. Fernández-Prieto (2012), Evaluating global trends (1988–2010) in harmonized multi-satellite surface soil moisture, Geophys. Res. Lett., 39, L18405, doi:10.1029/2012GL052988.
Doughty, C. E., et al. (2015), Drought impact on forest carbon dynamics andfluxes in Amazonia, Nature, 519, 78–82.
Engelbrecht, B. M. J., J. W. Dalling, T. R. H. Pearson, R. L. Wolf, D. A. Gálvez, T. Koehler, M. T. Tyree, and T. A. Kursar (2006), Short dry spells in the wet season increase mortality of tropical pioneer seedlings, Oecologia, 148, 258–269, doi:10.1007/s00442-006-0368-5.
Engelbrecht, B. M. J., L. S. Comita, R. Condit, T. A. Kursar, M. T. Tyree, B. L. Turner, and S. P. Hubbell (2007), Drought sensitivity shapes species distribution patterns in tropical forests, Nature, 447, 80–82, doi:10.1038/nature05747.
Feng, X., A. Porporato, and I. Rodriguez-Iturbe (2013), Changes in rainfall seasonality in the tropics, Nat. Clim. Change, 3, 811–815, doi:10.1038/nclimate1907.
Fu, R., et al. (2013), Increased dry-season length over southern Amazonia in recent decades and its implication for future climate projection, Proc. Natl. Acad. Sci. U.S.A., 110, 18,110–18,115, doi:10.1073/pnas.1302584110.
Greve, P., B. Orlowsky, B. Mueller, J. Sheffield, M. Reichstein, and S. I. Seneviratne (2014), Global assessment of trends in wetting and drying over land, Nat. Geosci., 7, 716–721, doi:10.1038/ngeo2247.
Harris, I., P. D. Jones, T. J. Osborn, and D. H. Lister (2013), Updated high-resolution grids of monthly climatic observations—The CRU TS3.10 Dataset, Int. J. Climatol., 623–642, doi:10.1002/joc.3711.
Held, I., and B. Soden (2006), Robust responses of the hydrological cycle to global warming, J. Clim., 19, 5686–5699.
Higgins, R. W., A. Leetmaa, Y. Xue, and A. Barnston (2000), Dominant factors influencing the seasonal predictability of U.S. precipitation and surface air temperature, J. Clim., 13, 3994–4017, doi:10.1175/1520-0442(2000)013<3994:DFITSP>2.0.CO;2.
Jung, M., et al. (2010), Recent decline in the global land evapotranspiration trend due to limited moisture supply, Nature, 467, 951–954, doi:10.1038/nature09396.
Liu, Y. Y., R. M. Parinussa, W. A. Dorigo, R. A. M. De Jeu, W. Wagner, A. I. J. M. van Dijk, M. F. McCabe, and J. P. Evans (2011), Developing an improved soil moisture dataset by blending passive and active microwave satellite-based retrievals, Hydrol. Earth Syst. Sci., 15, 425–436, doi:10.5194/hess-15-425-2011.
Liu, Y. Y., J. P. Evans, M. F. McCabe, R. A. M. de Jeu, A. I. J. M. van Dijk, A. J. Dolman, and I. Saizen (2013), Changing climate and overgrazing are decimating Mongolian steppes, PLoS One, 8, e57599, doi:10.1371/journal.pone.0057599.
Malhi, Y., L. E. O. C. Aragão, D. Galbraith, C. Huntingford, R. Fisher, P. Zelazowski, S. Sitch, C. McSweeney, and P. Meir (2009), Exploring the likelihood and mechanism of a climate-change-induced dieback of the Amazon rainforest, Proc. Natl. Acad. Sci. U.S.A., 106, 20,610–20,615, doi:10.1073/pnas.0804619106.
McDowell, N., et al. (2008), Mechanisms of plant survival and mortality during drought: Why do some plants survive while others succumb to drought? New Phytol., 178, 719–739, doi:10.1111/j.1469-8137.2008.02436.x.
Miralles, D. G., et al. (2014), El Niño-La Niña cycle and recent trends in continental evaporation, Nat. Clim. Change, 4, 122–126, doi:10.1038/ nclimate2068.
Acknowledgments
Guillermo Murray-Tortarolo thanks CONACYT-CECTI, Secretaria de Educacion Publica of Mexico (SEP), and the University of Exeter for their funding during his PhD Studies. The authors extend their thanks to the Short-Term Scientific Mission (STSM) from the TERRABITES COST Action ES0805 for making this contribution possible. This work was supported by the European Commission’s 7th Framework Programme under grant agreement 282672 (EMBRACE) and by the European Union’s Horizon 2020 research and innovation programme under grant agreement 641816 (CRESCENDO). Y.L. is the recipient of an Australian Research Council DECRA Fellowship (project DE140100200). C.H. acknowledges the NERC National Capability fund. All data sets used in this work are freely available online as spe-cified in section 2.1, and postprocessed data are freely available on request (gnm202@exeter.ac.uk).
Mueller, B., et al. (2013), Benchmark products for land evapotranspiration: LandFlux-EVAL multi-dataset synthesis, Hydrol. Earth Syst. Sci. Discuss., 10, 769–805, doi:10.5194/hessd-10-769-2013.
Nemani, R. R., C. D. Keeling, H. Hashimoto, W. M. Jolly, S. C. Piper, C. J. Tucker, R. B. Myneni, and S. W. Running (2003), Climate-driven increases in global terrestrial net primary production from 1982 to 1999, Science, 300, 1560–1563, doi:10.1126/science.1082750.
Peel, M. C., and T. A. McMahon (2006), Continental runoff: A quality-controlled global runoff data set, Nature, 444, E14–E14, doi:10.1038/ nature05480.
Phillips, O. L., et al. (2009), Drought sensitivity of the Amazon rainforest, Science, 323, 1344–1347.
Poulter, B., et al. (2014), Contribution of semi-arid ecosystems to interannual variability of the global carbon cycle, Nature, 509, 600–603, doi:10.1038/nature13376.
Ramankutty, N., and J. A. Foley (1999), Estimating historical changes in global land cover: croplands from 1700 to 1992, Global Biogeochem. Cycles, 13(4), 997–1027.
Reichstein, M., et al. (2013), Climate extremes and the carbon cycle, Nature, 500, 287–295, doi:10.1038/nature12350.
Roderick, M. L., and G. D. Farquhar (2002), The cause of decreased pan evaporation over the past 50 years, Science, 298, 1410–1411. Seneviratne, S. I. (2012), Climate science: Historical drought trends revisited, Nature, 491, 338–339, doi:10.1038/491338a.
Sheffield, J., E. F. Wood, and M. L. Roderick (2012), Little change in global drought over the past 60 years, Nature, 491, 435–438, doi:10.1038/ nature11575.
Sitch, S., et al. (2015), Recent trends and drivers of regional sources and sinks of carbon dioxide, Biogeosciences, 12, 653–679, doi:10.5194/ bg-12-653-2015.
Taylor, K. E., R. J. Stouffer, and G. A. Meehl (2011), An overview of CMIP5 and the experiment design, Bull. Am. Meteorol. Soc., 93, 485–498, doi:10.1175/BAMS-D-11-00094.1.
Westerling, A. L., H. G. Hidalgo, D. R. Cayan, and T. W. Swetnam (2006), Warming and earlier spring increase Western U.S. forest wildfire activity, Science, 313, 940–943, doi:10.1126/science.1128834.
Zeng, N., H. Qian, C. Roedenbeck, and M. Heimann (2005), Impact of 1998–2002 midlatitude drought and warming on terrestrial ecosystem and the global carbon cycle, Geophys. Res. Lett., 32, L22709, doi:10.1029/2005GL024607.
Zhang, X., F. W. Zwiers, G. C. Hegerl, F. H. Lambert, N. P. Gillett, S. Solomon, P. A. Stott, and T. Nozawa (2007), Detection of human influence on twentieth-century precipitation trends, Nature, 448, 461–465, doi:10.1038/nature06025.