HAL Id: halshs-00564972
https://halshs.archives-ouvertes.fr/halshs-00564972
Preprint submitted on 10 Feb 2011
HAL is a multi-disciplinary open access archive for the deposit and dissemination of sci-entific research documents, whether they are pub-lished or not. The documents may come from teaching and research institutions in France or abroad, or from public or private research centers.
L’archive ouverte pluridisciplinaire HAL, est destinée au dépôt et à la diffusion de documents scientifiques de niveau recherche, publiés ou non, émanant des établissements d’enseignement et de recherche français ou étrangers, des laboratoires publics ou privés.
Working in family firms: less paid but more secure?
Evidence from French matched employer-employee data
Andrea Bassanini, Thomas Breda, Eve Caroli, Antoine Rebérioux
To cite this version:
Andrea Bassanini, Thomas Breda, Eve Caroli, Antoine Rebérioux. Working in family firms: less paid but more secure? Evidence from French matched employer-employee data. 2010. �halshs-00564972�
WORKING PAPER N° 2010 - 40
Working in family firms: less paid but more secure?
Evidence from French matched employer-employee data
Andrea Bassanini Thomas Breda
Eve Caroli Antoine Rebérioux
JEL Codes: G34, J31, J33, J63, L26
Keywords: family firms, wages, job security, linked employer-employee data
P
ARIS-
JOURDANS
CIENCESE
CONOMIQUES48,BD JOURDAN –E.N.S.–75014PARIS TÉL. :33(0)143136300 – FAX :33(0)143136310
www.pse.ens.fr
CENTRE NATIONAL DE LA RECHERCHE SCIENTIFIQUE –ECOLE DES HAUTES ETUDES EN SCIENCES SOCIALES
November 2010
Working in family firms: less paid but more secure?
*Evidence from French matched employer-employee data
Andrea Bassanini
(OECD, ERMES-University Paris II and IZA) Thomas Breda
(ENS and Paris School of Economics) Eve Caroli
(University Paris Ouest-EconomiX and Paris School of Economics) Antoine Rebérioux
(University Paris Ouest-EconomiX)
Key words: family firms, wages, job security, linked employer-employee data JEL codes: G34, J31, J33, J63, L26
*
We are grateful to Vincent Bignon, Sandra Black, Samuel Bowles, Vincenzo Galasso, Roberto Galbiati, Thomas Philippon, Alfonso Rosolia, Sebastien Roux, Stefano Scarpetta, Fabiano Schivardi, John Van Reenen and audiences in the London CAED conference and Lyon-GATE seminar for useful comments and suggestions. We also thank David Sraer and David Thesmar for sharing their data with us. The authors acknowledge financial support from the French research agency (Agence Nationale de la Recherche) – Grant n° ANR-08-JCJC-0067-01.
Abstract
We study the compensation package offered by family firms. Using matched employer-employee data for a sample of French establishments in the 2000s, we first show that family firms pay on average lower wages to their workers. This family/non-family wage gap is robust to controlling for several establishment and individual characteristics and does not appear to be due either to the differential of productivity between family and non-family firms or to unobserved establishment and individual heterogeneity. Moreover, it is relatively homogeneous across workers with different gender, educational attainment and age. By contrast, the family/non-family wage gap is found to be larger for clerks and blue-collar workers than for managers, supervisors and technicians, for whom we find no significant wage gap. As a second step, we investigate why workers stay in family firms while being paid less. We show that these firms offer greater job security. We find evidence that the rate of dismissal is lower in family than in non-family firms. We also show that family firms rely less on dismissals and more on hiring reductions when they downsize. These results are confirmed by subjective data: the perceived risk of dismissal is significantly lower in family firms than in non-family ones. We speculate that our results can be explained either by a compensating wage differential story or by a model in which workers sort in different firms according to their preferences.
Résumé
Nous étudions les systèmes de rémunérations en vigueur dans les entreprises familiales. Sur la base de données employeurs-salariés appariées portant sur un échantillon d'établissements français dans les années 2000, nous montrons dans un premier temps que les entreprises familiales versent des salaires plus faibles que les entreprises non familiales. Cet écart de salaires est robuste à l'introduction d'une série de contrôles portant sur les caractéristiques des établissements et des salariés. De plus, il n'apparaît pas dû à l'écart de productivité existant entre entreprises familiales et non familiales, ni à une éventuelle hétérogénéité inobservée entre établissements ou salariés. Par ailleurs, l'écart de salaires entre entreprises familiales et non familiales est relativement homogène entre hommes et femmes et entre salariés ayant des niveaux d'éducation différents. En revanche, il est plus important pour les CSP inférieures (ouvriers et employés) que pour les CSP supérieures (techniciens, contremaîtres et cadres) pour lesquelles il n'est par ailleurs pas significatif.
Dans un second temps, nous nous interrogeons sur les raisons pour lesquelles les salariés restent dans les entreprises familiales si les salaires y sont plus faibles. Nous montrons que la sécurité de l'emploi y est plus élevée. Le taux de licenciement apparaît ainsi plus faible dans les entreprises familiales que dans les non familiales. Nous montrons également que les entreprises familiales ont moins recours aux licenciements et plus aux réductions d'emploi quand elles font face à un choc négatif sur leur niveau d'emploi. Ces résultats sont confirmés par ceux que l'on obtient sur données subjectives : le risque de licenciement perçu par les salariés est plus faible dans les entreprises familiales que dans les non familiales. Nous conjecturons que nos résultats sont compatibles avec deux types d'explications : un modèle de différences compensatrices de salaires et un modèle dans lequel les salariés s'auto-sélectionnent dans les entreprises familiales ou non sur la base de leurs préférences.
Introduction
Family firms have attracted much interest both in the recent economics and finance literature. Most studies have focused on their performance (see Bertrand and Schoar, 2006). In particular, they have tried to assess whether family firms are efficient1 – in which case the value of the firm is maximised for all shareholders – or whether they give rise to private benefits of control – in which case the value is maximised for family shareholders only, at the expense of minority shareholders (see e.g. Villalonga and Amit, 2010). The main issue in this literature is therefore how profits are divided among shareholders. A much less researched issue is how value-added is shared between shareholders and the other main category of stakeholders, namely employees. The existing literature focuses almost exclusively on CEOs and top managers and most papers suggest that they get paid less in family firms than in non family ones – see Gomez-Mejia et al (2003), Bach and Serrano-Velarde (2009) and Bandiera et al (2010). In contrast, the compensation of non-managerial workers has been largely neglected.
In this paper, we focus on all categories of employees. We first investigate whether family firms pay on average lower wages. We find that this is actually the case and that the family/non-family wage gap is larger for workers in lower-skilled occupations. We then consider the reasons why wages would be lower in family-owned companies. We show that these firms offer a specific compensation package in which lower wages are associated with greater job security. This suggests that workers may be indifferent between working in family or non-family firms or, alternatively, that workers with high risk aversion self-select into family-owned companies.
We build a unique dataset by matching individual and establishment-level data on firm ownership, company accounts, establishment characteristics, worker flows and employees' social security records including wages. Looking at evidence on family firms in France is interesting since they account for a large share of national employment. Our main dataset contains a cross-section of 2,650 establishments in 2004 – of which a vast majority are not listed on the stock market. We also have longitudinal information on a subset of establishments. Using these data, we estimate Mincerian wage equations augmented by family ownership. Controlling for standard workers' and establishments' characteristics as well as the presence of union representative,2 we find that net hourly wages are about 3% lower in family firms than in non-family companies.
1
The empirical evidence on this point is far from being clear cut. Some papers find that family firms out-perform (Anderson and Reeb, 2003; Villalonga and Amit, 2006; Sraer and Thesmar, 2007; Fahlentrach, 2009), which suggests that they are more efficient than non-family firms. In contrast, other studies provide evidence that family firms under-perform (Claessens et al, 2000; Morck et al, 2000; Cronqvist and Nilsson, 2003) in particular when control is passed on to the descendants (Perez-Gonzalez, 2006; Bennedsen et al, 2007; Villalonga and Amit, 2010).
2
Mueller and Philippon (2010) show that French family firms are less unionised than non-family ones. To the extent that unions succeed in bargaining for higher wages, this may be one obvious determinant of lower wages in family firms. This is why we control for the presence of union representative in our estimates.
The literature suggests several reasons for this family wage penalty. In a seminal paper on managerial practices in developed countries, Bloom and Van Reenen (2007) show that family firms are less innovative and therefore less productive than non-family firms. This could be a reason why wages are lower in family firms. We show that in our sample family firms are indeed less innovative, but that this does not account for the entire family/non-family wage gap: controlling for the use of information and communication technologies (ICT), innovative managerial practices and/or for firm level productivity, we still find a wage penalty in family firms close to 3%.
The literature on CEO compensation also suggests that compensation should be lower in family firms, at least for top managers. Agency theory indeed states that executive compensation is designed to align the interests of managers with those of shareholders (Murphy, 1999). As underlined by Jensen and Meckling (1976) the risk of misalignment is larger for firms with dispersed ownership because it is more difficult for shareholders to control managers' actions. In contrast, managers have less discretion as to the actions they take when there are large blockholders. So, in equilibrium, managers' compensation (including wages, premiums and bonuses) should be lower in family firms, where control is tighter. To the extent that managers are more directly monitored by firm owners than workers in lower skilled occupations (who tend to be monitored by managers), agency problems arising from the ownership status of the firm are likely to be stronger for managers than at lower layers in the hierarchy. A related prediction is that, if agency problems have any role in explaining the family wage penalty, the latter should be larger for managers than for workers in lower-skilled occupations. The literature on entrenched managers, or the “skimming view” of CEO compensation (Gabaix and Landier, 2008), provides similar predictions: CEOs with more discretion will pay themselves higher wages, as they are able to extract private rent (Bertrand and Mullainathan, 2001; Bebchuk and Fried, 2004). They will also pay higher wages to their managerial co-workers in order to enjoy a more pleasant working environment (Cronqvist et al, 2009). In sum, entrenchment should benefit managerial co-workers much more than any category of employees.
In contrast, we find that the family/non-family wage3 gap appears to be, if anything, larger for low-skilled workers (namely blue-collars and clerks) than for high-skilled ones (technicians, supervisors and managers) even controlling for establishment fixed-effects: the estimated gap for workers in low-skilled occupations is about 4% larger than for workers in high-skilled occupations. This suggests that agency problems are not likely to be the main determinant of the family wage penalty that we observe. In addition, we find that, after controlling for unobserved heterogeneity across establishments, the family/non-family wage gap is relatively homogeneous across other dimensions of worker heterogeneity: the difference in wages across family and non-family firms is about the same for men and women, for
3
workers with different educational levels and, once ICT intensity is controlled for, for young and older workers.
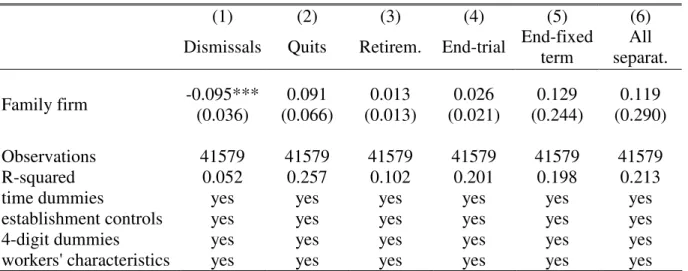
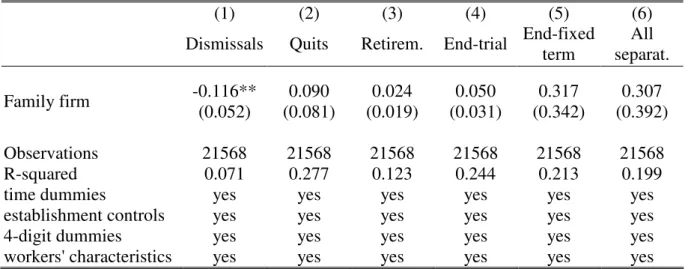
Our results raise a major issue: why should workers continue to work in family firms if paid less? The literature in finance suggests that families may have longer time horizons than non-family shareholders so that they are more likely to grasp long-term profitable investment opportunities (Anderson and Reeb, 2003). To the extent that long-term employment relations allow building valuable specific human capital within firms, family ownership is expected to be positively associated with job security (Stavrou et al., 2006). We test this assumption in three different ways. Using quarterly data on hirings and separations over 2000-2007, we first show that the rate of dismissal is lower in family than in non-family firms, with the gap being as large as 15%, even when controlling for employment growth at the establishment level. We also investigate whether family firms rely less on dismissals than non-family firms when they downsize, and find that this is actually the case. This is a key point from the point of view of incumbent workers: if employed in a family firm, they face a lower risk of job loss when the firm is hit by a negative shock and has to destroy jobs. When this occurs, family firms appear to reduce hirings more and increase dismissals less than non-family firms, in order to accommodate the required staffing changes. These results are confirmed by subjective data: the perceived risk of dismissal is significantly lower in family firms than in family ones. Interestingly, the gap in perceived job security across family and non-family firms is particularly large for workers in unskilled occupations. This parallels the fact that the family wage penalty is larger for lower-skilled workers. Overall, our results on subjective and objective job security suggest that family firms do actually offer a specific compensation package with lower wages but greater job security.
Our paper is one of the very few investigating non-CEO pay in family firms. The only other paper we are aware of is Sraer and Thesmar (2007). On a repeated cross-section of French listed firms over 1994-2000, they estimate firm-level wage equations. Controlling for the workforce’s occupational structure, they find a wage penalty of about 4.5% in family firms run by heir CEOs as compared to widely-held companies. Our paper shows that a similar family/non-family wage gap is also found in non-listed companies and that it is essentially borne by lower-skilled workers. Focusing on non-listed firms is a key point since they typically represent a very large share of employment. Moreover it allows us to have greater over-time variation in ownership status in our sample: listed companies are often large holdings which rarely change ownership status whereas individual, non-listed firms may be sold by one holding to another one, leading to a larger amount of ownership changes between family and non-family holders. This allows us to improve on Sraer and Thesmar (2007) on a second dimension, namely the control for heterogeneity across establishments. Exploiting the panel dimension of our data, we show that changes in ownership
status from family to non-family are associated with a substantial increase in wages and that firms which become non-family were not already paying higher wages.
Our paper also contributes to a second strand of literature which focuses on job security in family firms. The key point in this literature is that family firms, being more long-term oriented than non-family ones, they can more credibly commit to implicit contracts thereby providing employment insurance to their employees. So far, most papers have tackled this issue only indirectly. Stavrou et al (2006) and Block (2010) investigate the relationship between family-business status and downsizing. Both papers find that family ownership is associated with smaller employment reductions conditional to downsizing. The problem in interpreting these results is that a given amount of job destruction can result either from workers’ voluntary quits or from dismissals and that only dismissals affect job security of incumbent workers. Sraer and Thesmar (2007) study the covariation of firm employment changes and industry-level shocks. They find that employment growth at the firm level is less sensitive to industry level shocks in family firms than in non-family ones. However, this result does not provide an unambiguous proof that workers’ job security is greater in family firms insofar as the literature on job and worker flows (e.g. Davis et al., 1997, 2006) shows that idiosyncratic shocks at the establishment level are far more important than industry shocks in determining establishment-level employment adjustment. We improve on these papers by directly focusing on the risk of job loss for incumbent workers. As far as we know, our paper is the first one to show that family firms display lower rates of dismissals even when controlling for employment destruction. This is not compensated by higher rates of other involuntary types of separations, suggesting that workers in family firms do face a lower risk of job loss. We also show that incumbents are more protected in family firms because these firms rely more on hiring reductions and less on dismissals than non-family firms when contracting employment. Consistently with this evidence, we show that workers in family firms perceive a lower risk of job loss. This set of results, we argue, provides direct evidence of greater job security in family firms.
The layout of the rest of the paper is as follows. Section 1 presents the empirical strategy. Section 2 describes the dataset and presents summary statistics. Section 3 reports results on the relation between family ownership, wages and job security. Section 4 concludes.
1. The empirical specification
1.1 The wage equationsIn the first part of this article, we estimate the relationship between family ownership and wages. In order to do that we start from a standard Mincer equation (see Mincer, 1974):
i i i i i i Zb rs x x u w = + + + 2+ log δ γ (1)
where wi denotes individual earnings, si a measure of schooling, xian experience measure, Zi a set of other variables assumed to affect earnings and ui a standard error term.
In our setting, one of the key determinants of individual wages is the type of ownership of the firm where the individual is employed. So, we extend equation (1) in order to introduce family ownership as an explanatory variable. We then rewrite it as:
ij j i j ij F X X w =γ + α+ β+ε log (2)
where wijis the net hourly wage of worker i employed in establishment j as of year 2004, Fj is a dummy variable equal to 1 if the firm to which the establishment belongs is family-owned and 0 otherwise, Xi is a vector of individual characteristics including schooling and experience (as proxied by the introduction of age and tenure). We also control for a set of establishment and firm-level variables (Xj) including industry and regional dummies. Finally, εij is a standard error term.
Given that individual wage information is only available for a small number of workers in each establishment4, we also estimate wage equations at the establishment level:
j j j j F X w =γ + β+ε log (3)
where wj is the average hourly wage at the establishment level in 2004.5
One issue with our estimates is that they might be driven by unobserved heterogeneity across establishments. In order to control for heterogeneity in time-invariant characteristics, we re-estimate equation (3) in long differences:
j j j j F X w =γ∆ +∆ β+η ∆ log (4)
where ∆logwj denotes the change in the average gross annual wage at the firm level between 1998 and 2004.6 ∆Fj is the change in ownership over the period (namely family ownership in 2004 minus family ownership in 1998) and ∆Xj is a set of time-varying establishment controls.7
4
On average we have individual information on a subsample of about four workers per establishment, even if establishments in our dataset employ at least twenty employees (see Section 2).
5
Computed using all employees in the establishment.
6
We do not have establishment-level data on wages for 1998 (see Section 2. for more details on the data).
7
One of the issues that we address in this paper is whether the wage gap that may exist between family and non-family firms is homogenous across workers. In order to test for this, we augment equation (2) by introducing interaction terms between workers' characteristics and family ownership:
ij j j i i j ij F X X F X w =γ + α+ δ+ β+ε log (5)
In order to better control for unobserved heterogeneity across establishments, some specifications of equation (5) include establishment fixed effects. The wage equation then writes:
ij j j i i ij X X F w = α+ δ+µ +ε log (6) 1.2 Job security
Once we have assessed the relationship between family ownership and wages, we investigate whether family firms offer a specific compensation package including more job security. In order to do so, we first estimate the relationship between family ownership and different types of separation rates. In our data, separation rates are available for each quarter over 2000-2007 whereas family ownership, establishment and firm-level controls are available only for the year 2004. Some types of separations, including dismissals, fluctuate quite a lot over time. Therefore, we estimate them over a rather long time period (2000-2007). The model that we estimate is thus:
jt t j j a jt F X D S =γ + β+ +ε (7)
where Sajt is the separation rate of type a (dismissal, voluntary quit, retirement, end of trial period and end of fixed-term contract), in establishment j at time t, Fjis our dummy variable indicating family ownership, Xj is a vector of establishment and firm-level controls and Dt is a time dummy.
8
As we try to establish some statements concerning job security, our main interest is on dismissal rates. Nevertheless, it is important to look also at other types of separations in order to make sure that a low level of one type of separation is not compensated for by a high level of another type.
A particularly important issue for the job security of an incumbent worker is the behaviour of her employer when a negative shock forces it to destroy jobs. In such a case, there is clearly a greater risk that her position be suppressed independently of the effort she pays in her job. We estimate, therefore, whether, when family firms are hit by a bad shock and downsize, they rely more or less on dismissals
8
We also conduct robustness checks on a shorter time period (2004-2007). Overall, for each type of separation, estimating equation (7) is equivalent to regressing its average rate over the period on our cross-sectional variables. However, given that there are many missing values concerning separation rates, we prefer a specification such as equation (7) that includes time dummies. This allows us to minimise the risk of bias due to the fact that missing values could be correlated with the business cycle. In order to take into account the fact that our family variable does not vary over time, the standard errors are clustered at the firm level.
than non-family firms do under the same circumstances. We do so by looking at the sensitivity of establishment-level dismissals to establishment-level job creation and destruction and testing whether this sensitivity differs between family and non-family firms. However, other establishment-level characteristics are likely to affect this sensitivity (notably establishment age) and we need to control for them in our estimates. Therefore we estimate the following model:
jt j t jt j jt j jt JCR JDR D DR =α1 +α2 + +µ +ε (8)
where DRjt is the dismissal rate, JCRjt (resp. JDRjt) is the job creation (resp. destruction) rate and µj is an establishment fixed effect, which allows us to take into account that dismissal rates are persistently different across establishments. The coefficients of JCRjt (resp. JDRjt) are assumed to vary across
different establishments according to the following model:
2 2 2 2 1 1 1 1 β + γ + α = α β + γ + α = α j j j j j j X F X F (9)
Plugging equation (9) into equation (10) yields the final regression that we estimate:
DRjt =α1JCRjt +α2JDRjt +γ1FjJCRjt +γ2FjJDRjt + XjJCRjtβ1+XjJDRjtβ2 +Dt +µj +εjt (10) A negative coefficient on the JDRjtFj interaction term would suggest that family firms rely less on dismissals when they downsize. However, when firms are hit by a negative shock and have to downsize, the frontier between dismissals and quits may be somewhat blurred, insofar as firms may put pressure on workers so that they quit, either directly or by cutting their wage and worsening their working conditions. As a consequence, we also want to check that the estimated pattern for dismissals is not compensated by an opposite one for quits. We therefore re-estimate the same model of equation (10) using alternatively total separations, quits and hirings as dependent variable and check whether, when family firms are hit by a bad shock and downsize, they rely less on separations than non-family firms and make the necessary adjustment by compressing hirings.
Finally, another key aspect of job security as part of a compensation package is whether workers in family firms effectively feel that they have a smaller risk of losing their job. Therefore, we estimate the relationship between family ownership and the risk of dismissal perceived by workers in 2004. The basic specification is equivalent to equation (2):
ij j i j ij F X X RD =γ + α+ β+ε (11)
2. The data
The data we use come from several databases as it is necessary to combine information on wages, firm ownership, worker flows, employees' characteristics, as well as a wide array of firms' and/or establishments' characteristics.
The first data source that we use is a linked employer-employee dataset for France: the REPONSE 2004 survey (RElations PrOfessionnelles et NégocationS d’Entreprise) which was conducted in 1992, 1998 and 2004. To our knowledge, it is one of the very few databases that include information both on ownership status of listed and non-listed companies and on workers' characteristics. In 2004, a representative sample of 2,930 establishments with at least 20 employees were surveyed. Questions about firm ownership, the use of information and communication technologies (ICT) and innovative managerial practices, as well as establishment and workforce characteristics were asked to one senior manager per firm. After cleaning out establishments with average hourly wages above 100€9 as well as charities, associations and governmental organisations operating in the business sector, which are likely to have very specific wage policies, we end up with 2,650 establishments.10
Regarding firm ownership, the manager is asked: "What is the type of the main category of shareholder of the firm?" According to the answer, we group firms into two main categories: those with family ownership (the main shareholder is a family or an individual) and those with non-family ownership (i.e. for which ownership is either dispersed or private equity or which are joint-ventures). We define a family variable which takes value 1 if the firm is owned by a family or an individual and 0 otherwise. However, some firms do not belong to any of the above two categories: they are either worker-owned or State-owned or they belong to other types of shareholders11. We define three dummy variables corresponding to these types of ownership and we control for them in our regressions. With this definition of ownership, the proportion of establishments belonging to a family firm in our sample is 56.1% (see Appendix Table A1) – and family firms account for 58% of the total number of firms. Dispersed ownership, private equity and joint ventures represent only 30.1% of the establishments. The remaining 14% of the establishments are either worker-owned (3.2%), State-owned (2.7%) or have other shareholders (7.8%). This proportion of family firms is very close to what is found for France in the literature. Bloom and Van Reenen (2007) define family firms as firms whose largest shareholder is either the founder or family members who are second generation or beyond. On a sample of listed and non-listed companies, they find a proportion of family firms in France very close to ours (56%), out of which 26% are founder-owned and 30% are owned by second generation (or beyond) family members. Similarly, on a very large sample of French listed and non listed companies, Bloch and Kremp (2001) also observe that 56% of the firms are family
9
Wage data comes from social security records (see below in the text).
10
Belonging to 2,231 different companies.
11
controlled. Sraer and Thesmar (2007) use a slightly different definition of family firms: a firm is family-owned if the family or a member has more than 20% of the voting rights. Given that they only consider French listed companies whereas our survey contains both listed and non-listed firms, the intersection between our and their dataset is obviously small. Nonetheless 65 firms are common to both datasets and for 54 of those firms (i.e. 82%), the answer about ownership is identical in both datasets.
The manager survey in REPONSE also provides information on the use of information and communication technologies (ICT) and innovative managerial practices. Managers are asked what proportion of the employees use computers, the Internet or the Intranet. For each of these new technologies, the answer is coded from 0 to 4 with 0 corresponding to "nobody", 1 to "less than 5%", 2 to "5-19%", 3 to "20 to 49%" and 4 to "50% and more". Our ICT variable is defined as the sum of the answers over the three types of technologies. It thus captures the intensity of use of ICT at the establishment level and varies between 0 and 12. We standardise it to 0 mean and 1 standard deviation. As regards innovative managerial practices, we build a summary index along the lines suggested by Bloom and Van Reenen (2007). In the REPONSE survey we have information on the proportion of workers involved in performance dialogue (expression groups, shopfloor meetings, quality circles), the number of devices designed to stimulate workers' participation (firm project, seminars, firm newspaper, open day, suggestion box, satisfaction survey), whether workers are autonomous in handling tasks and whether their work is defined in terms of goal to reach rather than in terms of precise actions. Managers are also asked the number of areas in which quantitative targets exist (financial return, budget, cost, quality, growth, security), whether there exist a training scheme, individual or collective premiums or stock options (both for managers and non-managers), individual appraisals and whether employees' assessment has any impact on wages or promotions. We build one variable out of the answer given for each item – see the Data Appendix for more details. Our summary index is then defined as the weighted sum of each of these variables so that they equally contribute to the overall index12. One interesting point is that family firms appear to be much less innovative than non-family ones both in terms of ICT use (the ICT index is -0.21 for family firms as compared to 0.24 for non family ones) and in terms of managerial practices (the index is respectively -0.25 and 0.33 for family and non-family firms).
Finally, the REPONSE manager dataset provides information on establishment size, age and the presence of a union representative in the establishment. The REPONSE survey has also been matched with social security records (the Déclarations Annuelles des Données Sociales, DADS)13 so that, at the establishment level, we have information on the average net hourly wage14 as well as the structure of the workforce (by age, gender and occupations), including workers on fixed-term contracts but excluding workers provided
12
Here again, we standardise the index to 0 mean and 1 standard deviation.
13
The match has been done by the DARES (Direction de l'animation de la recherche et des études statistiques), namely the statistical office of the Ministry of Labour, before they gave us access to the data.
14
by temporary help service (THS) firms. As can be seen from Appendix Table A1, family firms are, on average smaller than non-family ones. Their establishments are a little bit older and the proportion of workers in highly skilled occupations (managers and supervisors and technicians) is much lower than in non-family businesses.
In our sample, family firms have also more workers on fixed-term contract (5.3% against 3.4% in non-family ones).15 Moreover, the proportion of establishments with a union representative is much lower in family firms (24.3%) than in non family ones (52.2%). Finally, the average net hourly wage is 11.2€ in the whole sample; it is lower in family (10.1€) than in non-family firms (12.6€).
The establishment-level variables described so far are used as controls in both our individual-level and establishment-level wage regressions (see eqs (2) and (3) above).
Information about individual workers is also provided by the REPONSE survey. In 2004, for each establishment, 4 workers were interviewed, on average. They were randomly drawn out of the group of workers with more than 15 months of tenure. After cleaning out CEOs and workers with extreme ages and wages16, the worker database contains 6,945 employees from 2,412 establishments. They have been asked questions about their individual characteristics (age, education, tenure, gender, whether they work part-time or full-time) as well as the risk they perceive of loosing their job in the next 12 months. Using this information, we build a variable capturing the perceived risk of dismissal which takes values 1 to 4 when the risk is perceived as being respectively "zero", "low", "high" and "very high". Thanks to the match with the DADS, for each worker who has been interviewed, we also have information on her wage, occupation, and hours worked. Such a design generates linked employer-employee information, which allows us to study individual compensation taking into account both firm and worker heterogeneity on observable characteristics. As evidenced in Appendix Table A2, we have 37.3% of women in our sample and this proportion is slightly larger in family firms. The proportion of highly educated workers (with some college degree and above) is lower in family firms (23.6 %) than in non family ones (34 %), while the proportion of workers in low-skilled occupations is higher: 62.7 % of the family-firm workers are blue-collars and clerks as compared to only 44.1 % in non-family firms. The share of full-timers is lower in family firms and, on average, workers are slightly younger and have lower tenure. As was the case for average wages at the establishment level, individual wages appear to be lower in family firms than in non-family ones, just like the perceived risk of dismissal.
The REPONSE survey has a panel subsample which provides information on establishments in 1998 and 2004 by means of the manager questionnaire. It contains 622 establishments belonging to 596 firms for
15
This suggests that firms in our sample have a smaller share of temporary workers than the French average (which in 2004 was about 10% for workers on fixed-term contracts, excluding THS workers, see OECD, 2008).
16
We exclude from the sample employees with wages in the top and bottom 1% of the distribution as well as employees aged less than 20 years and more than 60 years.
which we have data on ownership at both dates. We use it to control for heterogeneity on unobservable establishment characteristics. Table A3 presents firm-level descriptive statistics for 1998:17 58.9% of firms are family-owned while dispersed ownership, private equity and joint ventures represent 30.2% of the firms. These figures are very similar to those obtained for 2004 (see Appendix Table A1). Changes in family ownership are captured through a variable defined as family ownership in 2004 minus family ownership in 1998. This variable may thus take values 0 (no change in ownership), +1 (family-owned in 2004 while it was not in 1998) and -1 (family-owned in 1998 while not anymore in 2004). On average, it is equal to -0.001 in our sample. By contrast, the proportion of firms changing ownership whatever the direction is much higher: 20.1% over the period.
The REPONSE panel does not contain information on establishment-level wages in 1998. We use the DIANE dataset to overcome this problem. DIANE is a database which contains publicly-available company accounts18 and has information on the annual wage bill per employee at the firm level (which we use as a proxy of gross annual wages) as well as firm-level labour productivity (defined as valued added per worker), firm size and age in 1998 and 2004. Appendix Table A3 provides statistics for these variables in 1998. Using various years of DIANE as well as other sources (such as the Internet, the press, etc.), we construct a variable indicating whether the firm is listed or not at the end of the period. As shown in Table A1, only 1.9% of the firms in our sample are listed on the stock market in 2004.
The last source that we use is the DMMO/ EMMO database. The DMMO (Données sur les Mouvements de Main-d’Oeuvre) has exhaustive data on gross worker flows (hirings and separations, excluding THS workers) for establishments with 50 employees or more for each quarter. The data is broken down by type of flow. The EMMO (Enquête sur les Mouvements de Main-d’Oeuvre) has identical information on a representative sample of establishments with less than 50 employees. We match the DMMO and EMMO datasets with REPONSE 2004. The match of the two datasets is rather good: after doing it, we obtain 2298 matched establishments, of which 2199 report information on ownership. We use the DMMO-EMMO data to compute indicators of job security and, more specifically, of hiring and separation rates at the establishment level. In order to do that, we drop all movements corresponding to job spells shorter than one month. These indeed correspond to very short trial periods or temporary contracts which have little to do with job security for core workers19. We also exclude movements due to transfers between two establishments of the same firm. Our data allows us to build hiring and separation rates for each quarter
17
We provide descriptive statistics at the firm rather than establishment level because the information from the REPONSE panel is used at the firm level in the next section. The reason is that we have wage information only at the firm (rather than the establishment) level in 1998.
18
It is provided by Bureau van Dijk, a private consulting company, and it is the French source file for the more famous Amadeus database.
19
over 2000-2007.20 As standard in the gross worker flow literature (Davis et al, 2006), the hiring rate is defined as the ratio of all hires during a given quarter to the average employment level of that quarter21 and the separation rates as the sum of all types of separations22 divided by average employment. In order to go deeper into the types of separations, we define dismissal rates, quit rates, retirement rates, rates of end of trial periods and rates of end of fixed-term contracts as the ratio of the corresponding type of movement during the quarter to the average employment of the quarter. Following the gross job flow literature (Davis et al., 1997), we also define the job creation rate as the net growth rate of employment in the establishment between the beginning and the end of the quarter when it is positive23. Symmetrically, the job destruction rate is the absolute value of the net growth rate of employment when it is negative24. Appendix Table A4 presents descriptive statistics of worker and job flows.
Each quarter, the establishments in our sample hire about 5.6% of their workers for more than one month and separate from about 5.2% of them. This results in a 0.4% employment growth per quarter due to a 2.7% job creation rate and a 2.3% job destruction rate. However, establishments of family firms appear to have grown at a more rapid pace in the period of observation than their non-family counterparts (with 2.9% job creation and 2% job destruction rates, against 2.2% and 2.9%, respectively). This difference is reflected in much greater hiring by family firms (6.2% of their workforce is hired in each quarter, compared to 4.8% for non-family firms) and slightly lower separations (5.3% in family firms against 5.5% in non-family firms). Each quarter, family firms dismiss fewer workers (0.5% on average, compared to 0.65% in non-family firms) and have lower separations due to retirement or end of trial period (0.1% and 0.2%, respectively, against 0.2% and 0.3% in non-family firms), but more workers quit voluntarily (1.6% compared to 1.4% in non family firms) or separate at the end of a fixed-term contract (2.4%, compared to 2% in non family firms).
20
Potentially we have information for 32 quarters for each establishment. However, there are several missing values and we have complete information for only 523 establishments. The average number of quarters with non-missing data per establishment is 23.7. We have non-missing data in at least half of the quarters in 1848 establishments, while we have less than one fourth of the quarters for 178 establishments.
21
The average employment level of the quarter is defined as half of the sum of the employment levels at the beginning and the end of the quarter (see e.g. Davis et al., 2006).
22
In the original data, separations are classified as due to dismissals, quits, retirement and early retirement, end of trial periods, end of fixed-term contracts or other temporary contracts, military service, injuries, death or separations for unknown reason.
23
Job creation rate: JCR =max(0,∆E/Ệ) where E is the level of employment in the establishment, and Ệ is its average.
24
3. Results
3.1 Wages in family firms
3.1.a Family firms pay lower wages
Average hourly wages, measured at the establishment level, are lower in family than in non-family firms (see Table 1. Panel A). The simple bivariate correlation between family ownership and wages – see column (1) – indicates that wages are 23.8% lower in family firms than in non family ones. Not surprisingly, the family wage penalty is smaller when we include 2-digit industry dummies and other establishment controls – establishment size and age, presence of a union representative, being listed or not, 10 regional dummies and ownership by workers, government or other shareholders25. The point estimate is further reduced when controlling for 4-digit industry dummies and workforce characteristics (i.e. occupational structure, proportion of women and proportion of workers below 40 years). When including all controls, the wage gap between family and non-family firms amounts to about 2.8%. In all cases, it is significant at the 1% level. The fact that family firms still come out as paying lower wages when controlling for 4-digit industry dummies, the occupational structure and the presence of union representatives suggests that the wage gap is not due to the fact that family businesses are overrepresented in specific industries, employ a larger share of unskilled workers and are less unionised – see Sraer and Thesmar (2007), Mueller and Philippon (2010) and Appendix Table A1.
Individual wage equations yield the same result with wages being lower in family firms (see Table 1, Panel B). In this specification, we control for establishment characteristics, 2 or 4-digit industry dummies and for workers' individual characteristics (10 age classes, 4 job-tenure classes, gender, 8 educational-attainment classes and a dummy for part-time work). When including all controls, the estimated wage gap is 4.1%. It is higher than when using establishment-level data because in this specification we control for workers' education rather than occupations. The reason why we do this is that occupations are likely to be much more endogenous to firms' human resource management practices than education. The latter is indeed measured at the end of schooling (i.e. at the beginning of the career) whereas the former is the outcome of the career workers have made so far. As a matter of fact, the probability of being employed in higher occupations (i.e. as a manager or technician or supervisor) is lower in family firms, even after controlling for workers' and establishments' characteristics, including 4-digit industry dummies: we estimate the marginal probability of being in an higher occupation to be 5.8% lower in family firms, with standard error equal to 2.3%.26 This suggests that family businesses offer fewer career prospects conditional on the observable characteristics of workers. One consequence of this is that controlling for occupations rather than education in our wage equations is not neutral. We do not have information on the
25
All results in the paper are robust to excluding these firms from the sample.
26
average educational level of the workforce at the establishment level. This is why we use the occupational structure as a control in Table 1 – Panel A. As a robustness check, Appendix Table A5 reports the results of the individual wage regression including occupational rather than educational controls.
The wage gap between family and non-family firms could be due to the fact that family firms are less innovative – and hence less productive – than non-family ones. Evidence of such difference in innovativeness is provided by Bloom and Van Reenen (2007). We find similar evidence in our data (see Table 2). When workforce characteristics, 4-digit industry dummies and other establishment controls are included in the specification, family-owned establishments have on average lower indicators of ICT use and innovative managerial practices than establishments whose ownership is mainly widely held, private equity or joint ventures. As a consequence family firms are less productive, and the productivity gap becomes insignificant when we control for ICT and management practices – see Appendix Table A6 – col (4).27 When controlling for ICT use and managerial practices in the establishment-level wage regression, the coefficient on family firms decreases only slightly (see Table 3, Panel A): the wage gap between family and non family firms is still 2.6% (as compared to 2.8% when technology and managerial practices are not controlled for). The result we obtain at the individual level is very similar (see Table 3, Panel B) with a 2.9% wage gap.28 Column 2 of Table 3 shows that the same holds when controlling for firm-level labour productivity: the wage gap at the establishment (resp. individual) level is 2.2% (resp 2.7%). So, the family wage gap we observe both at establishment and individual level is not entirely due to the fact that family firms are less productive: the largest part of the gap remains unexplained after controlling for this variable. The same holds for ICT and innovative managerial practices: their introduction does not wipe out the negative correlation between family ownership and wages.
3.1.b Selection issues
Our results could be driven by heterogeneity across firms on unobservable characteristics. Table 4 uses the REPONSE panel to overcome this problem. However, let us underline that, as mentioned in the data section, for the year 1998 we only have firm (and not establishment) level pay. Moreover our proxy for pay is the gross annual wage – defined at the firm level – instead of the net hourly wage which we have used in the wage regressions so far. So, we first compute the firm-level average gross annual wage29 for 2004 in order to get a consistent measure of the variation of this variable in the panel. We then estimate
27
The fact that ICT and managerial practices are important determinants of firm productivity is well established in the literature (see for example, Black and Lynch, 2001).
28
Note that the main effect of the inclusion of ICT use and management practices in the family wage equation is that there is almost no difference in the family wage penalty between using occupations and using educational attainment as controls - see Table A5 – col (4) and Table 3, Panel B – col (1). This suggests that, despite the fact that occupations are more endogenous than education, controlling for one or the other variable does not make much of a difference in our analysis.
29
As mentioned in section 2, this is defined as the ratio of the gross annual wage bill at the firm level to the number of employees.
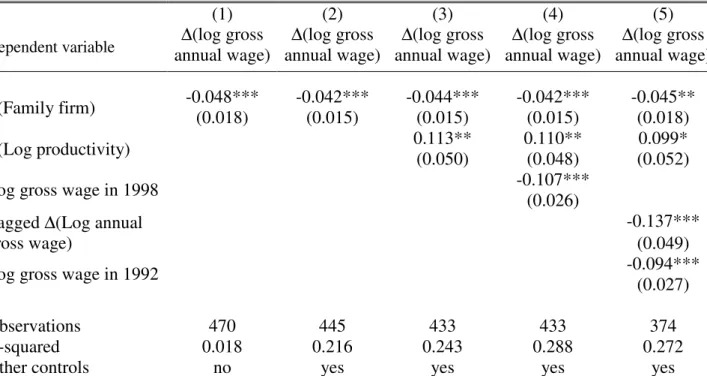
first-difference equations in which we regress changes in the average gross annual wage at the firm level between 1998 and 2004 on the change in ownership over the period (namely family ownership in 2004 minus family ownership in 1998). We include time-varying controls such as: change in firm size, change in the share of women, change in the occupational structure, change in the presence of union representative, change in log labour productivity30 and other changes in ownership31. Our results show that when family firms change to non-family ownership (i.e. ∆Family is negative), their wages grow and this pay increase is significant at the 1% level. This suggests that the estimated family wage gap we observe in Tables 1 and 3 is not entirely due to unobserved firm heterogeneity.
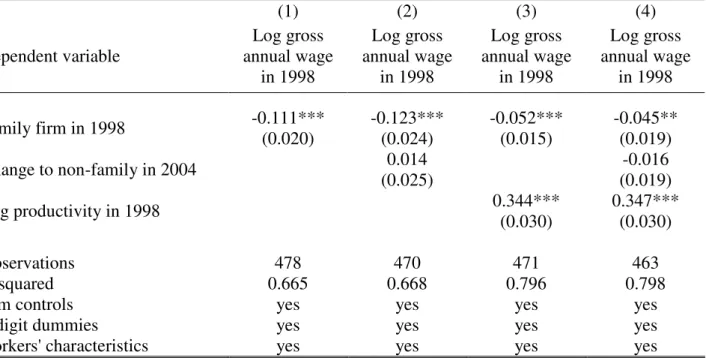
Our result, nevertheless, could also arise if firms changing ownership status from family to non-family were already paying higher wages. To take this possibility into account, we also include a control for the log of the average gross annual wage in 1998 in our first-difference regressions – see column (4) of Table 4. The estimate of the family wage gap is not affected, which suggests that this potential problem is not biasing our estimates. However, in panels with a short time dimension, the estimate of the coefficient of a lagged dependent variable in levels is likely to be biased (e.g. Nickell, 1981). For this reason, in Table 5 we also check directly whether firms which switched from family to non-family ownership between 1998 and 2004 had larger wages in 1998. The number of firms in the panel being quite small (about 500) we only control for 2-digit industry dummies on top of 1998 establishments' and workers' characteristics – see Appendix Table A3. The first column shows that in 1998, like in 2004, the correlation between family ownership and wages at the firm level is negative and significant (with an estimated gap in annual gross wages as large as 11.1%). The same holds when controlling for firm-level productivity (see col (3)): the gross wage appears to be 5.2% lower, on average, in family firms. These point estimates are not directly comparable to those in Tables 1 and 3 (concerning 2004 net hourly wages) because our variable here is the gross annual wage.32 The key result in Table 5 is that switching from family to non-family ownership over the period is not significantly correlated to the level of wages before the change in the main shareholder: the "change to non-family" variable is never significant whether or not we control for productivity (resp. cols (2) and (4)). In other words, firms which became non family between 1998 and 2004 did not have higher wages before changing ownership.
30
Given that results in Table 3 suggest that, as far as the estimation of the family wage gap is concerned, controlling for the log productivity or for ICT use and management practices essentially captures the same economic phenomenon, we prefer to use log productivity since we can consistently measure it at the firm level.
31
Other changes in ownership include becoming worker-owned (or government-owned or owned by another type of shareholder) between 1998 and 2004 or stopping being owned by this type of shareholder over the period.
32
Re-running our estimates for the average gross annual wage in 2004 with 2-digit dummies, we find that the correlation between family ownership and wages is smaller in 2004 as compared to 1998 (-6.9% as compared to -11.1%) - Appendix Table A7 – col (1). However, this difference is essentially due to greater heterogeneity in productivity levels in 1998 than in 2004: when controlling for productivity, both coefficients become much closer: -4.8% in 2004 as compared to -5.2% in 1998 - see Appendix Table A7 – col (2) and Table 5 – col (3).
One could still argue, however, that family firms that are going to be sold out and become widely-held are already on an upward wage-growth trend (selection on trends rather than on levels). We deal with this problem in two ways. First, we estimate a specification including the lagged change in log wages (between 1992 and 1998) in the last column of Table 4. Reassuringly, including this term does not change the estimate of the parameter of interest. Second, in an unreported regression, we look at the correlation between the lagged change in log wages (1992-1998) and subsequent changes in ownership from family to non-family (1998-2004). If family firms that were about to be sold out and become widely-held were already on an upward wage-growth trend, one would expect a positive correlation between these two variables. The correlation is instead negative, albeit not significant at conventional levels (the point estimate is 0.172 with standard error 0.123).
Finally, given that family firms tend to be less productive, another type of selectivity bias could arise if the family firms paying high wages were eventually driven out of the market. In that case, the negative correlation we observe between family ownership and wages would result from the fact that family firms only survive if they succeed in keeping labour costs as low as possible. If such a dynamic effect is at play, it is presumably stronger in more competitive environments where firm turnover33 is greater. Results in Table 6 show that this is not the case. We split the sample between establishments located in industries with firm turnover above and below the median of all industries. Using average net hourly wages at the establishment level – Panel A –, the estimated relationship between family ownership and wages is negative in both cases but the point estimate is weak and insignificant in high-turnover industries whereas it is larger and more significant in less competitive industries. This result suggests that selection due to the potentially greater death hazards of high-paying family firms is not likely to be driving our results. An even clearer picture emerges when using individual wage data – see Table 6 – Panel B: the relationship between family ownership and wages is weak and insignificant in high-turnover industries, whereas it is stronger and significant, at conventional levels, in low-turnover industries.
Another possible problem is the selection of workers on unobservable characteristics. Individual unobserved characteristics are important determinants of individual wages. Indeed, Abowd et al. (1999b) find, on the basis of French matched employer-employee longitudinal data, that individuals with unobserved, time-invariant high-wage characteristics – not accounted for by gender, education, experience and job tenure – tend to sort into firms when they are hit by a good productivity shock. However, in the same paper, Abowd et al. also show that other types of shocks (such as profit shocks) do not induce any sorting process. Moreover, in their data, the unobserved, time-invariant individual and firm components of wages are almost uncorrelated. Overall this suggests that, at least in our panel
33
Firm turnover is defined as the sum of the employment weighted rates of entry and exit of firms in each industry in 1996. Rates are computed by dividing this sum by total industry employment, using the OECD Firm-level Database, which provides information on entry and exit at the 2-digit industry level. The median industry is rubber and plastic manufacturing with firm turnover as high as 7%.
regressions of Table 4, when we control for changes in firm-level productivity, firm fixed-effects and observable changes in workforce characteristics, the remaining worker heterogeneity should not bias our estimate of the effect of family ownership, a firm level variable, on log wages.
Overall, the fact that family firms do pay lower wages is robust to a variety of controls and, in particular, it does not appear to be due to selection effects.
3.1.c Heterogeneity in the family wage gap across workers
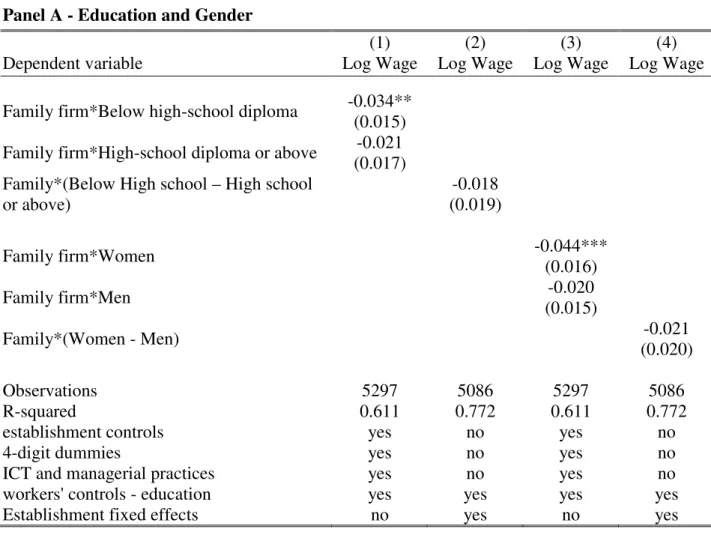
Following the agency and managerial entrenchment theories, the family wage penalty should be larger for managers than for workers in lower skilled occupations. More generally, this suggests that the family/non-family wage gap may be different across categories of workers. In this section, we consider potential heterogeneity across workers along four dimensions: education, gender, age and occupation and we show that the family wage penalty is homogenous across workers in most but not all dimensions. In Table 7 – Panel A, we consider potential heterogeneity across education and gender. In order to do that, we interact family ownership with both dimensions. Columns (1) and (3) include a full set of establishment and worker controls, together with 4-digit industry dummies and controls for ICT use and innovative managerial practices. In columns (2) and (4) we re-estimate the model with establishment fixed-effects in order to better control for unobserved heterogeneity across plants. Results in column (1) suggest that low-education workers earn less in family firms than in non-family ones, while it is not the case for highly educated workers34. However, the difference between the estimates for both groups is not significant (-1.3% with standard error 1.8%). In order to better control for establishment unobserved heterogeneity, we run a fixed effect estimate - see column (2). This confirms that the high-low education wage gap is not significantly higher in family firms as compared to non family ones35. Regarding gender, women (but not men) seem to earn less in family firms – col (3) – but, here again, the difference between the estimates for both groups is not significant at conventional levels (-2.4% with standard error 1.8%). This is robust to controlling for unobserved heterogeneity across establishments – col (4). So, our results suggest that the family wage gap is not significantly different across educational levels and gender. Low (resp. high) education workers and women (resp. men) are not particularly penalised in family firms.
34
The coefficient on the Family*Group-type variable gives the wage gap for workers in this group type between family and non family firms. For example, the coefficient on the Family*(High school diploma and above) variable gives the wage gap for highly educated workers between family and non family firms.
35
The coefficient on the Family*(Group A – Group B) variable gives the wage gap between group-A and group-B workers in family firms as compared to non-family ones. For example, the coefficient on the Family*(Below High school – High school or above) variable gives the wage gap between low and highly educated workers in family firms as compared to non-family ones.
Table 7 – Panel B is similar in structure to Panel A but focuses on the family wage gap across age groups. As a first step, we consider workers below and above 40 years old, which is the median age in our sample. The results in column (1) correspond to the specification without establishment fixed effects. Workers above 40 years old appear to earn less in family firms than in non family ones, whereas it is not significantly the case for younger workers. In this case, the difference across age classes is significant at conventional levels and it is robust to the introduction of establishment fixed effects – see col (2). We find in fact that senior workers earn significantly less with respect to younger ones in family firms as compared to non family ones.
A first explanation for this could be that job tenure is more rewarded in non-family than in family firms, insofar as senior workers have on average greater job tenure than younger ones. Column (3) of Panel B shows that the age-tenure correlation is unlikely to account for the wage penalty we find for senior workers in family firms: when controlling for the interaction between family ownership and tenure, we still find that wages grow substantially less as age increases in family firms with respect to non family ones.
Another reason for this difference in the wage age gap may be that family firms are less intensive in ICT and use fewer innovative managerial practices than non-family firms. There is evidence in the literature that ICT and innovative managerial practices are age-biased (see Aubert et al, 2006). If this is the case, it may generate two different mechanisms affecting senior workers' pay in family/non-family firms. First, there may be a direct wage effect: to the extent that senior workers are less efficient in innovative firms, they should be paid less (as compared to younger workers) in non-family businesses because the latter are on average more intensive in ICT and managerial practices. This does not quite fit with our results since we find that senior workers tend to earn more (rather than less) in relative terms in non-family firms. A second mechanism would involve a selection effect: if ICT-intensive firms shift their age structure towards younger workers, seniors are more strongly selected in those firms and they have on average better unobserved abilities. In this case, the predicted correlation would be that senior workers should earn more (with respect to younger workers) in non-family firms because the latter are more innovative and therefore select better senior workers. Results in column (4) of Table 7 – Panel B suggest that this is actually what occurs. When controlling for the interaction between family ownership on the one hand and ICT and innovative managerial practices on the other hand, we find that senior workers earn more as compared to younger ones in ICT-intensive firms, with managerial practices having no significant impact. Moreover, this effect wipes out the family/age wage gap: the point estimate on the family/age interaction goes down to virtually 0 and is not significant anymore.
One could wonder whether this pattern of results is robust to changes in the age threshold. What if we define younger workers as being aged less than 35 years or senior ones as being more than 45? Appendix
Table A8 shows that the results stay unchanged when moving the age limit to 35 years. In particular, the impact of controlling for ICT is the same as in the case of the 40-year threshold and, here again, the technological effect drives down to zero the family age gap. The same pattern is found when we increase the age threshold up to 45 years36. In contrast, estimates with establishment fixed effects are not significant anymore if we bring down the age limit at 30 years. Overall, these robustness checks suggest that the selection effect at work in ICT intensive firms starts at an early age, around 35 years, and is quite homogeneous above that limit. This is consistent with the findings of Aubert et al. (2006) who show that, in France, both the wage bill and employment shares of workers are positively correlated with establishment ICT intensity for workers aged from 30 to 39 years, whereas the opposite holds for older workers.
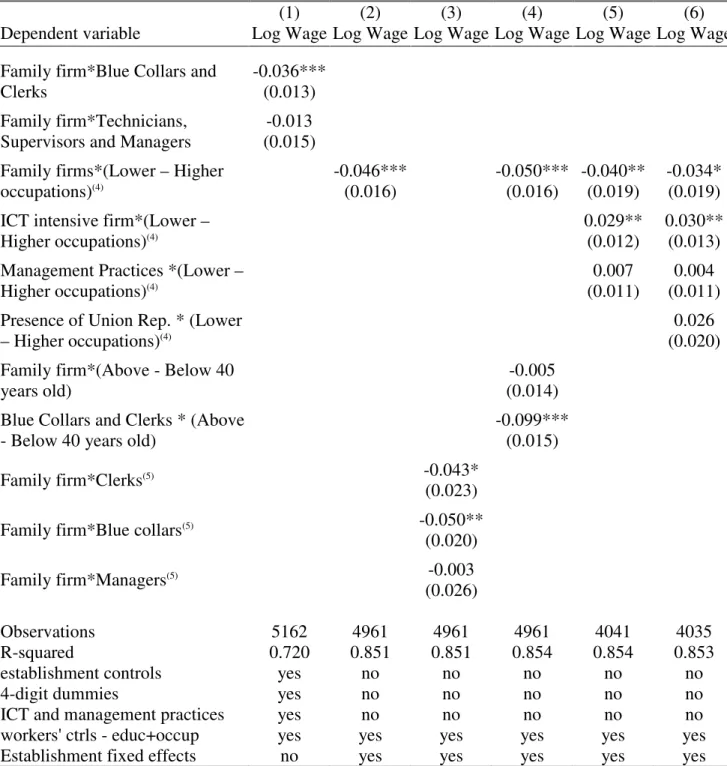
In Table 7 – Panel C, we investigate the potential heterogeneity of the family wage gap across occupations. Results in column (1) suggest that blue-collar workers and clerks earn less in family firms than in non-family ones. By contrast, we do not find any wage penalty for managers and technicians. This difference across occupations is significant at conventional levels and it is robust to including establishment fixed effects – col. (2): workers in lower occupations are paid less with respect to those in higher occupations when employed in family firms. As evidenced in column (3), this is the case both for blue-collars and for clerks, whose estimated coefficients are, moreover, not significantly different from one another. As regards managers, their coefficient do not differ more from that of technicians in family firms than in non-family ones. This is the reason why, in the remaining regressions, we group blue-collars and clerks together on the one hand and technicians, supervisors and managers together on the other hand. The family/non family wage gap for workers in lower occupations is robust to controlling for age. It could be the case that low-skilled workers are paid less in relative terms in family firms because they are on average older in these firms or because all workers are on average older in those firms. As evidenced in col (4), the family/low-occupation effect does not pick up this kind of effect. Workers in lower occupations are indeed more penalised when they are senior – the interaction between blue-collars and clerks and being above 40 years old is negative and significant – but this does not account for the fact that they are paid less with respect to workers in higher occupations in family firms. The point estimate on the family/low occupation interaction is even slightly higher when controlling for age and it remains significant at the 1% level. It is somewhat reduced when including interactions with ICT and managerial practices in order to take into account the fact that workers in lower occupations could be paid less in family firms because they are less innovative – see column (5). We do find such an effect - lower skilled workers tend to be paid more in ICT intensive firms – which suggests that the same selection effect is at work as with age. However, contrary to what we found for the family age wage gap, the introduction of ICT does not wipe out differences in the family wage gap across occupations: the interaction term
36