HAL Id: cea-02442337
https://hal-cea.archives-ouvertes.fr/cea-02442337
Submitted on 16 Jan 2020HAL is a multi-disciplinary open access
archive for the deposit and dissemination of sci-entific research documents, whether they are pub-lished or not. The documents may come from teaching and research institutions in France or abroad, or from public or private research centers.
L’archive ouverte pluridisciplinaire HAL, est destinée au dépôt et à la diffusion de documents scientifiques de niveau recherche, publiés ou non, émanant des établissements d’enseignement et de recherche français ou étrangers, des laboratoires publics ou privés.
Mechanical behavior at high temperature of highly
oxygen- or hydrogen-enriched α and (prior-) β phases of
zirconium alloys
I. Turque, R. Chosson, M. Le Saux, J.-C. Brachet, V. Vandenberghe, J.
Crepin, Af, Gourgues-Lorenzon
To cite this version:
I. Turque, R. Chosson, M. Le Saux, J.-C. Brachet, V. Vandenberghe, et al.. Mechanical behavior at high temperature of highly oxygen- or hydrogen-enriched α and (prior-) β phases of zirconium alloys. 18th International Symposium on Zirconium in the Nuclear Industry, May 2016, Hilton Head, United States. �cea-02442337�
1
I. Turque1,2, R. Chosson1,2,3, M. Le Saux1, J.C. Brachet1, V. Vandenberghe1,4, J. Crépin2, and A.F. Gourgues-Lorenzon2
Mechanical behavior at high temperature of highly oxygen- or hydrogen-enriched α and (prior-) β phases of zirconium alloys
ABSTRACT: During a hypothetical loss-of-coolant accident (LOCA), zirconium alloy fuel
claddings can be loaded by internal pressure and exposed to steam at high temperature (HT, potentially up to 1200°C) until they are cooled and water quenched. A significant fraction of the oxygen reacting with the cladding during oxidation at HT diffuses beneath the oxide through the metallic substrate. This diffusion of oxygen induces a progressive transformation of the metallic
βZr phase layer into an intermediate layer of αZr(O) phase containing up to 7 wt.% of oxygen.
Furthermore, in some specific conditions, the cladding may rapidly absorb a significant amount of hydrogen during steam exposition at high temperature. Then, hydrogen, as a βZr-stabilizer,
would mainly diffuse and concentrate up to several thousands of wt.ppm into the inner βZr phase
layer.
It is known that oxygen and hydrogen modify the metallurgical and mechanical properties of zirconium alloys but data are scarce for high contents, especially at HT. However, such data are important basic components to improve the assessment of the oxidized cladding mechanical behavior and integrity during and after LOCA-like thermal-mechanical transients. This study intends to provide new and more comprehensive data on the mechanical behavior at HT of the
αZr(O) and the (prior-) βZr phases containing high contents of oxygen and hydrogen, respectively.
In this paper, the results of mechanical tests performed on model samples, produced from M5®5
and Zircaloy-4 cladding tubes, homogeneously charged in oxygen (up to about 6 wt.%) or hydrogen (up to about 3000 wt.ppm) respectively, are described. The tests were performed at various temperatures under vacuum between 800 and 1100°C for the oxygen-enriched αZr phase
and in air between 700 and 20°C, after cooling from the βZr temperature domain, for the
hydrogen-enriched (prior-) βZr phase. The αZr phase is substantially strengthened and embrittled
by oxygen. Power-law and nearly linear creep regimes are observed for stress levels beyond and below 15 MPa respectively. As confirmed by observation of fracture surfaces, the model αZr(O)
material experiences a ductile-to-brittle transition at 1000-1100°C for oxygen contents between 3.4 and 4.3 wt.%. A model is developed to describe the viscoplastic behavior of the αZr(O) phase
and used to evaluate the contribution of the αZr(O) phase layer to the creep behavior of an
oxidized fuel cladding tube submitted to internal pressure at HT. Below 500°C, the model (prior-) βZr phase appears to be embrittled by hydrogen contents of 2000-3000 wt.ppm, so that it
becomes macroscopically brittle at 135°C and below, and at 350-400°C, for average hydrogen contents of about 2000 wt.ppm and 3000 wt.ppm, respectively. The effect of thousands wt.ppm of hydrogen on ductility decreases with increasing temperature and vanishes beyond 500°C. When the behavior is macroscopically ductile, the (prior-) βZr phase containing between about
1 CEA, DEN, DMN, Section for Applied Metallurgy Research, 91191 Gif-sur-Yvette Cedex, France, e-mail:
matthieu.lesaux@cea.fr (corresponding author)
2 MINES ParisTech, PSL Research University, Centre des matériaux, CNRS UMR 7633, BP 87, 91003 Evry,
France
3 AREVA NP, 69456 Lyon Cedex 06, France
4 Now at CEA, DEN, DM2S, Section of Mechanical and Thermal Studies, 91191 Gif-sur-Yvette Cedex, France 5 M5 is a trademark of AREVA NP registered in the USA and in other countries
2 1700 and 3200 wt.ppm of hydrogen has a higher flow stress than the material without hydrogen at 500°C and a lower one at 700°C, respectively. Young’s modulus and plastic isotropy of the (prior-) βZr phase are not significantly modified by the presence of high hydrogen contents.
Keywords: Zircaloy-4, M5®, oxygen, hydrogen, LOCA, mechanical behavior, high temperature
Introduction
During a loss of coolant accident (LOCA) hypothetical scenario in a light water reactor (LWR), fuel claddings made of zirconium alloys are loaded by internal pressure and exposed to steam at high temperature (HT, up to 1200°C) before they are cooled and water quenched. Oxygen diffuses via anionic vacancies in the non-stoichiometric zirconia. At HT, a significant fraction of the oxygen that reacts at the metal/oxide interface diffuses through the metallic substrate via interstitial sites (oxygen diffusion into the metal is negligible at nominal operating temperatures,
i.e. below 400°C). When the solubility limit of oxygen in the βZr phase is reached, a metallic layer of oxygen-stabilized αZr phase, called αZr(O), grows between the oxide layer and the βZr
phase layer [1][2][3]. There is a strong gradient of oxygen concentration through the αZr(O)
phase layer: the oxygen content is about 7 wt.% at the interface with the oxide layer and 2 wt.% at the interface boundary with βZr. For as-received materials and oxidation temperatures lower
than or equal to 1200°C, the oxygen solubility in the βZr phase is lower than 0.6 wt.%. During
cooling, the βZr phase layer transforms back into αZr and forms the so-called prior-βZr phase, with
a typical Widmanstätten or parallel-lath structure morphology [4].
The cladding submitted to internal pressure at high temperature may swell and burst at the beginning of the LOCA transient. The quenching at the end of the transient induces internal stresses, due to both differences between the thermal coefficients of the different phases/layers constituting the oxidized cladding material, phases transformations, and other possible
phenomena. These internal stresses, potentially associated with additional mechanical loadings, can result in a brittle failure of the cladding once it is heavily oxidized and hydrided. When analyzing the mechanical behaviour of the cladding at high temperature, and during and after quenching, both the effects of the oxygen and hydrogen should be taken into account.
On the one hand, the cladding mechanical response during a LOCA-like transient depends on its degree of oxidation. In particular, the αZr(O) phase layer formed at HT can have strengthening
and embrittling effects [3][5][6] and a good knowledge of the mechanical properties of this phase at HT is thus an important issue. However, most of the data reported in the literature were
obtained for oxygen contents lower than 2 wt.% [7][8][9][10][11][12][13] or did not concern the viscoplastic behavior at HT [7][14], so that there is no data about the creep behavior of the
αZr(O) phase for oxygen content higher than 2 wt.%. Aductile-to-brittle transition can be drawn
from the data reported in the literature as a function of the oxygen content but this transition is not known for HT and oxygen contents higher than 2 wt.%.
On the second hand, during in-service operation, a fraction of the released hydrogen due to corrosion by the water environment is absorbed by the cladding. The maximum end-of-life hydrogen content expected for high burn-up cladding is about 600 wt.ppm for Zircaloy-4 [15] and about 100 wt.ppm for M5® [16]. A significant hydrogen uptake can also occur in some specific conditions during steam exposition at high temperature. This can be for example the
3 case under high steam pressure (as expected during an intermediate break LOCA) for Zircaloy-4 and/or in post-breakaway oxidation conditions at temperatures typically lower than 1050°C. However, the hydrogen pick-up observed under high steam pressure remains limited for the typical duration of a LOCA [17][18]. Furthermore, breakaway oxidation does not occur for oxidation times lower than at least one hour for modern nuclear fuel cladding alloys such as low-tin Zircaloy-4 and M5® [19][20][21][22], while the cladding is not expected to be exposed to steam at HT during more than a quarter of an hour during a LOCA.
“Semi-integral” LOCA tests have been performed on single unirradiated or irradiated fuel rods [23][24][25] or on a bundle of rods [26] to simulate the whole LOCA transient: heating, ballooning and burst, high temperature oxidation, cooling and final water quenching with or without additional mechanical loading. These tests have shown that a fast and substantial secondary hydriding can occur during HT steam exposure following the ballooning and burst sequence: local hydrogen concentrations up to 3000-4000 wt.ppm were measured in the vicinity of burst opening after only a few tens of seconds under steam at HT. In that case, secondary hydriding results from the oxidation of the cladding inner surface after steam has penetrated through the burst opening into the gap between the fuel pellets and the inner cladding surface. Then, local hydrogen uptake is induced by the resultant increase in hydrogen partial pressure inside the gap between the cladding and the pellets when moving away from the burst opening, due to steam starved conditions [27][28]. The resultant hydrogen distribution within the cladding tube is heterogeneous, axially as well as azimuthally [29]. Due to its thermodynamic affinity to the βZr phase, hydrogen diffuses and mainly concentrates into the inner βZr phase layer
[3][30][31]. It is well-established that the mechanical behavior of the cladding during and after quenching strongly depends on the properties of the (prior-) βZr phase layer.
Depending on the characteristics of the transient, failure during or after quenching can occur at the burst location, where the cladding is the thinnest and its oxidation level is the highest, or at a few centimeters away from the burst location, where the cladding is thicker and less oxidized but most heavily hydrided [26][32]. This illustrates the embrittlement effect of hydrogen. Several studies addressed the effect of hydrogen on the resistance to quenching [25] and the post-quench mechanical properties [3][24][33][34] of zirconium alloys fuel claddings oxidized at HT. It was shown that the effect of hydrogen results from an intrinsic embrittlement mechanism [3] but also from an increase, in the presence of hydrogen, of the solubility limit of oxygen in the βZr phase
[35][36][37], leading to an additional embrittlement due to higher oxygen content
[1][2][3][14][20]. However, most of these studies focused on hydrogen contents lower than 1000 wt.ppm as the main purpose was to investigate the effect of pre-transient in-service hydriding. To the authors’ knowledge, data on the mechanical behavior of zirconium alloys containing higher hydrogen contents and cooled from HT (two phases (αZr+ βZr) and βZr
domains) are very scarce and they are limited to room temperature [33][38], while an important effect of temperature is expected.
The first part of the present work deals with the creep behavior and the failure mode at HT (between 800 and 1100°C) of the αZr(O) phase containing more than 2 wt.% of oxygen. A part of
the results has already been presented elsewhere [39]. A model is developed on the basis of these data to describe the viscoplastic behavior of the αZr(O) phase. This model is then used with finite
4 cladding tube submitted to an internal pressure at HT. The second part of the study focusses on the mechanical behavior between 700 and 20°C, during cooling from the βZr phase domain, of
the (prior-) βZr phase and on the effect of high hydrogen contents. The effect of oxygen on the
properties of the (prior-) βZr phase is not directly addressed in this paper and will be published
elsewhere.
Mechanical behavior of highly oxygen-enriched αZr phase
Materials and experimental procedures
Sample preparation—In order to study the mechanical behavior of the αZr(O) phase, model oxygen-enriched αZr phase samples were elaborated from fully recrystallized M5® cladding
tubes from AREVA NP (nominal outer diameter and wall thickness of about 9.5 mm and 0.57 mm, respectively). The as-received chemical composition of the material is given in Table 1. The material initially contains 0.14 wt.% of oxygen and less than 5 wt.ppm of hydrogen. Oxygen charging was performed in several steps. First, the tube samples were oxidized in steam at 1100°C in the EDGAR facility [40] in order to introduce oxygen into the material, mainly under the form of outer zirconia and intermediate αZr(O) phase layers. Oxidation durations at 1100°C
depend on the targeted oxygen contents. They were evaluated by using oxidation kinetics established from results previously obtained at CEA [3][20][22][18][35]. The oxidized samples were then annealed under secondary vacuum for 3h at 1200°C in order to fully homogenize the oxygen concentration (by reduction of the oxide and diffusion of oxygen across the tube wall-thickness). Model αZr phase samples with about 2 (10), 3.2 (16), 4.3 (20) and 5.8 (26) wt.%
(at.%) oxygen contents were elaborated. Homogeneity and mean contents of oxygen were measured by Electron Probe Micro Analysis (EPMA, CAMECA SX100 microprobe) with typical accuracy of ±2500 wt.ppm. The obtained mean oxygen contents almost cover the typical range of oxygen contents observed in the αZr(O) phase of claddings oxidized at HT.
TABLE 1—Nominal chemical composition (in wt.%) of the studied materials.
Material Sn Fe Cr Nb O Zr
M5® - 0.04 - 1.0 0.14 Bal.
Zircaloy-4 1.3 0.2 0.1 - 0.13 Bal.
Mechanical testing—Materials with such high oxygen contents are brittle at low
temperature [14]. In order to avoid sample handling at room temperature and thus make it possible to carry out mechanical testing at HT, the 265 mm long oxidized specimens were mounted on an electrical-mechanical tensile machine with a radiation furnace operating under secondary vacuum [41][42] then annealed and homogenized in-situ into the facility, before decreasing the temperature (at a rate of a few °C/s) down to the various target creep
temperatures. The creep tests were then launched directly after the homogenization stage without going down to room temperature.
The temperature was monitored by using Pt/Pt-Rh thermocouples spot-welded at the surface of the specimen. The temperature gradient along the specimen gauge length is about 10±5°C. The sample gauge length was delimited by using two alumina rings cement-pasted onto the tube.
5 The axial elongation was measured during the test by using a contactless laser extensometer with a spatial resolution of 1 µm.
The tube specimens were loaded in tension along their axial direction. As done in [41], several constant load levels were successively applied to each specimen. A steady-state true strain rate was evaluated for each load level. Indeed, no or very limited primary creep was observed. The tests were performed at constant temperature between 800 and 1000°C for true axial stresses ranging from 2 to 31 MPa. A test with increasing, then decreasing load levels was carried out to check that the loading history has no significant effect on the subsequent creep behavior.
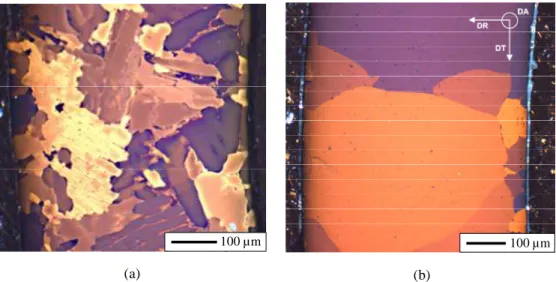
Microstructure of the model materials—Samples having experienced creep testing were
observed at mid-gauge length. As illustrated in Fig. 1 and Fig. 2, the oxygen-enriched specimens are mainly composed of αZr(O) grains, enriched in oxygen and depleted in niobium and iron.
Regions of untransformed βZr (or prior-βZr) phase, strongly enriched in niobium (up to 8 wt.%)
and iron, and containing about 0.5±0.2 wt.% of oxygen, are also observed locally (Fig. 2). The volume fraction of this residual βZr phase is very low (less than 10%) for the lowest investigated
test temperatures or the highest mean oxygen contents. It reaches about 10-15% beyond 1000°C for the material containing 2 wt.% oxygen in average. This is in accordance with results of thermodynamic equilibrium calculations carried out with the Thermocalc software using the Zircobase database [43] (Fig. 3). The residual βZr phase is expected to be present during the
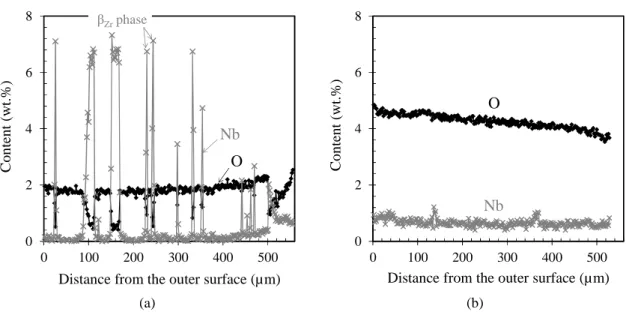
creep tests at HT. The oxygen content is rather homogeneous within the αZr(O) phase of model
samples (Fig. 2), with the exception of the one with 5.8 wt.% of oxygen in average. In this last case, a residual oxygen content relative concentration gradient greater than 30% was measured by EPMA within the cladding wall-thickness.
100 µm
(a)
100 µm
(b)
FIG. 1—Optical micrographs of transverse cross-sections of creep tested model αZr(O) samples containing in average (a) 2 wt.% and (b) 4.3 wt.% of oxygen (outer surface on the left); DR: radial direction; DA: tube axis; DT: circumferential direction.
6
(a) (b)
FIG. 2—Oxygen and niobium concentration profiles (EPMA) across the thickness of model αZr(O) samples containing in average (a) 2 wt.% and (b) 4.3 wt.% of oxygen.
FIG. 3—Measured (EPMA) and calculated (Thermocalc + Zircobase) αZr(O) phase volume fraction as a function of oxygen content and temperature.
The resultant microstructure of the model material depends on the mean oxygen content (Fig. 1). In the material containing about 2 wt.% of oxygen, the αZr(O) phase morphology is
characterized by coarse lamellae, mainly lying down in the tube radial-circumferential plane. These platelets have typical thickness and length ranging from 20 to 40 µm and from 100 to 200 µm, respectively. They are separated by a continuous network of residual niobium enriched prior-βZr phase and/or metastable βZr phase (in Zr-Nb alloys, due to the low thermal diffusivity of
niobium and to a lower αZr transus temperature compared to Zircaloy type alloys, βZr can be
stabilized due to its enrichment in niobium and can be “frozen” down to room temperature [44]). For higher oxygen contents, αZr(O) grains are more equiaxed and larger (200-500 µm) and the
residual (prior-) βZr phase is not percolated. αZr(O) grains are smaller at the cladding sample
surfaces. In the case of the material containing 5.8 wt.% of oxygen, a thin residual oxide layer is 0 2 4 6 8 0 100 200 300 400 500 C o n te n t (w t. % )
Distance from the outer surface (µm)
βZrphase O Nb 0 2 4 6 8 0 100 200 300 400 500 C o n te n t (w t. % )
Distance from the outer surface (µm) O Nb 0,0 0,2 0,4 0,6 0,8 1,0 0 1 2 3 4 5 6 7 αZ r (O ) p h as e v o lu m e fr ac ti o n Oxygen content (wt.%) 1200°C 1100°C 1000°C 1200°C 1100°C 1000°C Zr-1wt.%Nb-Fe-O Calculations
Model αZr(O) material Measurements
7 observed at the surface and underlying αZr(O) grains are partially columnar. Indeed, at such high
oxygen content, the material is nearly saturated in oxygen (the solubility limit is about 7 wt.%) and the concentration gradient and the driving force are low, so that longer heat-treatments would have been necessary to fully homogenize the material.
The crystallographic texture of the model αZr(O) material containing a mean oxygen content
of 2 wt.% was investigated by electron backscatter diffraction (EBSD) and neutron diffraction (Léon Brillouin Laboratory, CEA Saclay). Typically, about 500 grains were analyzed by EBSD, and around 106 by neutron diffraction. The results obtained by the two techniques, giving respectively local and overall/average information, are consistent with each other: the material exhibits a strong texture with <c> axes mainly oriented perpendicularly to the tube axis (Fig. 4). No preferential orientation of the <c> axes along the tube radial or hoop directions was
evidenced by EBSD analysis (due to the tubular geometry of the sample and to the measurement procedure, radial and hoop directions could not be distinguished by neutron diffraction). Kearns factors values (defined as the fraction of resolved basal poles aligned along a particular
macroscopic direction) of 0.41 and 0.44±0.05 are evaluated along the tube axial and hoop directions. This texture is comparable to that measured by EBSD for a αZr(O) layer formed
during the oxidation in steam at 1100°C of a M5® cladding tube specimen (Kearns factors values of 0.36 and 0.51 along the axial and hoop directions, respectively).
(a)
(b)
FIG. 4—Pole figures {10.0}, {11.0} and {00.1} recalculated for a model αZr(O) sample containing 2 wt.% of oxygen in average: (a) surface analysis by EBSD, (b) volume analysis by neutron diffraction; DR: radial direction; DT: circumferential direction.
Then, it can reasonably be considered that the model αZr(O) phase, elaborated by oxidation,
8 claddings oxidized at HT [45]. However, the small volume fraction of residual βZr phase has to
be taken into account for the interpretation of the tests results.
Viscoplastic behavior of the model materials
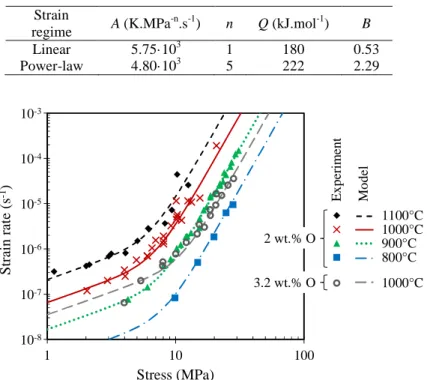
Viscoplastic flow—Results of axial tensile creep tests performed at temperatures between 800
and 1100°C on model αZr(O) samples with 2 and 3.2 wt.% of oxygen in average are shown in
Fig. 5. As illustrated further down, samples with oxygen contents higher than 4 wt.% fail in a brittle manner without significant strain. Two creep regimes are observed. For stresses higher than 15 MPa, whatever the temperature between 800 and 1100°C, the behavior follows a power-law regime with a stress exponent value n close to 5. For lower stresses (lower than 10 MPa), a
nearly linear flow regime is observed at 900, 1000 and 1100°C. These two creep regimes are consistent with results reported at lower temperatures for the αZr phase non-enriched in oxygen
[41]. As already discussed in [39], the results confirm that the oxygen-enriched αZr(O) material
has a significantly higher creep resistance than the as-received material without additional oxygen. The creep resistance increases with increasing the oxygen content. For example, the creep strain rate of the αZr(O) phase containing 2 wt.% oxygen is 104 times slower that rate of βZr
phase, and is expected to be 100-1000 times slower than that of the αZr phase without oxygen
addition. This last phase is not stable at high temperature without oxygen addition but the results presented in [41] has been extrapolated to higher temperatures for comparison to the present results. The creep rate is reduced by nearly a factor 10 when the oxygen content is increased from 2 to 2.9-3.4 wt.%.
By considering the present results for model oxygen-enriched αZr(O) phase (elaborated from
M5®) and the data reported in [41] for non-oxygen enriched Zr-1wt.%Nb-0.14wt.%O, the viscoplastic strain rate of Zr-1wt.%Nb and its dependence on the oxygen content can be fairly well described by the following equation, already used by several authors (see [10], [11] and [12]):
(
O)
n BC RT Q T A − − = exp σ exp ε& (1)where ε& is the true strain rate, σ is the true stress in MPa, T is the temperature in K, C is the O oxygen content in wt.%, R is the gas constant (8.314 J·mol-1·K-1), and A, Q, n and B are material parameters. Adjusted values of model parameters are given in Table 2 for each creep regime. The values of activation energy Q are comparable to those reported for non-oxygen enriched αZr phase in Zr-1wt.%Nb-0.14wt.%O [41]. The effect of oxygen is weaker in the linear
creep regime than in the power-law creep regime. As illustrated in Fig. 5, the model accurately reproduces the behavior of the model αZr(O) phase. Nevertheless, as discussed further in the
forthcoming sections, the physical deformation mechanism in the linear creep regime has not been clearly identified. As a consequence, the viscoplastic flow law tuned for this creep regime has to be considered from a phenomenological point of view only.
9
TABLE 2—Model parameters adjusted to describe each regime of the viscoplastic flow of the model
oxygen-enriched αZr phase. Strain regime A (K.MPa -n.s-1) n Q (kJ.mol-1) B Linear 5.75·103 1 180 0.53 Power-law 4.80·103 5 222 2.29 10-8 10-7 10-6 10-5 10-4 10-3 1 10 100 S tr ai n rat e (s -1) Stress (MPa) 2 wt.% O 3.2 wt.% O E x p er im en t M o d el 1100°C 1000°C 900°C 800°C M1 M4 1000°C M11
FIG. 5—Strain rate as a function of stress: experimental data on model αZr(O) samples and predictions of the viscoplastic flow model presented in this paper.
The predictions of this model are compared in Fig. 6to those of models reported in the literature. The calculations were done for a temperature of 1000°C and stress levels of 2 and 20 MPa, relative to the linear and power-law creep regimes, respectively. For this purpose, models from the literature were extrapolated up to 1000°C ([10], [41] and [47]), down to 2 MPa ([10], [12] and [47]) and up to 3.2 wt.% of oxygen ([10], [12], [41] and [47])). Under a stress level of 20 MPa, the strengthening effect of oxygen predicted by the model proposed in the present paper (B=2.29) is lower than those reported by Chow et al. [12] for Zircaloy-4 (
8 . 2
=
B ) and Burton et al. [10] for Zircaloy-2 (B=3.42). Oxygen contents and temperatures investigated in [12] and [10] are lower than those of the present study. Thus, the lower value obtained here for B may be due to a saturation of the strengthening effect of oxygen for contents higher than 1.5 wt.% or to a reduction of the strengthening effect with increasing temperature. For a stress level of 2 MPa, the predictions of the present model deviate significantly from those of models from the literature. This is due to the introduction of a linear creep regime, observed for the first time in a highly enriched material, the underlying physical mechanism of which still being unknown.
10
FIG. 6—Effect of oxygen on the creep strain rate at 1000°C under 2 and 20 MPa according the creep law developed
for αZr(O) in the present study and the laws proposed by Burton et al. [10] and Donaldson and Evans [47] for Zircaloy-2, Kaddour et al. [41] and Chow et al. [12] for Zircaloy-4 and Kaddour et al. [41] for M5®.
Influence of microstructural features—The model oxygen-enriched material is mostly
constituted of αZr(O) phase, enriched in oxygen and depleted in niobium and iron, with a
minority of βZr phase, depleted in oxygen and enriched in niobium and iron. The residual fraction
(up to 15%) of untransformed βZr phase is expected to have, on the one hand, a softening effect
on the creep behavior of the model materials, due to the lower creep resistance of the βZr phase
compared to the αZr(O) phase. On the other hand, it is expected to have a strengthening effect due
to oxygen enrichment of the αZr(O) phase relatively to the mean oxygen concentration. These
effects were estimated for the model material containing 2 wt.% of oxygen in average, tested above 1000°C, by using a homogenization approach with a Taylor assumption. The macroscopic axial strain rate Ε& and the axial strain rates of αZr(O) and βZr phases, respectively noted ε&αZr(O) and
Zr
β
ε& , were assumed to be equal:
Zr Zr O β α ε ε& & & = = Ε ( ) (2)
The macroscopic axial stress, Σ was assumed to depend on axial stresses, (O)
Zr α σ and Zr β σ
within αZr(O) and βZr phases, respectively, and on the volume fraction of the βZr phase, fβZr:
(
− fβZr)
⋅σαZr O + fβZrσβZr=
Σ 1 ( ) (3)
The mechanical behavior of the βZr phase was described by the power-law model proposed in
[41] for Zr-1wt.%Nb-0.14wt.%O, modified to take into account the effect of enrichment in niobium. Trego [46] has shown that an increase in niobium content from 1 to 2.25 wt.% reduces by a factor of 0.5 the creep rate of the βZr phase. Enrichment in niobium is larger in the present
10-17 10-15 10-13 10-11 10-9 10-7 10-5 10-3 0 1 2 3 4 5 6 7 Oxygen content (wt.%) 1000°C 2 MPa S tr ai n ra te ( s -1) DUCTILE BRITTLE Ductile-to-brittle transition 10-12 10-10 10-8 10-6 10-4 10-2 1 0 1 2 3 4 5 6 7 Oxygen content (wt.%) 1000°C 20 MPa S tr ai n ra te ( s -1) BRITTLE DUCTILE Ductile-to-brittle transition
Model αZr(O) material (this study)
M5® (Kaddour et al., 2004) Zircaloy-4 (Kaddour et al., 2004) Zircaloy-2 (Donaldson and Evans, 1981)
Zircaloy-2 (Burton et al., 1979) Zircaloy-4 (Chow et al., 1982)
αZr(O) (this study)
T es ts L aw s
ߝ
̇
11 case. However, in the absence of additional data, a factor 0.5 has been applied to the strain rate predicted by the model described in [41], so that the βZr phase creep rate is probably slightly
overpredicted, i.e. the softening effect of the βZr phase is overestimated. Parameters of the power-law equation that describes the intrinsic mechanical behavior of the αZr(O) phase were
then adjusted by using an iterative process so that the macroscopic response of the model for the homogenized material fits the experimental results obtained for the model αZr(O) samples (which
include residual βZr phase). The results, reported in Table 3, show that the behavior of the model
αZr(O) material is close to the intrinsic behavior of the αZr(O) phase: the strain rate is reduced by
less than a factor 2. The strengthening effect of local enrichment in oxygen of the αZr(O) phase in
the model material can be evaluated by using the model presented above (Eq. (1) and Table 2). According to predictions from this model, an increment ∆CO of the oxygen content induces a reduction by a factor exp
(
−2.29⋅∆CO)
of the strain rate in the power-law creep regime. The results obtained for the oxygen contents in the αZr(O) phase calculated with Thermocalc +Zircobase are given in Table 3 for the model material with a mean oxygen content of 2 wt.%. An increase in the oxygen content by 0.25 wt.% leads to a reduction of the creep rate of the αZr(O)
phase by a factor 2. Thus the results show that the softening effect of the residual βZr phase and
the strengthening effect of the slight enrichment in oxygen of the αZr(O) phase are relatively
small (they are negligible below 1000°C and affect by a factor 2 the strain rate at 1100°C) and compensate each other in the high stress creep regime. As a consequence, these effects were not explicitly taken into account in the following. Only the values of the creep model parameters directly tuned on the basis of the data obtained on the model oxygen-enriched materials (Table 2) were used.
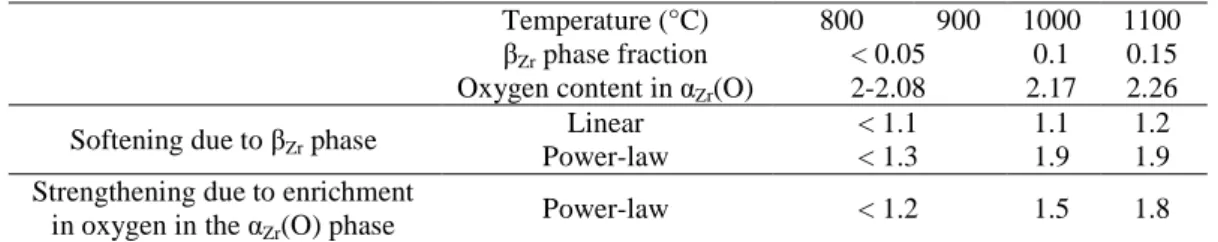
TABLE 3—Estimated effects of residual βZr phase on the enrichment in oxygen of the αZr(O) phase, and on the creep rate (multiplying factors) of the model αZr(O) material with a mean oxygen content of 2 wt. %.
Temperature (°C) 800 900 1000 1100
βZr phase fraction < 0.05 0.1 0.15
Oxygen content in αZr(O) 2-2.08 2.17 2.26
Softening due to βZr phase
Linear < 1.1 1.1 1.2
Power-law < 1.3 1.9 1.9
Strengthening due to enrichment in oxygen in the αZr(O) phase
Power-law < 1.2 1.5 1.8
Creep mechanisms in the linear regime—Beyond 1000°C and for low stress levels
(< 10 MPa), a nearly linear creep regime is observed in the model material containing 2 wt.% of oxygen. In the αZr phase non-enriched in oxygen tested at lower temperatures, this linear regime
is associated with a Coble type diffusion creep mechanism (diffusional flow along grain
boundaries) [49]. However the grain size in the oxygen-enriched material is significantly larger (about 6.75·105 µm3) than that of starting, non-enriched material (about 103 µm3) and the linear creep regime may thus result from another physical viscoplastic flow mechanism. This cannot be clearly identified on the basis of available data. Nevertheless, a first qualitative analysis can be made in order to try to evaluate which among the Nabarro-Herring (bulk diffusional flow) [50], Coble and Harper-Dorn (probably dislocation core diffusion controlled) [51] creep mechanisms might significantly contribute to this flow regime.
12 In a first step, the effect of oxygen on these mechanisms was not taken into account. For dislocation and Coble regimes, viscoplastic flow models reported by Kaddour et al. [41] and Trego [46] were used. A grain size dependence similar to that identified in [46] was added for the Coble regime to the model described in [41]. For the Harper-Dorn and Nabarro-Herring creep regimes, no data are available for Zircaloy-4 or M5®, so that the models respectively proposed by Fiala and Cadek [52] and Prasad et al. [53] for pure zirconium were used. These last two laws probably overpredict the creep rate of zirconium alloys due to the expected effects of alloying elements. As shown in Fig. 7, at 700°C under 1 MPa, the Coble type regime prevails for grain size around 6 µm, in accordance with experimental observations. The Harper-Dorn creep predominates for grain size larger than 30-60 µ m. At 1000°C, the laws were extrapolated since the αZr phase does not exist at this temperature without important addition of oxygen. According
to this extrapolation, the Nabarro-Herring creep would prevail for grain sizes between 10-50 and 200 µm. This suggests that this is the main mechanism in the model material containing 2 wt.% of oxygen, which has an equivalent grain size of about 90 µm. However, the creep rates
predicted by the Nabarro-Herring and Coble type creep laws are close to each other. The estimated contribution from the Harper-Dorn mechanism is the lowest at 1000°C. Thus, the Harper-Dorn mechanism is probably not the mechanism responsible for linear creep of the model oxygen-enriched material.
The αZr(O) phase in the model material with 2 wt.% of oxygen appears as parallel platelets
with typical approximate dimensions of 30×150×150 µm3. The shorter dimension of αZr(O)
platelets is parallel to the cladding axis, which is the tensile loading direction in the present tests. According to Nix’s analysis [48], assimilating the grain to a parallelepiped, the creep rate when it is controlled by a Coble mechanism would be 2.4 times faster in a typical αZr(O) platelet than in
a microstructure of cube-shaped grains of the same volume. The contribution of the Nabarro-Herring mechanism would not be significantly affected by the morphology of αZr(O) grains. It is
important to note that this analysis is approximate in the present case, since the description of microstructure is very simplified. In the actual material, grain boundaries might not be perfect sources or sinks for vacancies contrary to what is assumed in Nix’s model, and the actual grain distribution and the potential connection of αZr(O) platelets are not taken into account. However,
these simple estimates suggest that the microstructure of the model material with 2 wt.% of oxygen could be more sensitive to Coble creep than to Nabarro-Herring creep in the temperature and strain rate range considered in this study.
In a second step, potential effects of oxygen were considered. It is known that oxygen has an exponential strengthening effect on the dislocation creep but to the authors’ knowledge there is no data on the influence of oxygen for diffusion and Harper-Dorn mechanisms. Oxygen addition should have an important effect on the Harper-Dorn creep mechanism since this mechanism also involves dislocations, as in power-law creep regimes [54]. As a consequence, it is unlikely that the Harper-Dorn mechanism prevails in the linear creep regime. It can be imagined that oxygen interstitial atoms could have an effect on the diffusion mechanisms via their effect on the diffusion of zirconium, as observed for example for iron in zirconium [55]. No significant oxygen segregation was observed by EPMA in the model oxygen-enriched materials but the spatial resolution was not sufficient to address grain boundary segregation. Another difficulty in the present case, implying oxygen concentrations higher than 10 at.%, is that the interactions between oxygen atoms probably play a role on the diffusion mechanisms.
13 To conclude, with the current knowledge it appears to be difficult to identify the mechanism that drives the low-stress linear creep regime of oxygen-enriched material at HT. It is possible that the diffusion Nabarro-Herring or Coble type creep mechanisms dominate in spite of the relatively large grain size. A way to rank Nabarro-Herring, Coble and Harper-Dorn mechanisms would be to carry out tests on materials with the same oxygen content but various grain sizes.
10-13 10-11 10-9 10-7 10-5 1 10 100 Grain size (µm) S tr ai n ra te ( s -1) αZrphase 700°C, 1 MPa Harper-Dorn Dislocation Coble M5® (Trego, 2011) M5® (Kaddour et al., 2004) Zircaloy-4 (Kaddour et al., 2004) Zirconium (Fiala and Cadek, 1985) Zirconium (Prasad et al., 1989)
FIG. 7—Strain rate as a function of the grain size in zirconium and its alloys according to creep models associated
with diffusional flow (Coble, Nabarro-Herring), dislocation-driven and Harper-Dorn deformation mechanisms at 700°C.
Fracture of the model materials
Macroscopic ductility—The maximal axial strain values measured during the axial tensile
creep tests are reported in Fig. 8. These values are lower bounds of the actual strain values at failure. Indeed, most of the time, the alumina rings that delimit the sample gauge length fell when the axial strain reaches 4 to 10 %, so that the sample continues to deform until fracture but with no axial strain monitoring. From Fig. 8, model αZr(O) materials with oxygen contents
between 2 and 3.2 wt.% are ductile between 800 and 1100°C: axial strain levels higher than 10% or even 20% are reached without failure. Samples with oxygen contents higher than 4 wt.% failed in a brittle manner, for very low strain levels, even at 1100°C. A ductile-to-brittle transition is thus highlighted at 1000-1100°C for oxygen contents between 3.4 and 4.3 wt.%.
14 0,0 0,1 0,2 0,3 0 1 2 3 4 5 6 7 A x ia l st ra in ( -) Oxygen content (wt.%) Conduit à rupture Stoppé avant rupture 800°C 900°C 1000°C 1100°C Ductile-to-brittle transition * Fractured
Stopped before failure
*: Post-mortem profilometry measurement
FIG. 8—Evolution of the maximal measured axial strain (lower bound of fracture strain) as a function of the oxygen
content and test temperature of the αZr(O) samples tested under tensile creep.
Microscopic fracture modes—The observation by Scanning Electron Microscopy (SEM) of
the fracture surfaces of creep specimens with 2 and 3.4 wt.% of oxygen shows that the fracture mode is not the same at the outer periphery and within the rest of the sample (Fig. 9). This highlights an effect of the oxidation then homogenization processing route used to elaborate the model materials: the mechanical behavior of the αZr(O) phase is different in regions where the
oxide and the αZr(O) phase were located after oxidation and in regions where the αZr(O) phase
was formed during the reduction/diffusion heat treatment, whereas the microstructure (chemical partitioning, texture and grain morphology) of the material in these regions could not be
differentiated from that of the rest of the cladding. This difference may be due to the existence of finer and disoriented subgrains linked to the structure of the parent oxide phase layer, to a short-range ordering for particular oxygen concentration short-ranges and/or to defects (cavities,
microcracks, …) resulting from the transformation, associated with a significant volume decrease (about 50%), of zirconia to αZr(O).
At the outer periphery of the samples, the macroscopic fracture surface is nearly perpendicular to the loading direction and suggests a nearly brittle failure mode. A network of steps, oriented along a reduced number of directions, is evidenced on the surface of these outer cracks. These steps could be due to slip along the cleavage or gliding planes of the crystals. With the exception of the sample outer periphery, an important reduction in thickness, up to almost 100% at the failure location, is measured for samples with 2 and 3.4 wt.% of oxygen. Large (> 20 µm) elliptical dimples are also observed locally on the fracture surfaces. The observation of a longitudinal cross-section of a sample containing 2 wt.% of oxygen fractured at 900°C revealed that the αZr(O) phase can withstand high strain levels. Due to its much lower oxygen content, the
(prior-) βZr phase, which forms a nearly continuous network in the model material enriched to
2 wt.% of oxygen, has probably an influence on strain accommodation and strain incompatibility between αZr(O) platelets, leading to a higher macroscopic ductility. Steps similar to those
observed in the nearly brittle outer zones are present on the sides and at bottom of dimples (Fig. 9(a)). The presence of these steps on the sides of dimples suggests that they are slip steps rather
15 than cleavage steps. Steps form angles of 90 and 120°, in accordance with slip planes of the αZr
phase hexagonal structure.
Cracks
Dimples Ridge
line
(a)
Cracks
Inner periphery Ridge
line
500 µm
(b)
FIG. 9—SEM micrographs of the fracture surfaces of αZr(O) samples containing (a) 2 wt.% of oxygen (right figure: enlarged view inside a dimple) and (b) 3.4 wt.% of oxygen (right figure: enlarged view on a nearly brittle zone) fractured at 1000°C; DR: radial direction; DA: tube axis; DT: circumferential direction.
Model materials with 4.3 and 5.8 wt.% of oxygen exhibited a purely brittle behavior above 1000°C. For 4.3 wt.% of oxygen, grains were very coarse and fracture was mainly intergranular (Fig. 10(a)). A 50-µm-thick layer of αZr(O) phase (confirmed by EPMA) with an atypical
columnar morphology was observed at the sample outer periphery. This further suggests that the initial microstructure of the oxidized material was not completely “erased” during the
reduction/diffusion heat treatment under vacuum at high temperature, so that a fraction of the
αZr(O) phase formed at the initial location of the prior oxide layer would have kept a columnar
(sub)structure morphology. This microstructural inheritance has still to be characterized. It is thus difficult to evaluate the particular role of this layer with a specific microstructure on the overall cladding fracture mode. In the material with 5.8 wt.% of oxygen, fracture occurs mainly by cleavage and river patterns are observed on the fracture surface (Fig. 10(b)). In some regions
16 with a flat and smooth appearance, it is not clear whether failure is intergranular or due to
cleavage in a coarse grain. A thin residual columnar zirconia layer, showing an intergranular failure mode, is observed at the cladding outer periphery. The mixed cleavage and intergranular fracture mode observed at high temperature when the material is completely brittle (oxygen content higher than 4.3 wt.%) is consistent with the fracture modes reported for example by Garde et al. [56] for Zircaloy-4 with 2.3 wt.% of oxygen tested at 850°C.
Inner periphery Columnar αZr(O) Outer periphery Columnar αZr(O) (a) Inner periphery
Residual zirconia Outer periphery
(b)
FIG. 10—SEM micrographs of the fracture surfaces of (a) an αZr(O) sample containing 3.4 wt.% of oxygen fractured at 1100°C (right image: detailed view of αZr(O) on the tube external periphery) and (b) an αZr(O) sample containing 5.8 wt.% of oxygen fractured at 1000°C (right image: enlarged view of residual zirconia within the αZr(O) layer).
Modeling of the creep behavior at high temperature of an oxidized cladding
Model description—In order to understand the strengthening effect of oxidation on the creep
17 implemented into the finite element code Cast3M developed at CEA6. The purpose was to
calculate the mechanical response of an oxidized cladding submitted to internal pressure creep at high temperature (1000 and 1100°C) and to compare the predictions to the results of tests
performed in a steam environment in the EDGAR facility [40] on Zircaloy-4 and M5® cladding specimens.
The oxidized cladding was represented as a stratified material including three layers in the case of a one-side oxidation from the outer surface: an outer oxide layer, an αZr(O) phase layer
and an inner βZr phase layer. In a first approach, mechanical properties were assumed to be
isotropic, growth of the oxide and αZr(O) phase layers was not simulated so that calculations
were done for predetermined constant layers thicknesses, damage or cracking were not simulated, the various layers were supposed to be perfectly adherent and separated by flat interfaces, and oxidation-induced internal stresses, thermal strains and strains due to phase transformations as well as oxide growth or oxygen ingress into the metal were not considered. The results presented in the present paper have shown that the αZr(O) phase is brittle at high
temperature when its oxygen content exceeds about 4 wt.%. Thus it can be reasonably expected that in an oxidized cladding, the part of the αZr(O) phase layer that contains the highest oxygen
content cracks at the very beginning of loading during a creep tensile test at high temperature. It was difficult to say from post-mortem observations of tested specimens whether the oxide layer
fails in a brittle manner at the beginning of the test or not. Three configurations were thus considered in the simulations:
• two layers (βZr + αZr(O)2-4): the αZr(O) phase layer was considered in addition to the βZr
phase layer but only that part where the oxygen content was lower than 4 wt.%;
• two layers (βZr + αZr(O)2-7): the βZr phase layer and the whole αZr(O) phase layer were
considered;
• three layers (βZr + αZr(O)2-7 + ZrO2): the whole βZr phase, αZr(O) phase and oxide layers
were taken into account.
The simulations were performed in 3D although they could have been carried out in 2D. A small portion (0.02° sector with a height of 2 µm) of the cladding was meshed by using quadratic brick elements with full integration. The size along the tube radial direction of the elements within the αZr(O) and oxide layers was 1 or 2 µm according to whether the thickness of the layers
was lower than 10 µm or not. A varying mesh density was defined for the βZr phase layer: the
element thickness was similar to the one used for the αZr(O) layer next to this last layer and was
larger (20 µm) near the inner tube surface. The thicknesses of the oxide and αZr(O) phase layers
were evaluated from growth kinetics determined on the basis of data obtained at CEA on samples oxidized in steam at high temperature [3][18][35]. The oxygen content distribution throughout the oxidized cladding was represented by introducing an oxygen concentration field defined at Gauss points. A linear oxygen concentration gradient was defined across the αZr(O)
phase layer (from 2 wt.% at the interface with the βZr layer to 4 or 7 wt.% at the opposite surface,
according to the selected configuration). Arbitrary, but reasonable oxygen contents were defined for the βZr phase and the oxide, as the oxygen content does not have a significant effect on the
mechanical behavior of the first one and is not useful to describe the behavior of the second one.
6
18 Standard symmetry conditions were applied to the nodes of the upper, lower and lateral surfaces. From a preliminary study of specimens subjected to internal pressure creep, zero displacement imposed along the tube axial direction was representative of the mechanical response of an isotropic cladding material submitted to a closed-end internal pressurization test. An internal pressure, updated at each time-step in order to account for the deformed geometry, was applied to the tube inner surface. The calculations were performed by using an updated Lagrangian method. A variable time-step between 0.1 and 200s was used for the investigated range of creep rates (10-2-10−8 s-1). It was checked that the mesh sizes and the time-steps used were small enough to guarantee that the results were not significantly affected by the spatial and temporal discretization.
The total strain was additively decomposed into elastic and viscoplastic strains (the stress threshold value between elastic and viscoplastic regimes was set to zero). Elastic strains were calculated via a isotropic Hooke’s law with Young’s modulus values of 44 GPa for βZr and
αZr(O) phases and 200 GPa for zirconia, and a Poisson’s ratio value of 0.3 for all the phases. By
assuming that linear and power-law creep regimes coexist although one or the other dominates depending on the condition, the viscoplastic strain rate tensor was defined as the sum of the viscoplastic strain rate tensors corresponding to each of the two creep regimes. Each viscoplastic strain rate tensor was obtained by assuming the normality rule. It was considered that the two viscoplastic strain rates were associated with the same flow direction. Although the material was anisotropic and textured, a von Mises equivalent stress was used. The plastic multipliers were given for each regime by the viscoplastic flow equations in the form of Eq. (1). The viscoplastic behavior of the βZr phase was described by the flow equation proposed in [41] for Zircaloy-4 and
by those presented in [41] and [46] for M5®. The flow equation described in the present paper (Eq. (1) and Table 2) was used to describe the oxygen-dependent viscoplastic behavior of the
αZr(O) phase. The viscoplastic behavior of the oxide layer was not known at high temperature. In
a first approach, the viscoplastic behavior of the oxide was described by a power-law equation tuned on the basis of results of creep compression tests performed at high temperature on a bulk, industrial doped monoclinic and tetragonal zirconia [57][58][59]; the following adjusted values were found for parameters in Eq. (1): A = 5.08·1015 K.MPa-n.s-1, n = 1.52, Q = 500 kJ.mol-1,
B = 0. According to these data, the creep rate of zirconia for a given stress is within the range of
the rates expected for the αZr(O) phase, which contains 2 to 7 wt.% of oxygen. This law provides
certainly a very rough representation of the behavior of the oxide layer of interest here, whose chemical composition and microstructure are very different from those of industrial doped zirconia.
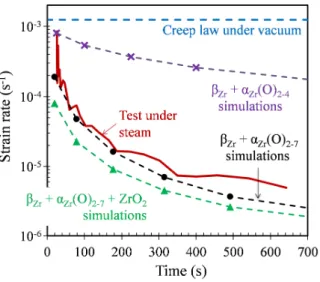
Results and discussion—As shown in Fig. 11, the (βZr + αZr(O)2-4) model significantly
underestimates (by a factor 100 to 1000) the gradual reduction in strain rate observed during internal pressure creep tests performed under steam at high temperature. The experimental results are fairly well reproduced by the (βZr + αZr(O)2-7) model. The supplementary
strengthening brought by the addition of the oxide layer ((βZr + αZr(O)2-7 + ZrO2) model) is
limited (factor 2 on the creep rate). In that case, the creep resistance of the cladding is slightly overpredicted. The conclusions are similar for all the other conditions tested, for Zircaloy-4 and M5® claddings and creep temperatures of 1000 and 1100°C. This suggests a posteriori that the
19
αZr(O) phases formed in Zircaloy-4 and M5® have comparable microstructures and mechanical
behaviors.
The deformation mechanism associated with the linear creep regime of the αZr(O) phase was
not clearly identified and it was not possible to determine whether it is sensitive to the grain size or not. As a consequence, the flow equation proposed to describe the viscoplastic behavior of the
αZr(O) phase does not account for an eventual grain size effect. In order to evaluate the impact of
this assumption on the results, the creep law of the αZr(O) phase in the linear regime was
modified by adding a cubic dependence on the grain size (Coble type diffusion creep). A reference grain size of 66 µm was chosen in accordance with the analysis made above. A grain size equal to the thickness of the αZr(O) layer (2-70 µm) is considered. The results obtained with
the (βZr + αZr(O)2-7) model are only slightly modified by the introduction of this grain size
dependence, which therefore does not question the main conclusions of this study.
The calculations show that it is necessary to consider that the αZr(O) phase is not cracked,
even partially, to correctly predict the mechanical behavior of the oxidized cladding. This is in contradiction with fractographic results from the present study. This mechanical strength is all the more surprising as simulations predict high stress levels (up to about 200 MPa) in the outer part of the αZr(O) layer in oxidized claddings submitted to creep tests. This discrepancy could be
due, for instance, to the following effects, which were not taken into account in the simulations: internal stresses generated by the oxidation, anisotropy of the αZr(O) and zirconia mechanical
properties and/or interaction between oxidation and viscoplastic deformation.
FIG. 11—Evolution of the creep strain rate during an internal pressure creep test performed on a Zircaloy-4
cladding specimen in steam at 1100°C with a 5 bar internal pressure: experimental result, prediction of the creep model presented in [41] for a non-oxidized cladding and results of finite element simulations considering two or three layers.
Partial conclusion
The mechanical behavior of the αZr(O) phase at HT was investigated through axial tensile creep
20 M5® cladding, homogeneously enriched in oxygen at various contents between 2 and 5.8 wt.%. It was shown that the αZr phase is significantly strengthened and embrittled by oxygen. Two
creep regimes were observed depending on stress level. Creep and failure mechanisms have been discussed. A ductile-to-brittle transition was observed at 1000-1100°C for oxygen contents between 3.4 and 4.3 wt.%. The contribution of the αZr(O) phase layer to the creep behavior of an
oxidized fuel cladding tube submitted to internal pressure at HT was evaluated by finite element analysis.
Mechanical behavior of the highly hydrogen-enriched (prior-) βZr phase
Materials and experimental procedures
Sample preparation—In order to study the effect of high hydrogen contents (up to about
3200 wt.ppm) on the mechanical properties of the (prior-) βZr phase, model hydrogen-enriched
samples were produced from as-received stress-relieved annealed low tin Zircaloy-4 cladding tubes (outer diameter and thickness of about 9.5 mm and 0.57 mm, respectively) supplied by AREVA NP. The as-received material chemical composition is given in Table 1. The material initially contains about 0.13 wt.% of oxygen and less than 5 wt.ppm of hydrogen. 60-mm-long cladding tube samples were charged in hydrogen by gaseous charging at 800°C in a furnace in a flowing mixture of argon and hydrogen and were then cooled down to room temperature at a rate of a few °C/min.
The hydrogen content was measured for each sample by using an inert gas fusion thermal conductivity technique (various analyzers were used: HORIBA 821, HORIBA EMGA-921, LECO RH404). Hydrogen content measurements were also performed on a selected number of samples by differential scanning calorimetry, micro elastic recoil detection analysis (µ-ERDA) (CEA Saclay, DSM, IRAMIS, SIS2M, LEEL) [30][31] and neutron radiography (CEA Saclay, DEN, DRSN, SEROS). The relative uncertainty on hydrogen content measurement is estimated to be about ±15% for the highest hydrogen contents investigated here. The measured hydrogen contents range from about 1700 to 3200 wt. ppm. It was checked that homogeneity of hydrogen content within the samples is satisfactory for the present application. Infrared absorption
analyses (LECO TC500 analyzer) have shown that a slight oxygen uptake of about 0.07±0.02 wt.% occurs during the hydrogen charging treatment, so that hydrogen-charged samples contain about 0.21±0.01 wt.% of oxygen on average, instead of 0.13 wt.% in the as-received material.
Microstructure of the model materials right after hydrogen charging—The purpose of this
part of the study was to characterize the properties of the βZr phase. As a consequence, a
heat-treatment in the βZr phase domain has been applied to the samples before mechanical testing.
However, it is interesting to briefly discuss the evolution of the material during hydrogen charging by looking at the material microstructure right after hydrogen charging. Observations by optical microscopy and SEM and chemical micro-analysis by EPMA performed on a selected number of samples did not evidence any oxide layer. However, thin layers of αZr(O) phase
enriched in oxygen were observed at the sample surfaces, in accordance with the above mentioned slight oxygen uptake.
21 The material microstructure right after hydrogen-charging depends on the mean hydrogen content. At 800°C, the as-received material is in the αZr phase. During hydrogen-charging at
800°C, once the hydrogen content is high enough, the primary αZr phase progressively
transforms into the βZr phase due to the effect of hydrogen on the phase transformation
temperatures. For hydrogen contents of 2000 and 3000 wt.ppm, the material is expected to have fully transformed into βZr phase at 800°C. As illustrated in Fig. 12, at the beginning of cooling,
above the eutectoid temperature (about 550°C [43]), the βZr phase progressively transforms into
proeutectoid αZr phase. The eutectoid reaction then leads to a fast transformation of the residual
βZr grains into αZr grains. As a consequence, the material right after hydrogen-charging at 800°C
up to about 2000 and 3000 wt.ppm is constituted of a mixture of proeutectoid αZr phase and αZr
phase that appeared below the eutectoid temperature (corresponding respectively to the lightest and darkest regions in Fig. 12(a)). As a result of element partitioning, the first one is enriched in
αZr-stabilizers (oxygen in particular) and depleted in βZr-stabilizers (hydrogen in particular) and
the second one is depleted in αZr-stabilizers and enriched in βZr-stabilizers. As exemplified in Fig.
12, according to thermodynamic calculations performed with the Thermocalc software using the Zircobase database [43], the βZr phase volume fractions just before the eutectoid transformation
(at equilibrium) are about 45 and 65% for the materials containing respectively 2000 and 3000 wt.ppm of hydrogen in average. This is in accordance with the microstructures observed right after hydrogen-charging.
(a) (b)
FIG. 12—(a) Optical micrograph of a transverse cross-section right after hydrogen-charging at 800°C (and cooling
at a few °C/min) of a Zircaloy-4 sample containing about 3200 wt.ppm of hydrogen (and about 0.2 wt.% of oxygen) and (b) calculated (Thermocalc + Zircobase) evolution of equilibrium phases volume fractions for Zircaloy-4 containing 3000 wt.ppm of hydrogen (and 0.14 wt.% of oxygen) as a function of temperature.
Mechanical testing—Uniaxial tensile test specimens with a gauge length of 8 mm and a gauge
width of 2 mm (Fig. 13) were fabricated from the cladding tubes, hydrided or not. For each specimen, oxygen and hydrogen contents were measured respectively by infrared absorption (LECO TC500 analyzer) and thermal conductivity (LECO TC500 and HORIBA EMGA-921 analyzers) from the offcuts on both sides of the gauge length.
22 The specimens were mounted on an electrical-mechanical tensile machine with a radiation furnace. They were then quickly heat-treated in the βZr temperature domain (heating at about
15°C/s up to 800°C then about 3°C/s up to approximately 1200°C) into the facility and almost directly cooled (i.e. holding of only a few tens of seconds at HT) afterwards by turning off the power to the furnace, down to the target temperature for the tensile test, which was then directly
launched. The cooling rate is about 5°C/s between 1200°C and 700°C, 1°C/s around 500°C and lower than 1°C/s below. The tests were performed upon cooling from the βZr temperature domain
and not after cooling and reheating to the test temperature to guarantee that the microstructure and thus the mechanical behavior of the material are representative of those of the (prior-) βZr
phase during cooling and quenching at the end of a LOCA-type transient. Temperatures of tensile tests between 700 and 20°C were investigated. The temperature was monitored by using three Pt/Pt-Rh thermocouples spot-welded at the surface of the specimen holding device. A thermal benchmark was performed beforehand to set the temperature monitoring by comparison to the targeted test temperatures. The temperature gradient along the specimen gauge length and the temperature uncertainty and variation during the tests were expected to be lower than 10°C, respectively. The tests were performed in air so that a thin oxide layer (thickness of about 5-10 µm) grows during heating at the specimen surfaces in order to prevent hydrogen desorption. A thin αZr(O) layer (thickness of about 5-10 µm) also formed beneath the oxide layer and a limited
amount of oxygen could have diffused into the βZr phase. The effect on the results of this slight
oxidation is discussed later in the paper. The tests were performed with a constant displacement rate of 0.8 mm·s-1 so that the mean strain rate was about 0.1 s-1. By applying this relatively fast strain rate, metallurgical evolutions and oxidation of the material during the test were minimized. This loading rate is expected to be faster than the rates at which the cladding can be submitted during a LOCA transient.
In order to characterize the Young’s modulus and plastic strain anisotropy, axial elongation and width reduction of the specimen gauge part were measured during the experiments before necking by using a 2D digital image correlation technique (optical method that provides local displacement and strain fields on the surface of the observed object by comparing digital images of a reference and a deformed configuration). The patterns that offer the local contrast required for the identification of homologous points were obtained by marking the outer surface of the specimen gauge part with a titanium dioxide based white fluid. The surface to analyze was illuminated in white light and observed by an optical camera with an image rate of 250 images per second. The VIC-2D™7 software was used for the digital image correlation. Axial and hoop strains fields measured along specimen length and width were averaged over the specimen gauge part. An accuracy better than ±3·10-4 is expected on mean strain measurements.
Engineering stress was calculated by dividing the applied force by the specimen initial cross-section. Parameters representative of tensile tests, such as yield stress at 0.2% plastic strain, ultimate stress (maximum stress value measured during the test) and uniform elongation (plastic strain at the maximum stress, corresponding to the onset of necking in the case of ductile
materials), were determined from engineering stress-strain curves, with the engineering strain being calculated by dividing the cross-head displacement by the specimen initial gauge length. The engineering axial strain measured by digital image correlation was used for the evaluation of
7
23 Young’s modulus. In order to characterize the ductility of the material, the cross-section
reduction at failure was optically measured after fracture of the specimens (observations performed parallel to the tensile axis) with an absolute accuracy of about ±8%.
FIG. 13—Specimen used for axial tensile tests on (prior-) βZr materials (dimensions in mm).
Results and discussion
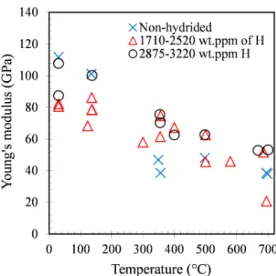
Elasticity—As illustrated in Fig. 14, the value of Young’s modulus obtained at room
temperature for the non-hydrided prior-βZr material is consistent with those measured by
Stern et al. [14] by using a resonance method (dynamic Young’s modulus) on prior-βZr samples
elaborated from a Zircaloy-4 sheet, which are by the way close to those reported in [60] and [61] for the as-received material (no heat-treatment in the βZr temperature domain before testing). The
results show that the Young’s modulus of the (prior-) βZr phase, hydrogenated or not, decreases
with increasing the temperature between 20 and 700°C. The evolution as a function of
temperature is not very different from those predicted by the correlations given in [60] and [61] for the as-received material.
Taking into account the uncertainty on measurements and the significant scattering of results, no significant effect of hydrogen up to about 3000 wt.ppm is evidenced whatever the
temperature. Yamanaka et al. [70] observed that the Young’s modulus between 20 and 500°C of pure αZr charged in hydrogen up to about 250 wt.ppm decreases with increasing hydrogen
content when hydrogen is in solid solution and slightly increases when hydrogen is partially precipitated under the form of hydrides. The oxygen content of the hydrogenated samples is a few hundreds of wt.ppm higher than that of the as-received material (due to oxygen absorption during hydrogen charging). However, oxygen does not have a significant effect on elastic properties within this concentration range [7][14]. Oxide and αZr(O) layers grow during the
heat-treatment in air up to the βZr temperature domain, applied before mechanical testing. These
phases, which are probably not already cracked at the beginning of the tensile test, have Young’s moduli higher than the (prior-) βZr phase [7][14][60]. However, these layers are relatively thin
(about 5-10 µm so that the cumulated thickness of these layers is around 5% of the cladding wall-thickness) and their contribution to the measured Young’s modulus is expected to be within experimental uncertainty.
24
FIG. 14—Evolution as a function of temperature of the Young’s modulus (accuracy of about ±10 GPa) of model
(prior-) βZr materials, non-hydrided or containing between 1710 and 3220 wt.ppm of hydrogen (and at least 0.2 wt.% of oxygen).
Fracture—The non-hydrided model (prior-) βZr material is ductile whatever the temperature upon cooling between 20 and 700°C (Fig. 15 and Fig. 16), in accordance with Sawatzky [8] or Stern et al.’ [14] results for example. Plastic elongation and cross-sectional reduction of area at fracture reach several percents at room temperature and increase with increasing temperature. Reduction of area at failure is nearly 100% at 700°C. The values of plastic elongation at failure are consistent with those obtained by Stern et al. [14] from tensile tests performed between 20 and 260°C on model non-hydrided prior-βZr sheet specimens with a gauge part of the same size
as the cladding specimens tested in the present study. As shown in Fig. 15 and Fig. 16, the model (prior-) βZr material is embrittled by hydrogen contents of 2000-3000 wt.ppm for a given
temperature below 500°C. The material becomes macroscopically brittle at 135°C and below for an average hydrogen content of about 2000 wt.ppm and at 350-400°C for a content of about 3000 wt.ppm. At 20 and 135°C, maximum stress at failure of the hydrided material, brittle macroscopically, decreases with increasing the hydrogen content within the 2000-3000 wt.ppm range (Fig. 17(b)). Stress at failure is about 300 MPa in the more brittle case tested (sample with 3210 wt.ppm of hydrogen tested at room temperature).
25
(a) (b)
FIG. 15—Examples of engineering stress-strain (deduced from cross-head displacement) curves obtained (a) at 135
and 350°C and (b) at 500 and 700°C for model (prior-) βZr materials, non-hydrided or containing between 1710 and 3220 wt.ppm of hydrogen (and at least 0.2 wt.% of oxygen).
The effect of hydrogen on macroscopic ductility diminishes when the temperature increases (Fig. 16). It becomes negligible beyond 500°C. The cross-sectional reduction at failure is nearly 100% at 580 and 700°C even for the highest hydrogen contents investigated. Thus, according to these results, the macroscopic failure mode of the model (prior-) βZr material undergoes a
ductile-to-brittle transition as the hydrogen content is increased and the temperature is decreased. This is illustrated in Fig. 18 where the material is considered to be brittle, nearly brittle and ductile when the plastic strain at failure is lower than 0.005, between 0.005 and 0.01 and higher than 0.01, respectively. This figure also includes data from the literature (their characteristics are given in Table 4). Results reported by Stuckert et al. [62] and Pshenichnikov et al. [38] suggest that the prior-βZr material is ductile at room temperature even for hydrogen contents as high as
3000 wt.ppm. This difference compared to the present results or to those published by
Brachet et al. [3], which showed that the prior-βZr material with about 600 wt.ppm of hydrogen is
almost brittle at room temperature, may be at least partly due to a difference in the cooling scenario: cooling down from 800-927°C in air at room temperature with an initial rate of about 5°C/s for Stuckert et al. [62] and Pshenichnikov et al. [38], cooling rate varying between about 5 and 1°C/s from 1200°C down to 500°C and slower below in the present case, direct water quenching from 1000°C for Brachet et al. [3]. Indeed, it has been shown for Zircaloy-4 pre-hydrided at about 600 wt.ppm and oxidized at 1200°C that the post-quench hardening and macroscopic ductility at room temperature strongly depend on the partitioning of oxygen and hydrogen that occurs upon cooling during the βZr to αZr allotropic phase transformation and are
directly related to the cooling rate during this transformation [64]. Typically, an increase in cooling rate during the βZr to αZr phase transformation induces an increase in the resultant
prior-βZr hardening and an associated decrease in macroscopic ductility. Furthermore, the differences
between the present results and those reported in [38] and [62] may be attributed to the slightly higher oxygen content of the materials tested here due to oxygen absorption and diffusion during hydrogen-charging and heat-treatment in the βZr temperature domain before tensile testing.