HAL Id: halshs-00748615
https://halshs.archives-ouvertes.fr/halshs-00748615
Submitted on 5 Nov 2012
HAL is a multi-disciplinary open access
archive for the deposit and dissemination of
sci-entific research documents, whether they are
pub-lished or not. The documents may come from
teaching and research institutions in France or
abroad, or from public or private research centers.
L’archive ouverte pluridisciplinaire HAL, est
destinée au dépôt et à la diffusion de documents
scientifiques de niveau recherche, publiés ou non,
émanant des établissements d’enseignement et de
recherche français ou étrangers, des laboratoires
publics ou privés.
Social preferences in the online laboratory : A
randomized experiment
Jérôme Hergueux, Nicolas Jacquemet
To cite this version:
Jérôme Hergueux, Nicolas Jacquemet. Social preferences in the online laboratory : A randomized
experiment. 2012. �halshs-00748615�
Documents de Travail du
Centre d’Economie de la Sorbonne
Social preferences in the online laboratory :
A randomized experiment
Jérôme H
ERGUEUX,Nicolas J
ACQUEMETSocial preferences in the online laboratory
A randomized experiment
*Jérôme Hergueux
‡Nicolas Jacquemet
§September 2012
Abstract
Internet is a very attractive technology for experiments implementation, both in order to reach more diverse and larger samples and as a field of economic research in its own right. This paper reports on an experiment performed both online and in the laboratory, designed so as to strengthen the internal validity of decisions elicited over the Internet. We use the same subject pool, the same monetary stakes and the same decision interface, and randomly assign two groups of subjects between the Internet and a traditional University laboratory to compare behavior in a set of social preferences games. This comparison concludes in favor of the reliability of behaviors elicited through the Internet. Our behavioral results contradict the predictions of social distance theory, as we find that subjects allocated to the Internet treatment behave as if they were more altruistic, more trusting, more trustworthy and less risk averse than laboratory subjects. Those findings have practical importance for the growing community of researchers interested in using the Internet as a vehicle for social experiments and bear interesting methodological lessons for social scientists interested in using experiments to research the Internet as a field.
JEL classification: C90, C93, C70
Keywords: Social Experiment, Field Experiment, Internet, Methodology, Randomized Assignment
* We gratefully acknowledge financial support from the European Research Council (ERC Starting Grant) and the Institut
Universitaire de France. We are grateful to Anne l’Hôte and Andrews-Junior Kimbembe for their outsdanding research assistance as
well as Maxim Frolov, Joyce Sultan and Ivan Ouss for helping running the laboratory experimental sessions. We thank Yann Algan, Guillaume Fréchette, Paul Pézanis-Christou, Ken Boum My, David Rand, Alvin Roth, Laurent Weill and the Cooperation Group and seminar participants at the Berkman Center for Internet & Society at Harvard University for helpful comments.
‡ Corresponding author. University of Strasbourg, LaRGE and Sciences Po, Department of Economics. Research fellow, Berkman
Center for Internet & Society at Harvard University. 23 Everett Street, 2nd floor, Cambridge, MA, 02138, USA. e-mail:
§ Paris School of Economics and University Paris I Panthéon-Sorbonne. Centre d'Economie de la Sorbonne, 106 Bd. de l'Hopital,
Social preferences in the online laboratory
A randomized experiment
*Jérôme Hergueux
Nicolas Jacquemet
September 2012
Abstract
Internet is a very attractive technology for experiments implementation, both in order to reach more diverse and larger samples and as a field of economic research in its own right. This paper reports on an experiment performed both online and in the laboratory, designed so as to strengthen the internal validity of decisions elicited over the Internet. We use the same subject pool, the same monetary stakes and the same decision interface, and randomly assign two groups of subjects between the Internet and a traditional University laboratory to compare behavior in a set of social preferences games. This comparison concludes in favor of the reliability of behaviors elicited through the Internet. Our behavioral results contradict the predictions of social distance theory, as we find that subjects allocated to the Internet treatment behave as if they were more altruistic, more trusting, more trustworthy and less risk averse than laboratory subjects. Those findings have practical importance for the growing community of researchers interested in using the Internet as a vehicle for social experiments and bear interesting methodological lessons for social scientists interested in using experiments to research the Internet as a field.
JEL classification: C90, C93, C70
Keywords: Social Experiment, Field Experiment, Internet, Methodology, Randomized Assignment.
Résumé
L’internet constitue un terrain très attractif d’un point de vue expérimentale, à la fois comme moyen d’obtenir des échantillons plus larges et plus diversifiés, et comme champ de recherche à part entière en raison de son rôle croissant dans la sphère économique. Cet article traite d’une expérience réalisée à la fois par internet et en laboratoire, conçue pour renforcer la validité interne des décisions observées en ligne. Les deux traitements présentent la même base d’échantillonnage, les mêmes schémas de rémunération, et la même interface de décision. Nous avons cherché à comparer les comportements dans un ensemble de jeux de préférence sociale, les participants étant répartis de manière aléatoire entre jeu en ligne et jeu en laboratoire. Cette comparaison tend à confirmer la fiabilité des décisions observées en ligne. Nos résultats sont également contraires aux prédictions de la théorie de la distance sociale : les participants alloués au traitement par internet ont tendance à être plus altruistes, plus confiants et plus dignes de confiance, et enfin moins risquophobes que les joueurs en laboratoire.
Mots-clés : Méthode expérimentale, Expériences de terrain, Expériences en laboratoire, Internet, allocation aléatoire.
1 Introduction
In the field of experimental economics, it has been a long time since researchers have called upon the development of the “online laboratory” (Bainbridge 2007). The interest in online experimentation has been propelled by the possibility to reach more diverse samples, recruit larger subject pools and even conduct cross-cultural social experiments in real time at an affordable cost.1 Besides this
methodological concern, the Internet increasingly becomes a prominent experimental field for social science research in its own right (see, e.g., Resnick et al. 2006; Chesney et al. 2009), as we live more and more of our social and economic lives online. It is thus key to conduct experiments directly over the Internet if we are to rely on the experimental method to understand the various types of social and economic activities that people engage in online.
Notwithstanding these appealing features, the development of the “online laboratory” still remains in its infancy. The primary goal of this paper is to contribute to filling this gap by conducting a methodological evaluation of an Internet-based experimentation procedure. Horton et al. (2011) underline the difficulty to come-up with procedures for online experiments that would ensure their internal validity, i.e. the possibility to confidently draw causal inferences from one’s experimental design. A number of confounding factors have been identified that have probably prevented researchers from running experiments online: (i) it is difficult to monitor the identity of subjects participating in the experiment (ii) subjects may not seriously read the experimental instructions and/or make decisions too quickly and/or get significantly distracted during the course of the experiment (iii) subjects may selectively drop-out of the experiment in ways that the experimenter does not understand (iv) subjects may not believe that they interact with other human players and/or not believe that they are going to be paid as described in the instructions at the end of the experiment and finally (v) the issue of reliably and automatically processing the payment of subjects over the Internet in an anonymous fashion appeared as a major blocker.
In this paper, we seek to compare the behavioral results generated both in a traditional laboratory and over the Internet. To do so, we develop an online platform specifically dedicated to conducting social experiments over the Internet that is usable as it is in the laboratory. To control for self-selection into the kind of implementation, we randomize subjects between treatments. The platform is also endowed with controls over many of the above mentioned confounding factors. In particular we (i) control for differences in response times (ii) try to cope with the issues of selective attrition, concentration and distraction and (iii) provide as much control as possible over subjects’ beliefs as regards the experimental instructions. From a methodological perspective, our main conclusion is that nothing in the behaviors elicited online challenges the internal validity of the experiment as compared to in the laboratory ones.
1 In a recent paper, Henrich et al. (2010) warn against behavioral scientists’ current over-reliance on data overwhelmingly
gathered from populations of western undergraduates students and recommend a major effort in broadening the sample base. The Internet appears as one promising medium for conducting experiments with large and diverse samples. It is now possible to reach 78.3% of the North American population through the Internet, and while only 11.4% of the African population can currently be reached through this method, the exponential growth of its user base (from 4 million users in 2000 to 118 million users in 2011) could soon make it an attractive tool for conducting experiments also in the developing world (source:www.Internetworldstats.com).
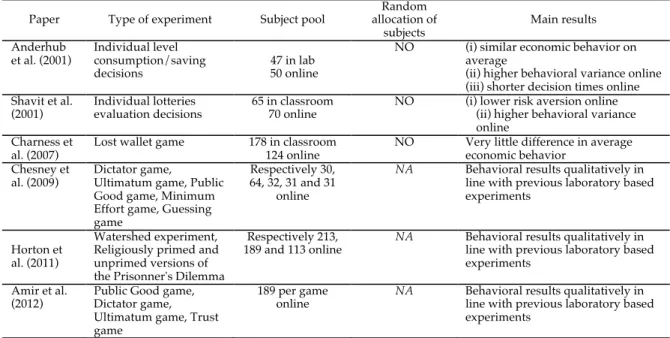
The existing literature has already covered a variety of different games implemented over the Internet (Table 1 summarizes the methodology and main conclusions of this literature). The seminal study of Anderhub et al. (2001) focuses on an individual level decision experiment under uncertainty, both in the laboratory and online. Shavit et al. (2001) compare student bids over buying prices for simple lotteries both in the classroom and online. Charness et al. (2007) also compare classroom experiments to other Internet based experimental settings to investigate the effect of social distance on reciprocity in a simple lost wallet game. Chesney et al. (2009) take an exploratory approach and build a virtual laboratory on the Second Life website. They recruit subjects from the Second Life community to perform a series of social experiments and compare the results to those generally obtained in traditional laboratory settings. Most recently, Horton et al. (2011) and Amir et al. (2012) have used the online labor market platform Amazon Mechanical Turk to conduct a set of classic experiments and replicate qualitatively some general results drawn from the experimental economics literature.
We contribute to this burgeoning literature by looking at social preferences and by providing a rigorous comparison of the Internet-based experimentation with traditional lab experiments. We apply our methodology to the measurement of social preferences – combined with a risk aversion task – through: a Public Good game, a Trust game, a Dictator game and an Ultimatum game (implemented using a within subjects design). Our empirical results contradict the predictions of social distance theory (Akerlof 1997), according to which the stronger anonymity that prevails in Internet-based interactions should drive social preferences down as compared to the laboratory setting, where people can (i) see each other before and after the experiment (ii) recognize that they often come from the same socio-economic background and (iii) know that they are going to be matched with one-another during the experiment.
On the contrary, we find robust evidence that subjects allocated to the Internet treatment behave as if they were more altruistic, more trusting, more trustworthy and less risk averse than subjects allocated to the laboratory. We suggest an explanation for our results grounded in the nature of the social and economic interactions in which individuals tend to engage online, which they are likely to
Table 1. Inlab versus online based experiment: overview of experimental results
Paper Type of experiment Subject pool allocation of Random
subjects Main results
Anderhub et al. (2001)
Individual level consumption/saving
decisions 50 online 47 in lab
NO (i) similar economic behavior on
average
(ii) higher behavioral variance online (iii) shorter decision times online Shavit et al.
(2001) Individual lotteries evaluation decisions 65 in classroom 70 online NO (i) lower risk aversion online (ii) higher behavioral variance
online Charness et
al. (2007) Lost wallet game 178 in classroom 124 online NO Very little difference in average economic behavior
Chesney et al. (2009)
Dictator game,
Ultimatum game, Public Good game, Minimum Effort game, Guessing game
Respectively 30, 64, 32, 31 and 31
online
NA Behavioral results qualitatively in
line with previous laboratory based experiments
Horton et al. (2011)
Watershed experiment, Religiously primed and unprimed versions of the Prisonner's Dilemma
Respectively 213,
189 and 113 online NA Behavioral results qualitatively in line with previous laboratory based
experiments Amir et al.
(2012) Public Good game, Dictator game,
Ultimatum game, Trust game
189 per game
online NA Behavioral results qualitatively in line with previous laboratory based
bring to the experiment through its contextual implementation. Our results are important to the community of researchers willing to develop the online laboratory as a medium to run social experiments over the Internet and relate their results to the established laboratory literature. They are also important for social scientists willing to use social experiments in order to research the Internet as a field: given the effect that the Internet context had on decision making in our experiment, it makes sense for researchers to bring their experimental tools directly on the field, i.e. over the Internet, if they want to learn from subjects’ behavior in this context, rather than sticking to the most difficult approach of trying to bring a subsample of those subjects into a traditional University laboratory.
The rest of the paper proceeds as follows. Section 2 documents the design of the experiment, reports on the development of our online experimental economics platform and explains our experimental procedures. Section 3 reports the results of the experiment. Section 4 discusses the empirical results and section 5 concludes.
2 Design of the experiment
Social isolation and greater anonymity are well-recognized distinctive features of online interactions. In order to provide a rather conservative testbed comparison between online and lab experiments, we focus on the elicitation of social preferences. Shavit et al. (2001) have also shown that subjects tend to be less risk averse when making decisions online rather than in a classroom. We thus complement our preferences measures with a risk aversion task. Our main methodological contribution is to build an Internet-based experimental environment which can be implemented both online and in the laboratory. We conclude this section with a detailed description of the procedures and decision interface we used.
2. 1 The decision problems
At the beginning of the experiment, each subject is attributed a role: either participant A or participant B. The assigned role remains the same during the whole experiment. The experiment is split in two different parts. First, we elicit decisions in five different games. The first four games are taken from the social preferences literature (see, e.g., Fehr & Camerer 2004) while the last one elicits individual risk-aversion. In the second part of the experiment, subjects are asked to answer some standard demographic and social preferences related questions, along with some questions eliciting their beliefs about the study.
Public Good Game. Subjects play in groups of four with an initial endowment of 10! per player. Each
euro invested in the common project by a member of the group yields a return of 0.4 euro to each group member. Following Fischbacher et al. (2001), we elicit both unconditional and conditional contributions, asking subjects to make two contribution decisions in turn. They first decide on how much of their 10! they want to invest in the common project. They then provide their intended contribution for each possible value (on the scale of integers from 0 to 10) of the average contribution
of the three other members.2 One of the two decisions is randomly drawn to be binding and
determines the individual earnings for this game according to the following payoff function:
!i = 10 " contribi + 0,4
#
j = 1
4
contribj (1)
Dictator Game. Each participant A is matched with a participant B to play as a dictator. The dictator
receives a 10! endowment, of which he must decide on how much is transferred to participant B. The difference is participant A’s earning for this game.
Ultimatum Bargaining Game. Each participant A is matched with a participant B. Participant A is the
proposer and must decide on how much of an initial endowment of 10! is transferred to participant B – the responder. The responder is simultaneously asked for the threshold level of transfer below which the offer will be refused. The earnings of each player in this game are computed according to the proposal if participant A’s transfer is higher or equal to the threshold. Otherwise, both players’ earnings are set equal to 0.
Trust Game. Each participant A is matched with a participant B, and both players receive a 10! initial
endowment. Participant A is the trustor and chooses how much of his endowment is transferred to participant B – the trustee. The trustee receives three times the amount sent by the trustor, and chooses how much is sent back to him. We elicit this decision through the strategy method: for each possible transfer from the trustor (from 1 to 10) the trustee chooses how much will be returned without knowing the trustor’s actual choice.
Risk aversion elicitation. Each participant faces a menu of ten choices between lottery pairs, adapted
from Holt & Laury (2002). The probability of getting the higher amount is always the same between the two lottery pairs, but the safe option pays either 20! or 16! while the risky option pays either 38.5! or 1!. The probability that subjects get the higher amount in both options steadily increases from 10% in the first decision problem to 100% in the last one. Thus, in decision 10, subjects actually choose to earn either 20! or 38.5! with certainty. One of the ten decisions is randomly drawn to determine the binding lottery choice. Earnings for this game are then derived from a random draw according to the probability of the corresponding lottery.
Social values survey. After all games have been played, subjects are asked to fill-in a questionnaire with
some standard demographic questions followed by social preferences related questions. This set of items has been taken from the World Value Survey (WVS), the General Social Survey (GSS) and the
German Socio-Economic Panel (GSEP) – the three most commonly used sources in the empirical
literature. Specifically, we ask subjects:
(i) to what extent they consider it justifiable to free-ride on public social allowances (cooperation
variable; WVS question);
(ii) whether they think that people are mostly looking out for themselves as opposed to trying to
help each other (altruism variable; WVS question);
2 Implementing the so-called “strategy method” as a second contribution decision allows to investigate the extent to which
(iii) whether they think that people would try to take advantage of them if they got a chance as
opposed to trying to be fair (fairness variable; WVS question);
(vi) whether they think that most people can be trusted or that one needs to be very careful when
dealing with people (trust variable; WVS and GSS question);
(v) how much trusting they generally are of people (trust variable; GSEP question); (vi) how much trusting they are of people they just met (trust variable; GSEP question);
(vii) whether they generally see themselves as fully prepared to take risks as opposed to
generally trying to avoid taking risks (a question taken from Dohmen et al. 2011). All questions are mandatory and none is remunerated.
Debriefing questionnaire. As demonstrated by Eckel and Wilson (2006), the internal validity of online
experiments can be challenged by subjects’ skepticism over the fact that they actually interact with other human subjects, and that they will be paid according to the rules described in the instructions. To get some control over these dimensions, we ask subjects to rate their level of confidence in those two critical features of the study. As a complement, we end the survey by asking subjects to report on how carefully they read the experimental instructions, on how calm their environment was when they performed the experiment and on whether they participated in a similar study in the past.
2. 2 Common procedures to both implementations
All five games, followed by the survey, are played successively in each experimental session. As we seek to elicit social preferences in isolation from learning effects and strategic concerns, each game is only played once. To neutralize reputation effects, we match subjects in each game according to a perfect stranger procedure. Last, in order to further break any possible correlation between games, only one game out of the whole session is randomly drawn as binding to compute each subject’s earnings. Final payoffs equal the earnings from the corresponding decision plus a 5! show-up fee. Subjects are only informed of their earnings in each game at the very end of the experiment.
As all games are played one after the other, order effects could influence the preferences we elicit. This led us to implement three different orderings. The public good game is the most cognitively demanding, so that we start all sessions with this game. The Dictator, the Ultimatum and the Trust games all appear afterwards in varying orders. As we mainly use the risk aversion task for purposes of replication and as a control variable, we maintain this decision problem as the last one in all sequences:
• Order 1: Public Good – Dictator – Ultimatum – Trust – Risk Aversion • Order 2: Public Good – Trust – Ultimatum – Dictator – Risk Aversion • Order 3: Public Good – Ultimatum – Dictator – Trust – Risk Aversion
Subjects face the exact same decision interface both in the lab and online. The online implementation of the experiment requires a fully self-contained interface, so that every communication between the subjects and the experimenter has to proceed through the screen.3 The
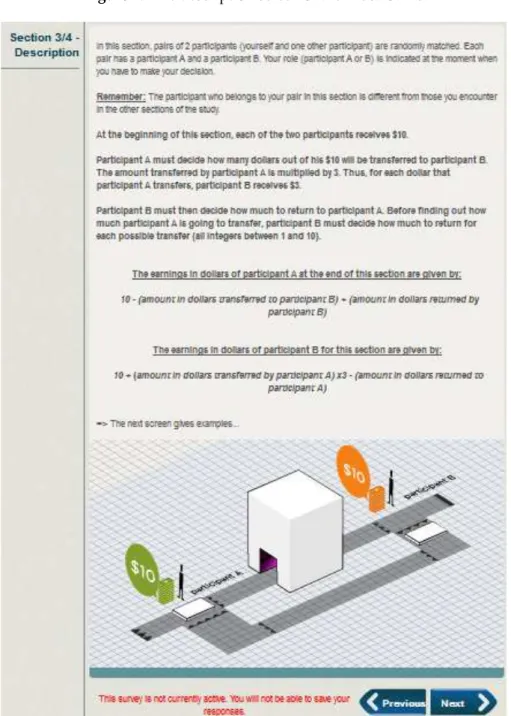
first screen of the decision interface provides subjects with general information about the experiment, including the number of sections and how their earnings will be computed. Each game is then performed in turn, following a given sequence of screens. The first screen of each section describes the instructions for the game that subjects are about to play (Figure 1 provides an English translation of the original instructions in French for the Trust game).
3 The interface has been developed under Lime Survey (http://www.limesurvey.org/) a highly customizable open-source
survey tool.
Figure 1. The description screen of the Trust Game
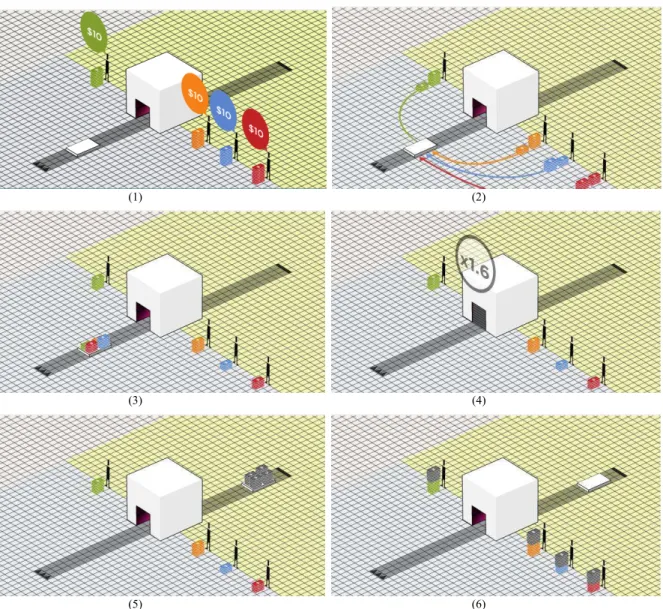
One important methodological concern with online experiments is to guarantee an appropriate understanding of the decision problems when no interaction with the experimenter is possible, which makes it difficult, for instance, to rely on the standard post-instructions questionnaire coupled with oral questions. We address this issue through several distinctive features of the interface. First, we include suggestive flash animations illustrating the written experimental instructions at the bottom of each instruction screen (the animation appears at the bottom of the first screen, as shown in Figure 1; the animation is illustrated in Figure 2 by step-by-step screen captures). Displaying a purely random sequence of flash animations would introduce uncontrolled and subject specific noise–through, e.g., anchoring on a particular behavior or sequence of events. The loop of concrete examples displayed in the animations is thus first randomly determined and then fixed for each game. The same loop is displayed to all subjects without any other numeric information than the subjects’ initial endowments.4
4 Our goal here was to illustrate the basic gist of each decision problem in an accessible way while avoiding to prime specific
numerical examples and results in subjects’ mind.
Figure 2. Flash animation for the Public Good game
(1) (2)
(3) (4)
Second, the instructions screens are followed by a screen providing some examples of decisions, along with the detailed calculation of the resulting payoffs for each player. These examples are supplemented on the subsequent screen by earnings calculators. On this interactive page, subjects are allowed to test all the hypothetical scenarios they are interested in before making their decisions in the Public Good and Trust games (English translations of the original earnings calculators in French are provided in Figure 4, (a) for the public good game and (b) for the trust game). In contrast to the flash animations, the numeric results of each scenario run by a subject in the earnings calculator screens are explicitly displayed.
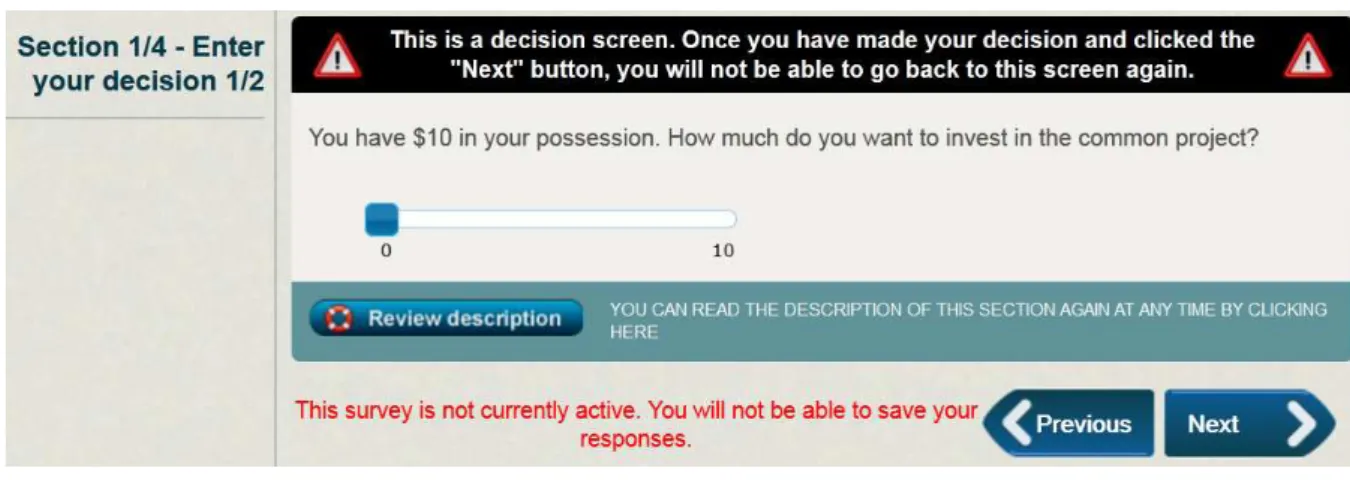
Last, the system provides a quick access to the instructions material at any moment during decision-making. On all screens, including decision-making ones, a “review description” button gives subjects a direct access to the instructions displayed at the beginning of the game. The system also allows participants to navigate at will from one screen to another – until a decision screen has been passed – through the “Previous” and “Next” buttons located at the bottom of each screen (Figure 4 provides an English translation of the original decision screen in French for the public good game).
A well-known concern when comparing laboratory and online experiments is the variation in decision times. Anderhub et al. (2001), for instance, report much shorter decision times online. An established body of research in psychology moreover indicates that shorter decision times are likely to be associated with instinctive and emotional reasoning processes rather than cognitive and rational ones (Kahneman 2003). As a result, reduced decision times online could induce online subjects into behaving more pro-socially on average and/or into making relatively more “accessible” decisions (such as e.g., equal split; see Rubinstein, 2007). In order to generate a control variable for this dimension, the platform recorded detailed data on the time in seconds that subjects spent on each screen of the interface (this timer was not visible to the subjects). But more time on a screen does not necessarily mean longer decision time if, for instance, online subjects go away from their computer while answering the survey. To get further information about whether some subjects were likely to
Figure 3. Earnings calculators
have been distracted from the online experiment at some point, we included an indicator of mouse inactivity in the platform. The indicator records both the screen and the inactivity length each time the mouse of the subject is left inactive for more than 5 minutes.5
2. 3 Practical implementation of the experiment
All participants to the experiment were contacted through the subjects database of the experimental economics laboratory of University Paris 1 Panthéon-Sorbonne.6 The allocation to sessions seeks to
minimize differences in the subject pools and avoid self-selection into treatments. We proceed in two steps. First, subjects are offered to register for a date at which a session takes place. They are told that practical details about the experiment will follow once their registration is confirmed (as usual, registrations are confirmed on a first-in first-served basis). Indeed, two sessions are scheduled during each time slot: one session online and one session in the laboratory. In the second step, we sequentially allocate subjects either to the laboratory or to the online experimentation according to their registration order. As the capacity of the laboratory allows for no more than 20 subjects, we allowed 56 persons to register for each time slot, allocating half of them to the laboratory and the other half to the Internet session. In the laboratory, we had to decline participation to any overbooked subjects who showed-up on time. Since no such constraint applied to the online experiment, we allowed all subjects to participate while keeping track of those who logged-in after the target number of 20 participants had been reached.
In laboratory sessions, subjects are randomly assigned to a computer upon arrival. The instructions for the experiment are read aloud, and subjects are then left to use all devices at their disposal to check their own understanding (access to the text, earnings calculators, etc.). Each game is described one after the other, following the above-described interface, so that all subjects progress inside the experiment all together.
Online subjects are invited to visit the url embedded in their confirmation e-mail at the time their session is scheduled, and to log into the system using their e-mail addresses, which served as a
5 The system considered the mouse inactive when it was moving over screens not belonging to the experimental economics’
platform.
6 The database is managed using Orsee (Greiner 2004).
unique login token. The url was activated during the half-day spanning the time scheduled for the experiment. The computer program allocates online subjects to either participant A or participant B according to their login order (in order to ensure that we get a somewhat equal split of the subject pool between participant As and participant Bs, despite possible drops out).
At the end of the experiment, subjects are matched using a perfect stranger procedure. Subjects are informed of their earnings in each game only at the end of the experiment. In the laboratory, subjects from a given session are matched together. By contrast, online subjects had their decisions matched with the decisions record of subjects who already completed the experiment.7 This feature of the
platform allowed Internet subjects to perform the experiment independently and at their own pace, thus smoothing the interactions and arguably reducing drop-outs.8 Laboratory subjects' earnings are
paid in cash, before subjects leave the laboratory. Internet subjects get paid through an automated PayPal transfer. This guarantees a fungibility similar to that of cash transfers, as money transferred via PayPal can be readily used for online purchases or easily transferred to one’s personal bank account at no cost. To strengthen the credibility of the payment procedure, we ask subjects to enter the e-mail address that is (or will be) associated with their PayPal account right after the introductory screen of the decision interface.
We conducted two different sets of experimental sessions, each conducted over a one week period: 6 sessions (3 in the lab, 3 online) were conducted in November 2010 and 12 sessions (6 in the lab, 6 online) were conducted in November 2011.9 Overall, 180 subjects performed the experiment in the
laboratory and 202 subjects performed it online. We conducted 8 sessions with games order 1 (80 participants in the lab, 85 online), 6 sessions with games order 2 (60 and 67) and 4 sessions with games order 3 (40 and 50). Subjects in both conditions earned on average 21.24! from the experiment.
3. Results
We begin this section by an evaluation of our randomization procedure. We then turn to a comparison of behavior between the laboratory and the Internet conditions by computing some key descriptive statistics. We finally check for the robustness of our results with a thorough regression analysis.
3. 1. Validity of the randomization procedure
We evaluate the validity of our randomization procedure by comparing our laboratory and Internet subjects pools along three main dimensions: (i) their demographic characteristics (ii) their beliefs and (iii) their self-reported social preferences.
7
Since we apply a sequential matching rule for online subjects, the queue has to be initialized somewhere. We used data from 3 pilot sessions in the laboratory, ran during the summer 2010 in preparation to the current study.
8 Overall, 208 subjects logged in the platform to participate in the online experiment among which 6 dropped out before
completion
9 The 2010 version of the experimental economics platform did not elicit subjects’ level of confidence in the experimental
instructions, neither did it collect detailed data on the time spent by subjects on each screen of the interface. After observing that overall response times indeed significantly differed in both treatments, we decided to include those features before conducting further sessions.
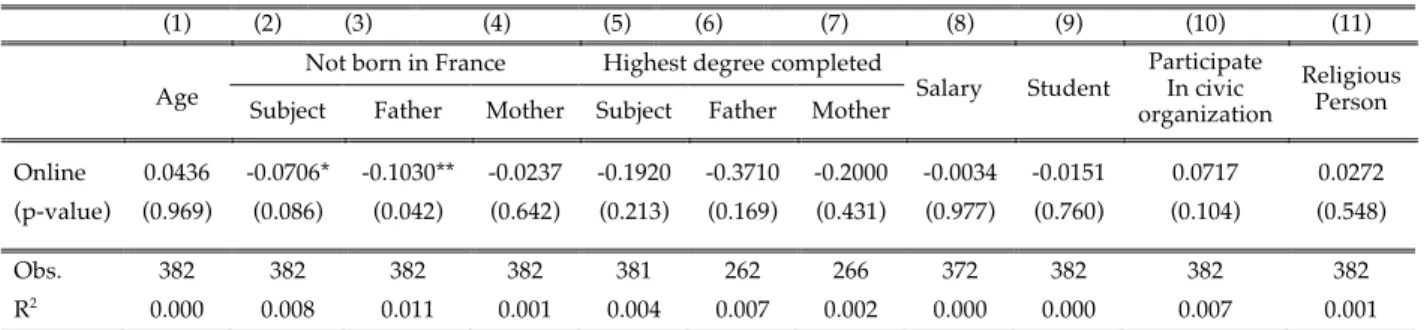
Table 2.1 indicates that out of the 11 demographic characteristics that we put to test, the randomization procedure failed on one: there seem to be 7% more subjects in the laboratory sample who were not born in France.10 There are no significant differences between samples in subjects’ age,
mother birth location, degree level, degree level of parents, salary, student status, participation in civic organizations and religiosity. If we turn our attention to table 2.2, we see that laboratory and Internet subjects report similar levels of confidence in the fact that they interact with real human partners during the experiment and will be paid as described in the instructions at the end of the experiment. We interpret these results as supportive of the internal validity of our online experimentation procedure. There are also no significant differences in how carefully subjects report that they have read the experimental instructions and in the proportion of subjects who loosely report to have participated in a similar study in the past. The only significant difference that arises from this table is on how calm subjects report their environment was when they performed the study (-0.15 for Internet subjects on a 4 points scale).
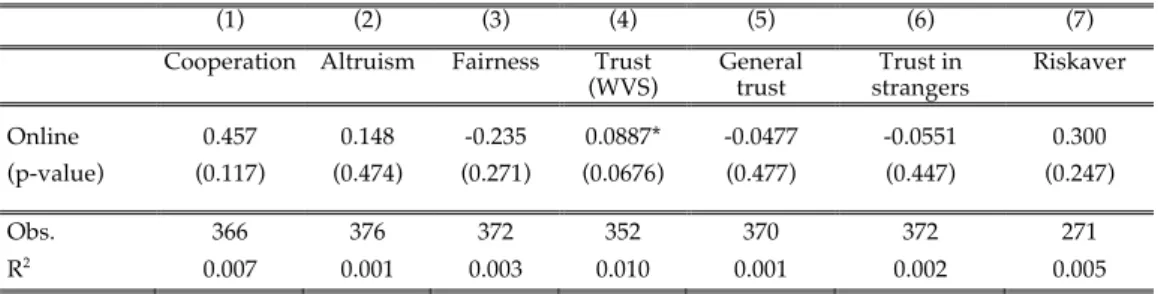
As this paper is mainly concerned with evaluating the consistency of web-based social preferences experiments as compared to the traditional laboratory setting, it also makes sense to compare both subject pools on self-reported measures of social preferences. To do so, the final questionnaire asked subjects to answer a set of traditional survey questions about social preferences.
10 The table actually reports two statistically significant coefficients: one associated with the fact of not being born in France, the
other associated with the fact of having one’s father not being born in France. It turns out that those two variables are heavily related in the sample (corr=0.51; p<0.001).
Table 2.1 Demographic characteristics between treatments
(1) (2) (3) (4) (5) (6) (7) (8) (9) (10) (11)
Not born in France Highest degree completed
Age Subject Father Mother Subject Father Mother Salary Student
Participate In civic organization Religious Person Online 0.0436 -0.0706* -0.1030** -0.0237 -0.1920 -0.3710 -0.2000 -0.0034 -0.0151 0.0717 0.0272 (p-value) (0.969) (0.086) (0.042) (0.642) (0.213) (0.169) (0.431) (0.977) (0.760) (0.104) (0.548) Obs. 382 382 382 382 381 262 266 372 382 382 382 R2 0.000 0.008 0.011 0.001 0.004 0.007 0.002 0.000 0.000 0.007 0.001
Note: OLS estimates with baseline=Inlab. p-values are reported in parenthesis. *, ** and *** denote statistical significance at the 10, 5
and 1% levels. Constants not reported.
Table 2.2 Beliefs between treatments
(1) (2) (3) (4) (5) Believes others are human subjects Believes final payment will be proceeded
Has read the instructions carefully The environment was calm Has already participated in similar study Online 0.0655 -0.0408 -0.0198 -0.1510** -0.0107 (p-value) (0.579) (0.662) (0.788) (0.021) (0.832) Obs. 265 271 382 382 382 R2 0.001 0.001 0.000 0.014 0.000
Note: OLS estimates with baseline=Inlab. p-values are reported in parenthesis. *, ** and *** denote statistical significance at the
The result of the comparison between subject pools is reported in table 2.3. We can see that no statistically significant differences arise between laboratory and Internet subjects in self-reported social preferences, except for the WVS and GSS trust question, in which roughly 9% more subjects report that “most people can be trusted” in the Internet sample (p<0.10).
Overall, we interpret our results as being supportive of the validity of our randomization procedure. Statistically significant differences do arise between the laboratory and Internet subject pools on the proportion of them who were not born in France and on how calm they report their environment was when they performed the experiment. We will thus have to control for these two variables when comparing the behavioral measures of social preferences that we obtained in the laboratory and online in order to ensure that they do not drive the results. As a first approximation however, it remains interesting to observe that almost no difference arise between treatments as far as self-reported measures of social preferences are concerned.
3. 2 Descriptive statistics
Table 3 provides a basic comparison of the behavior of our subjects in the laboratory and Internet treatments. A very striking picture emerges: measures of social preferences are all consistently higher in the Internet sample, with the effect being statistically significant in 9 out of 11 measures. The most economically and statistically significant differences in behavior emerge in the Dictator game and the Trust game. Subjects assigned to the Internet treatment consistently behave as if they were more altruistic, more trusting and more trustworthy. On average, participant As in the Dictator game transferred 17% more of their endowment to participant Bs. In the Trust game, they transferred about 9% more of their endowment, with this increase in trust being reciprocated in kind by participant Bs, who exhibited a reaction function to their transfers about 0.44 point steeper than laboratory subjects. To a somewhat lesser extent, Internet subjects also behaved as if they held more stringent norms of fairness and were more prone to conditional cooperation, especially at relatively high levels of contributions by the other group members.
Table 2.3 Self-reported social preferences between treatments
(1) (2) (3) (4) (5) (6) (7)
Cooperation Altruism Fairness Trust
(WVS) General trust strangers Trust in Riskaver
Online 0.457 0.148 -0.235 0.0887* -0.0477 -0.0551 0.300
(p-value) (0.117) (0.474) (0.271) (0.0676) (0.477) (0.447) (0.247)
Obs. 366 376 372 352 370 372 271
R2 0.007 0.001 0.003 0.010 0.001 0.002 0.005
Note: OLS estimates of column variables on the online dummy (the baseline is inlab subjects, constants are not reported). *, **
and *** denote statistical significance at the 10, 5 and 1% levels. Cooperation = whether subjects consider it justifiable to free-ride on public social allowances; Altruism = whether subjects think that people are mostly looking out for themselves as opposed to trying to help each other; Fairness = whether subjects think that people would try to take advantage of them if they got a chance as opposed to trying to be fair; Trust (WVS) = whether subjects think that most people can be trusted or that one needs to be very careful when dealing with people; General trust = subjects’ level of general trust in people; Trust in strangers = how much trusting subjects are of people they just met; Riskaver = whether subjects generally see themselves as fully prepared to take risks as opposed to generally trying to avoid taking risks.
Figures 5.1 and 5.2 describe the decisions we elicit through the strategic method. Figure 5.1 focuses on the Public Good game and plots the mean of the contributions to the common project made by subjects in the laboratory and Internet conditions, conditional on the average contribution made by the other 3 group members. As this average group contribution increases, the distribution of conditional contributions among Internet subjects tends to dominate the distribution of conditional contributions among laboratory subjects, potentially indicating that online subjects were more prone to conditional cooperation. The overall effect, however, seems to be relatively weak.
Figure 5.2, by contrast, exhibits a much stronger pattern. It plots the mean of the amount returned by participants Bs in the laboratory and Internet conditions depending on the amount transferred by participant A. Consistent with the results from Table 3, the figure shows that the distribution of returns among Internet subjects strictly dominates the distribution of returns among laboratory subjects. One consistent result in the literature about Trust games is that trustors are generally willing to place some of their resources in the hands of trustees. From their side, trustees typically do tend to
Table 3. Descriptive statistics
Number of observations Mean behavior Difference
All Inlab Online All Inlab Online in means
Public Good Game
Contribution 382 180 202 3.77 3.64 3.89 + 0.25
Mean conditional contributions 382 180 202 3.56 3.35 3.74 + 0.39*
Slope against low contributions others 382 180 202 0.55 0.53 0.57 + 0.03
Slope against high contributions others 382 180 202 0.44 0.35 0.51 + 0.16**
Dictator Game
Transfer 192 90 102 2.55 1.62 3.36 + 1.74***
Ultimatum Bargaining Game
Transfer 192 90 102 4.51 4.28 4.72 + 0.44*
Transfer threshold 190 90 100 3.36 3.00 3.69 + 0.69**
Trust Game
Amount sent 192 90 102 4.03 3.54 4.45 + 0.91**
Mean amounts returned 190 90 100 5.13 3.85 6.29 + 2.44***
Slope against low amounts sent 190 90 100 0.90 0.67 1.10 + 0.42***
Slope against high amounts sent 190 90 100 0.94 0.71 1.20 + 0.45***
Holt&Laury lottery choices
Nb of safe choices 382 180 202 6.44 6.76 6.15 - 0.61***
Nb of safe choices w/o inconsistent 316 164 152 6.50 6.80 6.18 - 0.63***
Note: The last column reports two sided t-tests of equality of means (equality of variances not assumed). *, ** and *** denote
statistical significance at the 10, 5 and 1% levels. Public Good game: Contribution = unconditional contribution to the common project; Mean conditional contributions = mean of conditional contributions to the common project; Slope against low contributions
others = slope of the reaction function for average contributions of other group members from 0 to 5; Slope against high contributions others = slope of the reaction function for average contributions of other group members from 6 to 10. Dictator game: Transfer = transfer in the Dictator game. Ultimatum game: Transfer = transfer in the Ultimatum game; Transfer threshold =
minimum acceptable offer in the Ultimatum game. Trust game: Amount sent = amount transferred in the Trust game; Mean
amounts returned = mean of the amounts returned to participant A; Slope against low amounts sent = slope of the reaction
function for amounts transferred by participant A from 1 to 5; Slope against high amounts sent = slope of reaction function for amounts transferred by participant A from 6 to 10. Holt&Laury lottery choices: Nb of safe choices = number of times (out of 10) the subject chose the secure option (i.e. option A); Nb of safe choices w/o inconsistent = number of times (out of 10) the subject chose the secure option (i.e. option A) excluding the sub-sample of inconsistent subjects, i.e. all subjects who either chose the secure option (i.e. option A) in the last decision or switched back from option B to option A at least once.
exhibit positive reciprocity, but the effect is usually not strong enough for this to be profitable to the trustor (Fehr & Camerer 2004). We can see this general pattern in our data, whereby participants Bs do exhibit positive reciprocity, but tend to systematically return a lower amount to participant As than what he transferred in the first place. This result does not hold anymore among Internet subjects, however, in which participants Bs consistently return more on average than what participant A initially transferred.
Figure 5.1 Conditional contributions in the Public Good game
Regarding the risk aversion task, we follow Holt & Laury (2002) in interpreting the number of times subjects went for the secure option as a raw measure of their level of risk aversion. We observe in Table 3 that subjects in the Internet treatment behave as if they were less risk averse, which tends to confirm the preliminary result established by Shavit et al. (2001). Figure 5.3 plots the proportion of subjects in the laboratory and Internet treatments who chose the “risky” option (i.e. option B) in each decision.11 Still consistent with the results from Table 3, we observe that the proportion of subjects
who choose the risky option in each decision in the Internet condition strictly dominates the proportion of subjects who did so in the laboratory, indicating that levels of risk aversion tend to be lower online. Overall, there were 13 inconsistent subjects in the laboratory as opposed to 44 online (two-tailed t-test, p<0.01). There was also a fair proportion of subjects who clearly misunderstood the task and choose option A in the last decision. 5 subjects did so in the laboratory, as opposed to 22 over the Internet (two-tailed t-test, p<0.01). Consistent with previous findings (Anderhub et al. 2001; Shavit et al. 2001), those results indicate that it is somewhat more difficult to obtain good quality data with web-based experiments, which should be compensated for by the ease with which the Internet allows to recruit larger samples. Table 3 provides a statistical comparison of average risk-aversion in both situations. The difference is significant at the 1% level, irrespective of whether we exclude inconsistent subjects from the sample or not.
3. 3 Regression analysis
The evidence discussed in section 3.1 confirms that the laboratory and Internet subject pools did not differ from each other along any observable dimension other than the proportion of them who were
11Note that we constructed this figure excluding from the analysis the 5 laboratory and 22 Internet subjects who arguably
misunderstood the task and choose option A in decision 10. Apart from the last data point, including those subjects has no impact on the figure.
not born in France. In addition, Table 2.2 established that subjects in both treatments did not hold significantly different beliefs as regards the experiment, but did report a difference in how calm their environment was when they performed it. Finally, Shavit et al. (2001) report that participants in an Internet experiment tend to exhibit shorter decision times than classroom participants, which, according to the evidence reported by Rubinstein (2007), could have a sizeable impact on behavior. In this section, we perform a controlled regression analysis in order to see whether any of those 3 potential factors could drive our results.
Table 4 presents evidence regarding average decision times. We observe that Internet subjects indeed spent on average 4 minutes less than laboratory subjects with the experiment, out of an average completion time of 34 minutes (two-tailed t-test, p<0.05). This finding justifies that we include the time spent by subjects with each game up to the moment when they made their decision as a control in our analysis. In addition, we also observe that the variance in the time spent with the experiment is significantly higher online (two-tailed F-test, p<0.01). Notwithstanding this fact, we were surprised that none of our Internet subjects remained inactive for more than 5 minutes at any point when performing the study, which we interpret as good news for its internal validity.12
Table 5 presents the results of our controlled regressions. We observe that the not born in France and calm environment variables have no significant impact on behavior, except for a positive and marginally significant one of the former on the unconditional contribution to the Public Good, and a positive and marginally significant one of the latter on risk aversion. When statistically significant, the coefficients on the standardized game timing variables are generally consistent with the System 1/System 2 hypothesis that shorter decisions times are associated with instinctive and emotional decision processes (Kahneman 2003), which should drive subjects into behaving relatively more pro-socially and/or making more accessible decisions on average (e.g. equal split) (Rubinstein 2007). According to our estimates, a one standard deviation increase in decision time is associated with a decrease of 0.11 points in the slope of the reaction function in the Public Good game (although only for relatively low values of the average contribution of the other group members). It is also associated with an average decrease of 0.46! in the minimum acceptable offer in the Ultimatum game and an average decrease of 0.26 in the level of risk aversion in the Holt & Laury task. The timing coefficients for the Trust game, however, are at odds with the theory: higher decision times are systematically and significantly associated with an increase in reciprocity.
12 Even if online subjects do seem to play faster on average, some of them spent quite a lot of time with the experiment. One
extreme case was a subject who spent more than 3 hours with the experiment without triggering the 5 minutes inactivity indicator a single time.
Table 4. Difference in variance/mean of time spent with the experiment
Number of Observations Mean time Standard Deviation
Inlab Online Inlab Online Diff. Inlab Online Diff.
120 154 35.90 31.98 3.92** 7.77 17.52 - 9.74***
p = 0.014 p < 0.001
Table 5. Regression analysis with timing (game level), not born in France and calm environment controls
(1) (2) (3) (4) (5) (6) (7) (8) (9) (10) (11) (12) (13)
Public Good Dictator Ultimatum Trust Holt&Laury lotteries
Contribution conditional Mean
contributions Slope against low Slope against
high Transfer Transfer
Transfer threshold Amount sent Mean amounts returned Slope against low Slope against high Nb safe choices Nb safe choices w/o inconsistent Online -0.072 -0.047 -0.0731 0.159 1.783*** 0.550* 0.392 1.310** 3.185*** 0.584*** 0.557*** -0.587** -0.584** (0.475) (0.331) (0.085) (0.103) (0.406) (0.330) (0.376) (0.586) (0.782) (0.149) (0.184) (0.237) (0.256)
Not born in France 0.774* 0.490 -0.0095 -0.103 0.859* 0.337 -0.176 0.872 0.031 0.043 -0.079 -0.025 -0.016
(0.460) (0.332) (0.085) (0.103) (0.494) (0.405) (0.506) (0.684) (1.034) (0.197) (0.244) (0.307) (0.339)
Calm environment 0.241 0.127 0.0238 0.046 -0.138 -0.104 -0.084 0.203 0.383 0.071 0.055 0.348* 0.076
(0.293) (0.211) (0.054) (0.066) (0.300) (0.249) (0.327) (0.421) (0.672) (0.128) (0.158) (0.196) (0.226)
Decision times
Public Good Contribution -0.376
(0.233)
Public Good Conditional -0.216 -0.110*** 0.018
(0.162) (0.041) (0.050) Dictator -0.443* (0.225) Ultimatum 0.101 -0.461** (0.163) (0.182) Trust 0.396 0.779** 0.171** 0.146* (0.331) (0.359) (0.068) (0.085)
Holt & Laury -0.153 -0.263**
(0.118) (0.129)
Constant 2.994** 3.058*** 0.582** 0.029 0.171 3.960*** 3.139** 1.245 -0.884 -0.212 -0.057 6.128*** 7.195***
(1.397) (0.995) (0.254) (0.310) (1.340) (1.099) (1.415) (1.876) (2.952) (0.563) (0.696) (0.850) (0.960)
Obs. 274 273 273 273 137 137 137 137 137 137 137 273 220
R2 0.026 0.017 0.030 0.017 0.199 0.030 0.066 0.052 0.122 0.119 0.076 0.049 0.052
Note: OLS estimates with baseline=Inlab. Standard errors are reported in parenthesis. *, ** and *** denote statistical significance at the 10, 5 and 1% levels. Timing variables are standardized.
Public Good Game: Contribution = unconditional contribution to the common project; Mean conditional contributions = mean of conditional contributions to the common project; Slope against low =
slope of the reaction function for average contributions of other group members from 0 to 5; Slope against high = slope of the reaction function for average contributions of other group members from 6 to 10. Dictator game: Transfer = transfer in the Dictator game. Ultimatum game: Transfer = transfer in the Ultimatum game; Transfer threshold = minimum acceptable offer in the Ultimatum game. Trust game: Amount sent = amount transferred in the Trust game; Mean amounts returned = mean of the amounts returned to participant A; Slope against low = slope of the reaction function for amounts transferred by participant A from 1 to 5; Slope against high = slope of the reaction function for amounts transferred by participant A from 6 to 10. Holt&Laury lotteries: Nb safe choices = number of times (out of 10) the subject chose the secure option (i.e. option A); Nb safe choices w/o inconsistent = number of times (out of 10) the subject chose the secure option (i.e. option A) excluding the sub-sample of inconsistent subjects, i.e. all subjects who either chose the secure option (i.e. option A) in the last decision or switched back from option B to option A at least once.
Focusing on our coefficients of interest, we observe that the differences in average behavior between the laboratory and Internet conditions that were somewhat weakly statistically significant in Table 3 turn out to be insignificant in Table 5: there is no difference in average behavior between treatments in the Public Good and Ultimatum games that now reaches the 5% significance level. On the other hand, the coefficients for the Dictator game and the risk aversion task remain stable and highly statistically significant. In the case of the Trust game, the difference between treatments in the average amount transferred by participant As and in the level of reciprocity exhibited by participant Bs even increases.13
In this controlled regression framework, participant As in the Internet condition are found to transfer about 13% more of their endowment to participant Bs, with this trust being reciprocated in kind by participant Bs, who now exhibit a reaction function to their transfers about 0.58 point steeper than laboratory subjects. At the end of the day, the basic message from table 3 remains unchanged, if not strengthened: subjects assigned to the Internet treatment behave as if they were more altruistic, more trusting, more trustworthy and less risk averse, with the effect being both highly statistically and economically significant.14
4 Discussion
Given that the Internet is often viewed as the realm of anonymity (and rightly so), one could have expected the increased social distance between Internet-based subjects to drive measures of social preferences down as compared to the traditional laboratory setting. It is a pretty standard finding in the experimental economics literature that increasing social distance between subjects has a decreasing effect on their revealed social preferences. In a seminal paper, Hoffman et al. (1996) show that subjects tend to decrease the amount of their transfers in the Dictator game when social distance (i.e. isolation) increases. Glaeser et al. (2000) report exactly the same finding as regards the Trust game. They show that measures of trust and trustworthiness tend to increase with the level of demographic similarity between both players.15
So what is the underlying factor driving our results? While our experiment has not been designed to answering this question, a tentative explanation can be found in the nature of many of the social and economic interactions in which individuals tend to engage in online, which they may bring to the experiment through its contextual implementation. Indeed, as the Internet is an environment in which it is difficult to enforce contracts, trust and trustworthiness are likely to be major devices through which to secure online transactions and build a reputation for oneself (Greif 2006). So perhaps the
13 The change in the magnitude of those coefficients is explained by the negative correlation between the Internet treatment and
average decision time, which is found to be positively and significantly associated with our measures of trust and trustworthiness.
14 We also tested for the role of two other underlying factors that could potentially drive our results (tables not reported here
but available from the authors upon request). First we ran the above analysis again after excluding from the Internet sample all subjects who logged-in to the online platform after the target of 20 participants per experimental session had already been reached (so that we obtained a perfectly balanced sample between laboratory based and Internet based subjects). We thus explored the possibility that our findings were driven by those Internet subjects who last logged-in to the experiment in each session. Second, we ran the analysis on social preferences while explicitly controlling for individual levels of risk aversion in the Holt&Laury task. Contrary to Internet-based subjects, laboratory subjects had to incur some physical and monetary costs in order to get to the lab and play. Those costs incurred a priori could have made laboratory subjects relatively more willing to secure their earnings from the experiment, which could be the reason behind the higher levels of risk aversion in decision making that we observed among laboratory subjects. This higher level of risk aversion, in turn, could have induced laboratory subjects into behaving in a more conservative way (i.e. less prosocially) in certain games. In neither case, however, do we find any impact on the magnitude and significance of our estimates.
15
The impact of social distance on social preferences is so uncontroversial to the authors that they conclude: “this result is not surprising, and we consider it to be less important as validation for the theory than as validation for the experiments” (p. 814).
strong anonymity that prevails in Internet-based interactions does not generally come at the expense of social preferences.16 The prominent role of trust and trustworthiness in Internet-based economic
transactions has already been demonstrated in the case of a popular online auction site (Resnick et al. 2006). In a similar fashion, the drastic reduction in communication and coordination costs brought about by the Internet has made it easier for individuals to behave altruistically towards one another, as exemplified by the success of online customer reviews and the exponential growth of the user-generated online encyclopedia Wikipedia (Benkler 2006).
In a recent paper, Hoffman and Morgan (2011) seek to explore the hypothesis that selection pressures that result from high competition, low barriers to entry and exit and agents’ anonymity in online business environments should drive individuals with strong social preferences out of those markets. They have professionals from the Internet domain trading and the online adult entertainment industries perform a series of social preferences experiments and compare the results to those obtained from a population of undergraduate students. Contrary to what they initially expected, they find that Internet business people are significantly more altruistic, more trusting, more trustworthy and less likely to lie. They interpret these findings as providing some support to the idea that social preferences are primed in the Internet environment, in which they help smooth interactions and are thus beneficial in the long run. Again, our study was not designed to test this explanation against any of a possible set of alternative hypothesis. Future studies should dig into the precise nature of this “Internet effect” that we find.
5 Conclusion
The Internet increasingly becomes appealing for experimentalists, both as a medium through which to target larger and more diverse samples with reduced administrative and financial costs, and as a field of social science research in its own right. In this paper, we report on an experiment eliciting social preferences both online and in the laboratory based on the same, original, Internet-based platform. To provide a testbed comparison of social experimentations online, our platform seeks to control for most of the dimensions commonly stressed as possibly challenging their internal validity, including self-sorting, differences in response times, concentration and distraction, or differences in experimental instructions.
From a methodological point of view, our main conclusion is in favor of the internal validity of behaviors elicited online, thanks to the additional controls of our design. In particular, no significant difference between treatments appeared in subjects’ self-reported beliefs over the accuracy of the experimental instructions. In the same vein, we found that none of our online subjects seemed to have been distracted from the experiment for more than 5 minutes (although major distractions can still occur in a shorter time-range) and that a relatively modest number of online subjects (6 out of 208) eventually dropped-out of the experiment before its completion. Internet subjects did play significantly faster on average than laboratory ones, which sometimes had a sizeable impact on behavior. We thus conclude that including controls for this dimension of behavior is of much greater
16 The lack of “institutional” way of securing social and economic interactions over the Internet is often invoked as a reason
why many Internet users who value their anonymity online are nonetheless willing to stick to and invest in a unique online identity or pseudonym.
importance for this kind of experimental data. Last, consistent with Anderhub et al. (2001) and Shavit et al. (2001), we find that it is relatively more difficult to collect good quality data over the Internet, as 22 subjects in the Internet condition failed to select option B in the 10th
decision (in which subjects had the choice between earning 20! or 38.5! with certainty) as compared to 5 in the laboratory. However, it should be possible to compensate for this extra noise in the data by leveraging the Internet to recruit larger samples.
We obtain clearcut conclusions as regards social preferences exhibited online. Compared to subjects allocated to the laboratory condition, subjects in the Internet condition consistently behave as if they were more altruistic, more trusting, more trustworthy and less risk averse. Those results are at odds with what social distance theory and common wisdom would have predicted, given that the Internet is often characterized as an environment where anonymity is most stringent. As the online environment arguably relies more on trust to achieve trade and contract enforcement, our results suggest that such kind of habits may outperform the effect of increased social distance.17
These findings are important to the growing community of researchers interested in taking advantage of the Internet to run large-scale social experiments with diverse samples online and relate their results to the established laboratory literature. These results are also potentially important for social scientists willing to use social experiments in order to research the Internet as a field.
Our study opens several unsolved questions. First, it may be that the difference in average behavior between the laboratory and Internet conditions is in part due to the difference in the method used to process subjects’ final payment (i.e. cash in the laboratory vs. automated PayPal transfers over the Internet). Our goal with this experiment was not to identify the precise features of an online experiment that make its results most likely to differ from those obtained in the laboratory. However, a natural extension of our work could be to test this hypothesis by departing from the established laboratory conventions and also paying the laboratory subjects through an automated PayPal transfer. Second, although our design happens to be enough to guarantee proper inference from observed behavior online, our experiment is unable to sort out the dimensions of the design that are most crucial to achieve such an outcome. Last, our behavioral results are specific to a selected subject pool, as most of our subjects were undergraduate students who volunteered a priori to participate in the experiment. Actual differences in revealed preferences depending on the field of decision elicitation warrant a more systematic investigation, which we leave open for future research.
References
Akerlof, G.A., 1997. Social Distance and Social Decisions. Econometrica, 65(5), pp.1005–1027.
Amir, O., Rand, D.G. & Gal, Y.K., 2012. Economic Games on the Internet: The Effect of $1 Stakes. PLoS
ONE, 7(2), pp.1–4.
Anderhub, V., Müller, R. & Schmidt, C., 2001. Design and evaluation of an economic experiment via the Internet. Journal of Economic Behavior & Organization, 46(2), pp.227–247.
17 Notwithstanding those significant point-estimates differences in average behavior, it is also important to note that
Internet-based experiments do not seem to generate different results than laboratory ones in a qualitative sense (i.e. subjects do exhibit pro-social behavior, regardless of the experimental environment).