HAL Id: tel-02926834
https://tel.archives-ouvertes.fr/tel-02926834
Submitted on 1 Sep 2020HAL is a multi-disciplinary open access archive for the deposit and dissemination of sci-entific research documents, whether they are pub-lished or not. The documents may come from teaching and research institutions in France or abroad, or from public or private research centers.
L’archive ouverte pluridisciplinaire HAL, est destinée au dépôt et à la diffusion de documents scientifiques de niveau recherche, publiés ou non, émanant des établissements d’enseignement et de recherche français ou étrangers, des laboratoires publics ou privés.
Sensitive and mutiplexed microRNA quantification using
amplified time-gated Förster resonance energy transfer
Jingyue Xu
To cite this version:
Jingyue Xu. Sensitive and mutiplexed microRNA quantification using amplified time-gated Förster resonance energy transfer. Optics [physics.optics]. Université Paris-Saclay, 2020. English. �NNT : 2020UPASS137�. �tel-02926834�
Sensitive and Mutiplexed MicroRNA
Quantification Using Amplified
Time-Gated Förster Resonance
Energy Transfer
Thèse de doctorat de l'université Paris-SaclayÉcole doctorale n°575 : electrical, optical, bio : physics and engineering (EOBE)
Spécialité de doctorat: Physique Unité de recherche : Université Paris-Saclay, CEA, CNRS, Institute for Integrative Biology of the Cell (I2BC), 91198, Gif-sur-Yvette, France
Référent : Faculté des sciences d’Orsay
Thèse présentée et soutenue en visioconférence totale, le 23/07/2020, par
Jingyue XU
Composition du Jury
Philippe MINARD
Professeur, Université Paris-Saclay Président
Yolanda VIDA
Professeur, University of Málaga Rapporteur & Examinatrice
Cristian A. STRASSERT
Professeur, University of Münster Rapporteur & Examinateur
Xavier LE GUEVEL
Chargé de recherche, Université Grenoble-Alpes Examinateur
Niko HILDEBRANDT
Professeur, Université Paris-Saclay Directeur de thèse
Thè
se
d
e d
oc
torat
NNT : 202 0U PA SS 137I
Acknowledgment
I would like to express my sincere gratitude to my supervisor Prof. Niko Hildebrandt, the “Captain FRET” of our NanoBioPhotonics group, who offered me the opportunity to join this family and provided me the freedom to explore in the “FRET world”. His continuous scientific tuitions help me a lot when I faced the difficulties in research. But nothing was more grateful than his enthusiasm and perpetual energy, which not only motivated me in my study but also encouraged me a lot in my life. I appreciate all his contributions of time, ideas, and funding to my PhD in the last four years.
My sincere thanks to Prof. Yolanda Vida and Prof. Cristian A. Strassert for being the reviewers of my PhD thesis.
Many thanks to all my former and current members of the NanoBioPhotonics group for the free and happy working atmosphere. Special thanks to Dr. Xue Qiu and Dr. Jiajia Guo for their technical guidance and continuous encouragement; to Dr. Shashi Bhuckory for his translation of my abstract and altruistic helps in my life; to Vjona Cifliku for spending the last period of PhD and tough writing period with me together; to Dr. Monique Chan-Huot and Dr. Thomas Plénat for teaching me French.
I thank China Scholarship Council for the funding and supporting of my PhD fellowship.
I also want to thank my family and dear friends for their love and company. Without them, this work would have never been possible.
Last but not least, my deepest gratitude and respect go to all the medical staff in the world during this COVID-19 health crisis. Life will get better, world will get better.
II
List of publications
Original publications
1. J. Xu, J. Guo, N. Golob-Schwarzl, J. Haybaeck, X. Qiu, and N. Hildebrandt. Single-measurement multiplexed quantification of microRNAs from human tissue using catalytic hairpin assembly and Förster resonance energy transfer. ACS Sensors 2020, 5, 1768–1776.
2. J. Xu, L. Francés-Soriano, J. Guo, T. Hallaj, X. Qiu, and N. Hildebrandt. Energy transfer with nanoparticles for in vitro diagnostics. In: W. Parak and N. Feliu, Editors: Frontiers of Nanoscience, Volume 16, Colloids for Nanobiotechnology. Elsevier 2020.
3. X. Qiu, J. Xu, J. Guo, A. Yahia-Ammar, N.-I. Kapetanakis, I. Duroux-Richard, J.J. Unterluggauer, N. Golob-Schwarzl, C. Regeard, C. Uzan, S. Gouy, M. DuBow, J. Haybaeck, F. Apparailly, P. Busson, and N. Hildebrandt. Advanced microRNA-based cancer diagnostics using amplified time-gated FRET. Chemical Science 2018, 9, 8046-8055.
4. X. Qiu, J. Guo, J. Xu, and N. Hildebrandt. Three-Dimensional FRET Multiplexing for DNA Quantification with Attomolar Detection Limits. The Journal of Physical Chemistry Letters 2018, 9, 4379−4384.
Poster presentations
1. Jingyue XU, Xue Qiu, Jiajia Guo, Akram Yahia Ammar, Niko Hildebrandt. Sensitive and Specific Nucleic Acid Detection Based on Rolling Circle Amplification and Förster Resonance Energy Transfer. 15th Conference on Methods and Applications in Fluorescence (MAF 15). Bruges, Belgium, 2017.
III
Contents
1. Introduction ...1
2. Background ...7
2.1 MiRNA biomarkers ...7
2.1.1 MiRNA biomarkers for cancers/tumors ...9
2.1.2 MiRNA biomarkers for other diseases ... 11
2.2 MiRNA detection methods ... 13
2.2.1 Introduction ... 13
2.2.2 Conventional methods ... 14
2.2.3 Isothermal amplification-based methods ... 18
2.3 Förster resonance energy transfer ... 25
2.3.1 FRET theory ... 26
2.3.2 FRET measurements ... 32
2.3.3 FRET application in miRNA detection ... 34
2.4 Lanthanides ... 36
2.4.1 Luminescent lanthanide complexes ... 37
2.4.2 Luminescent Tb complexes as FRET donors ... 41
2.5 Fluorescent dyes ... 44
2.5.1 Introduction ... 44
2.5.2 Fluorescent dyes in FRET applications ... 46
2.6 Quantum dots... 47
2.6.1 Photophysical properties ... 47
IV
3. Advanced miRNA diagnostics using RCA-amplified Tb-to-dye FRET ... 54
3.1 Introduction ... 54
3.2 Materials and methods ... 56
3.2.1 Nucleic acid probes and exogenous targets ... 56
3.2.2 Photophysical analysis ... 58
3.2.3 Statistical analysis... 59
3.2.4 Amplified TG-FRET miRNA assays ... 59
3.2.5 RNA extraction ... 60
3.2.6 Absolute quantification of miRNA by amplified TG-FRET ... 64
3.2.7 RT-qPCR miRNA assays ... 64
3.3 Results and discussion ... 65
3.3.1 Sensitivity and dynamic range ... 65
3.3.2 Specificity and comparison to RT-qPCR ... 67
3.3.3 MiRNA detection in human plasma, tissue, and cells ... 70
3.4 Conclusion ... 75
4. Multiplexed miRNA diagnostics using CHA-amplified Tb-to-dye FRET ... 77
4.1 Introduction ... 77
4.2 Materials and methods ... 78
4.2.1 Nucleic acid probes and exogenous targets ... 78
4.2.2 Optical spectroscopy ... 79
4.2.3 TG-FRET miRNA assays ... 80
4.2.4 Mathematical treatment of multiplexed signal deconvolution ... 80
4.2.5 RNA extraction ... 81
V
4.2.7 RT-qPCR miRNA assays ... 82
4.2.8 Statistical analysis... 83
4.2.9 Calculation of FRET parameters ... 83
4.3 Results and discussion ... 84
4.3.1 Principle of CHA-TG-FRET miRNA assays ... 84
4.3.2 Single miRNA assay performance ... 86
4.3.3 Single FRET-pair multiplexing ... 88
4.3.4 Duplexed detection of miR-21 and miR-20a ... 90
4.3.5 MiRNA quantification from human tissue samples ... 93
4.4 Conclusion ... 95
5. MiRNA nano-diagnostics using HRCA-amplified Tb-to-QD FRET ... 97
5.1 Introduction ... 97
5.2 Materials and methods ... 99
5.2.1 Materials ... 99
5.2.2 Optical spectroscopy ... 100
5.2.3 HRCA-amplified Tb-to-QD TG-FRET miRNA assays ... 100
5.2.4 Statistical analysis... 101
5.2.5 Gel Electrophoresis ... 101
5.3 Results and discussion ... 102
5.3.1 Principle of HRCA-amplified TG-FRET ... 102
5.3.2 Feasibility of HRCA-amplified TG-FRET ... 104
5.3.3 Optimization of HRCA-amplified TG-FRET ... 106
5.3.4 Sensitivity and specificity ... 108
VI
6. Summary and outlook ... 110
7. Appendix ... 113
7.1 Abbreviations ... 113
7.2 Instrument ... 114
8. Bibliography ... 116
1
1. Introduction
MicroRNAs (miRNAs) are involved in virtually all physiologic processes, including differentiation and proliferation, metabolism, hemostasis, apoptosis or inflammation. To date, more than 30,000 miRNAs have been discovered, of which more than 2,500 can be found in humans. Especially, the discovery of many different circulating miRNAs (in biofluids of patients, e.g., serum, plasma, urine, cerebrospinal fluid, etc.) specific for cancers (breast, colorectal, esophageal, gastric, liver, lung, ovarian, pancreatic, etc.), as well as many other diseases (infectious disease, immunological disorder, cardiovascular disease, neurological disease, etc.), have strongly driven the implementation of miRNAs as next-generation biomarkers for prediction of the diseases, treatment response or prediction of progression. Based on a new report by BCC Research Inc., the global market for miRNA research tools, services, diagnostics, and drug discovery is estimated to reach nearly $1.4 billion in 2021 at a compound annual growth rate of 10.5% for 2016-2021. Compared to the very recent discovery of circulating miRNAs, the diagnostic section of this overall market is still extremely small, demonstrating the urgent need for developing approved clinical miRNA diagnostics. Despite their short lengths combined with strong sequence similarities between different miRNAs, many different technologies have been used for their detection, in which the most commonly applied methods are reverse transcription quantitative polymerase chain reaction (RT-qPCR), microarrays, next-generation sequencing (NGS), in situ hybridization (ISH), and northern blotting (NB). However, the main limitations are low sensitivity (microarray, NB) and throughput (ISH, NB, RT-qPCR), expenditure of costs (microarray, NGS), lack of absolute quantification (microarray, NGS) and high-order multiplexing from a single sample (RT-qPCR, NGS), time consuming procedures, and difficulties associated with comparable results across different platforms. Isothermal amplification has emerged as a powerful method for highly rapid, specific and sensitive miRNA assays, which also possesses the compatibility with diversified detection platforms, such as fluorescence, electrochemistry, and colorimetry.
2
The aim of this thesis is to address new routes of miRNA diagnostic tools, taking the simplicity of a homogeneous immunoassay, the multiplexing capability of microarrays, the sensitivity of RT-qPCR, and the throughput capacity of NGS within one single diagnostic tool. The original concept is to combine the versatility and multiplexing capability of luminescent Tb complexes (LTCs)-based time-gated Förster resonance energy transfer (TG-FRET) measurement with isothermal amplification technology to design ultra-sensitive and/or multiplexed miRNA biosensors. LTCs have long been used as an energy transfer donor, and possess unique advantages for multiplexing detection due to their multiple, sharp, and distinct emission peaks, as well as long excited-state lifetimes compared to organic dyes and quantum dots (QDs). Organic dyes can be used in biological systems with low toxicity. They have been the most frequently applied fluorophores for FRET, and in combination with LTCs as donors, multiplexed biosensing approaches are capable based on LTCs-to-dyes FRET. Notably, appropriate spectral crosstalk correction needs to be taken for spectral multiplexing due to the broad emission profiles of the most organic dyes. While QDs have unique advantages over organic dyes in FRET systems, especially in LTCs donors-based FRET assays. QDs have better spectral overlap as well as larger Förster distance with LTCs owing to their very broad absorption and extremely high molar extinction coefficient and quantum yield. The narrow and size-tunable emission bands make QDs excellent FRET acceptor candidates for multiplexing. Traditional FRET measurements are hampered by short-lived (in the ns range) and high-background fluorescence from buffers or samples. It can be eliminated by using TG-FRET, especially using long-lived LTCs as donors and short-lived dyes/QDs as acceptors. Upon pulsed excitation of a sample, by collecting photoluminescence (PL) intensities in time windows much longer than the natural decay of the dyes/QDs, but still within the lifetime of the LTCs decay, the direct excitation of the acceptors dyes/QDs and any background autofluorescence can be efficiently suppressed, greatly simplifying analysis of the system.
3
The thesis can be divided into eight chapters. Following the introduction, the theoretical and practical background of the research, and three individual studies are presented, then completing by summary and outlook, appendix, and bibliography. Each study is corroborated with introduction, materials and methods, results and discussion, and conclusion.
In the first study, I present a miRNA detection assay using enzymatic rolling circle amplification (RCA)-amplified LTCs-to-dye TG-FRET. My contribution to this study was the analysis of the clinical samples, including sample preparation, RCA-FRET experiments, RT-qPCR experiments, and data analysis. Dr. Jiajia Guo also contributed in the experimental work, and Dr. Xue Qiu designed the study and wrote the manuscript. All authors contributed in editing and writing of the manuscript and approved its final version to the journal (X. Qiu, J. Xu, J. Guo, A. Yahia-Ammar, N.-I. Kapetanakis, I. Duroux-Richard, J.J. Unterluggauer, N. Golob-Schwarzl, C. Regeard, C. Uzan, S. Gouy, M. DuBow, J. Haybaeck, F. Apparailly, P. Busson, and N. Hildebrandt. Chemical Science 2018, 9, 8046-8055. Third paper in Section List of publication). The combination of RCA with TG-FRET between LTCs donors and Cy5.5 acceptors resulted in single-nucleotide variant specificity and sensitivity with limit of detection (LOD) down to 4.2 ± 0.5 attomole (30 ± 3 fM) for miR-21, 6.8 ± 0.8 attomole (48 ± 5 fM) for miR-132, and 14 ± 2 attomole (99 ± 10 fM) for miR-146a. Quantification of miR-21 from human tissues and plasma samples revealed the relevance for breast and ovarian cancer diagnostics. Analysis of miR-132 and miR-146a from acute monocytic leukemia cells (THP-1 cells) demonstrated the broad applicability to different miRNAs and other types of clinical samples. Direct comparison to the gold standard RT-qPCR showed advantages of amplified TG-FRET concerning precision and specificity when quantifying low concentrations of miRNAs as required for diagnostic applications. The results demonstrate that a careful implementation of RCA and TG-FRET into one straightforward nucleic acid detection method can significantly advance the possibilities of miRNA-based cancer diagnostics and research.
4
Figure 1.1 Schematic representation for miRNA detection assay using RCA-amplified
LTCs-to-dye TG-FRET.
The second study presents a temporal multiplexing assay for miRNA detection assay using enzyme-free catalytic hairpin assembly (CHA)-amplified LTCs-to-dye TG-FRET. My contribution to this study was designing the study, performing experiments, analyzing the data, and writing the manuscript. Dr. Jiajia Guo and Dr. Xue Qiu also contributed in the study designing. All authors contributed in editing and writing of the manuscript and approved its final version to the journal (J. Xu, J. Guo, N. Golob-Schwarzl, J. Haybaeck, X. Qiu, and N. Hildebrandt. ACS Sensors 2020, (accepted), DOI: 10.1021/acssensors.0c00432. First paper in Section List of publication). Implementing TG-FRET into CHA can be used for the simultaneous quantification of two miRNAs (miR-21 and miR-20a) with a single measurement from total RNA extracts of human tissues. A single LTCs-to-Cy5.5 FRET-pair was conjugated at two specific distances within target-specific CHA hairpin probes, such that each miRNA resulted in distinct amplified PL decays that could be distinguished and quantified by TG PL intensity detection. Enzyme-free amplification in a separation-Enzyme-free assay format and the absence of autofluorescence background allowed for simple, specific, and sensitive detection with LOD down to 380 ± 40 attomoles (2.7 ± 0.3 pM)for miR-21 and 250 ± 60 attomoles (1.8 ± 0.4 pM) for miR-20a. Reliable duplexed quantification of both miRNAs at low picomolar concentrations
5
was confirmed by analyzing total RNA extracts from different colon and rectum tissues with single and dual target CHA-TG-FRET and RT-qPCR for comparison. These rapid, simple and multiplexed miRNA biomarker assays present a capable method for clinical diagnostics.
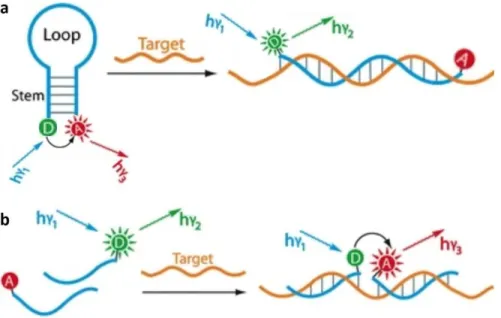
Figure 1.2 Schematic representation for multiplexed miRNAs (miR-21 and miR-20a) detection
assay using CHA-amplified LTCs-to-dye TG-FRET.
In the third study, I investigated a miRNA detection assay using enzymatic hyperbranched rolling circle amplification (HRCA)-amplified LTCs-to-QD TG-FRET. My contribution to this study was designing the study, performing experiments, and analyzing the data. Dr. Xue Qiu also contributed in study design. The manuscript is under preparation. By integrating autofluorescence-suppressed TG measurement into HRCA with exponential amplification efficiency, it provides advantages of high sensitivity with a detection limit of 11 ± 4 attomole (80 ± 30 fM) and selectivity toward target miR-21 in extremely low background noise, quick and simple one-step assay format. Target-primed and reverse primer-initiated HRCA reaction can generate a large amount of single strand DNAs with different lengths (HRCA product). By hybridizing with Tb-labeled reporter DNA probes, and adaptor DNA probes that are on the surface of the QD via biotin and streptavidin
0 2 4 6 100 1000 10000 P L i n te n s it y ( c o u n ts ) time (ms) 0 2 4 6 1 10 100 1000 10000 P L i n te n s it y ( c o u n ts ) time (ms) 0 2 4 6 100 1000 10000 P L i n te n s it y ( c o u n ts ) time (ms) 0 2 4 6 1 10 100 1000 10000 P L i n te n s it y ( c o u n ts ) time (ms) b 3* 2*1* miR- 21 1 2 3 1* 2* 3* 4 3* 2* Cy5.5 H2 f or miR- 21 2* 3 4* 3* 4 Tb Cy5.5 1 2 3 4 3*2* Tb 2* 3* 4* 3 4 1* 2* 3* Tb 2* 3* 4* 3 4 Cy5.5 1 2 3 4 3*2* FRET 10 bps H1 f or miR- 21 1 2 3 4 3* 2* Cy5.5 a 3* 2*1* miR- 20a 1 2 3 1* 2* 3* 43* 2* Cy5.5 H2 f or miR- 20a 2* 3 4* 3* 4 Tb 2* Cy5.5 1 2 3 4 3* Tb 2* 3* 4* 3 4 1* 2* 3* Tb 2* 3* 4* 3 4 Cy5.5 1 2 3 4 3*2* FRET 14 bps H1 f or miR- 20a 1 2 3 4 3* 2* Cy5.5 d
c miR- 21 sensor: FRET dist ance ~10 bps
miR- 20a senor: FRET dist ance ~14 bps TG Cy5. 5 I TG Cy5. 5 I TG Tb I TG Tb I miR c ~ TG Cy5. 5 I / I TGTb Rat iomet r ic miR quant if icat ion
x = var same x and y x = var y = var same x and y y = var
6
interaction, QD-DNA-LTCs complexes could from, inducing the shortened distance between LTCs, resulting in LTCs-to-QD FRET. Besides, the proposed assay shows great potential for broad applicability to different miRNAs and multiplexing capability, demonstrating that it can be a promising alternative to current miRNA diagnostic approaches.
Figure 1.3 Schematic representation for miRNA detection assay using HRCA-amplified
7
2. Background
2.1 MiRNA biomarkers
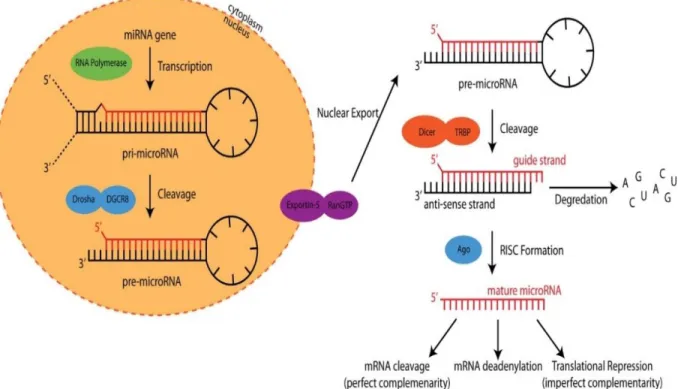
MiRNAs are small (approximately 19-23 nucleotides) non-coding RNAs that were first discovered in the nematode Caenorhabditis elegans in 1993 [1]. The production of mature miRNA encompasses a great deal of RNA processing steps according to the biogenesis of miRNA [2-4]. The basic process of miRNA expression and maturation is outlined in Figure
2.1. MiRNA coding genes are generally transcribed in the nucleus producing large capped
and polyadenylated primary miRNA transcript (pri-miRNA). The pri-miRNA sequence is cleaved by the Drosha-DGCR8 complex to produce a stem-loop hairpin structure precursor miRNA (pre-miRNA). This pre-miRNA is then transported to the cytoplasm by Exportin-5-Ran-GTP. In the cytoplasm, the RNase Dicer complex with the double-stranded RNA-binding protein TRBP cleaves the pre-miRNA hairpin to its mature length. The passenger strand (anti-sense strand) of the mature miRNA is degraded, whereas the functional strand (guide strand) is loaded together with Argonaute proteins (Ago) into the RNA-induced silencing complex (RISC), where it guides RISC to silence target mRNAs through mRNA cleavage, deadenylation or translational repression [2-5]. Acting as post-transcriptional regulators of gene expression [6], mature miRNAs can repress protein synthesis by binding to 3’-untranslated regions of mRNA and are involved in many biological processes, such as development, cell proliferation, differentiation, and apoptosis [7]. Therefore, miRNAs play an important role in the development and progression of cancer and various other diseases [8-10].
8
Figure 2.1 MiRNA biogenesis process starts with transcription in the nucleus and ends with
affecting gene translation in the cytoplasm. (Reprinted with permission from reference [5]. Copyright 2016 American Chemical Society.)
Taking account into the cell-to-cell variations and complex stochastic nature of RNA expression in cells [11], considerable information connecting cell function and miRNA expression may be covered by cell population based miRNA analysis. Single-cells analysis and tissues/organs cells analysis are crucial for miRNA expression profiling to understand the involvement, functions and combinations of different miRNAs in disease development at cellular level [8, 12, 13]. Many miRNAs are identified as key regulators of various diseases via such analyses, which makes them very attractive therapeutic targets. Besides, analysis of extracellular miRNAs circulating in the blood and other biofluids, such as serum, urine and cerebrospinal fluid, is also highly relevant to the diagnosis of diseases. It is found that a large amount of circulating miRNAs derived from various tissues/organs are present in human serum and plasma in a remarkably stable form and are extremely resistant against endogenous RNases [14, 15]. One explanation of the stability of circulating miRNAs is
9
associated with RNA-binding proteins, such as nucleophosmin (NPM1) [16] and Argonaute2 (Ago2) [17]. Alternative explanation is that circulating miRNAs are contained within microvesicles (e.g., exosomes, microparticles, and apoptotic bodies) and are protected from the membrane structure [18, 19]. For instance, exosomes, a sort of small membrane vesicles, have been reported to be abundant in plasma [20] and further have been revealed to contain miRNAs that can be released into body fluids such as blood and urine
[21]. The possibility of direct detection in easily-accessible biofluid samples has opened up new clinical avenues for miRNAs to be used as next generation biomarkers for diagnosis and prognosis [13, 22-24].
2.1.1 MiRNA biomarkers for cancers/tumors
Human miRNAs appear to be frequently located at fragile sites or genomic regions related to cancers [25], and play important role in onset, progression, and metastasis of cancers
[26]. The expression profiles of miRNAs differ between normal tissues and the tumors and differ between tumor types [27]. Many studies have shown the alterations of miRNA expression profiles in multiple cancers, including leukemia [28], breast cancer [29], lung cancer [30], ovarian cancer [31], prostate cancer [32], pancreatic cancer [33], liver cancer
[34] and colorectal cancer [35]. Dysregulation of miRNAs in cancer can occur through epigenetic changes and genetic alterations, which can affect the production of the primary miRNA transcript, their processing to mature miRNAs and/or interactions with mRNA targets [27]. It is reported that the tumor-specific genetic defects in the miRNA biogenesis machinery, such as in the genes that encode TARBP2 [36], DICER1 [37, 38], Exportin-5
[39], DROSHA [40], DGCR8 [40] and AGO2 [40], are highly relevant to the cellular transformation and carcinogenesis/anti-carcinogenesis process in different tumor and cancer types.
MiRNAs can act as oncogenes as well as tumor suppressors [9, 41]. On one hand, miRNAs that function as oncogenes can facilitate tumorigenesis including proliferation, angiogenesis, invasion and migration [42]. For instance, miR-21, which locates in the chromosomal region 17q23.1, its increased expression is among the most frequently
10
associated with poor outcome in human cancer [43]. It has been shown that miR-21 can contribute to carcinogenesis through inhibition of apoptosis [44], or down-regulation of other tumor suppressors, such as phosphatase and tensin homolog [45], tropomyosin1 [46]
and Sprouty2 [47]. Medina et al. found that the overexpression of miR-21 led to a pre-B malignant lymphoid-like phenotype in vivo, and when miR-21 was inactivated, the tumors regressed completely in a few days [48]. In addition, elevated expression levels of miR-21 have been found in a diverse subset of cancer cell lines and tissues (see Table 2.1). On the other hand, miRNAs that function as tumor suppressors can regulate the cell cycle, apoptosis, differentiation, DNA repair, angiogenesis, and metastasis [42]. For example, the let-7 family, which consists of 12 human homologues, was the first miRNA identified in humans [49]. Many human let-7 genes map to regions altered or deleted in human tumors, indicating that these genes may function as tumor suppressors [50]. The explanation for let-7 as a tumor suppressor is provided by the discovery that let-let-7 can regulate the expression of RAS oncogenes [51]. The RAS genes encode protein kinases that bind guanine nucleotides and are implicated in signal transduction processes [52]. About 20-30% of human tumors possess mutations in RAS genes, and approximately one-third of human lung adenocarcinomas carry RAS oncogenic mutations [52]. Besides, several studies show the tumor suppressor activity of let-7 encompasses other tumor types (see Table 2.1). Taken together, different or the same miRNAs can act as tumor suppressor or as oncogene in different kinds of cancers or tumors. Table 2.1 summarizes several important miRNAs that are associated with human cancers/tumors. In view of these findings, differentially abundant miRNAs detected in blood [53], plasma [54, 55], serum [14], urine [56], cystic fluid [57], pancreatic juice [58], and sputum [59] samples have been proposed as candidate biomarkers of different types of cancer.
11
Table 2.1 Several important miRNAs that are associated with human cancers/tumors. (Adapted
with permission from reference [52]. Copyright 2013 John Wiley and Sons.)
MiRNAs Cancers/tumors association Function
miR-21
colorectal, lung, breast, liver, stomach, and pancreatic cancers; chronic lymphocytic leukemia; neuroblastoma; glioblastoma; diffuse
large B-cell lymphoma; acute myeloid leukemia; Hodgkin’s lymphoma
oncogene
miR-17-92 cluster breast, lung, colon, stomach, and pancreatic
cancers; lymphomas oncogene
miR-155 lung, breast, and colon cancers; chronic
lymphocytic leukemia; B-cell lymphoma oncogene miR-221 and miR-222 chronic lymphocytic leukemia; thyroid
carcinoma; hepatocellular carcinoma oncogene
miR-372 and miR-373 testicular tumors oncogene
let-7 family lung, breast, colon, stomach, and ovarian
cancers tumor suppressor
miR-15a and miR-16-1 prostate cancer; chronic lymphocytic leukemia;
multiple myelomas; pituitary adenomas tumor suppressor miR-29
lung and breast cancers; acute myeloid leukemia; chronic lymphocytic leukemia;
cholangocarcinoma
tumor suppressor
miR-31 breast cancer tumor suppressor
miR-34 colon, lung, breast, kidney, bladder, pancreatic,
and liver cancers; neuroblastoma; melanoma tumor suppressor miR-126 colorectal, gastric, lung, prostate, bladder, and
breast cancers tumor suppressor miR-145 breast and colon cancers tumor suppressor miR-203 hepatocellular and pancreatic tumors tumor suppressor
2.1.2 MiRNA biomarkers for other diseases
In addition to cancers and tumors, miRNAs have shown to be associated with various diseases, including diabetes, neurological disorders and cardiovascular diseases.
In diabetic and pre-diabetic conditions, the miRNAs expression profiles are altered both in organs and in serum, consequently impairing insulin signaling, glucose, and lipid homeostasis [42]. The identification of specific miRNA signatures predicting the appearance of type 1 diabetes, type 2 diabetes, or their long-term complications would be very useful to permit the instauration of appropriate prevention strategies [52]. The expression of various serum miRNAs has been investigated in type 1 diabetes patients. As
12
a result, 152, 30a-5p, 181a, 24, 148a, 210, 27a, miR-29a, miR-26a, miR-27b, miR-25, and miR-200a are found to be upregulated in type 1 diabetes patients [60]. With regard to type 2 diabetes, studies revealed that serum miR-126 and serum miR-23a can be valuable biomarkers for pre-diabetes and early detection of type 2 diabetes [61, 62]. In addition, serum miRNAs such as miR-29a, miR-222, and miR-132 are proposed to be candidate biomarkers for predicting gestational diabetes mellitus [63]. MiRNAs are essential for the correct function of the nervous system, which has the broadest spectrum of miRNA expression of all human tissues. Around 70% of miRNAs are expressed in brain, and many of them are specific to neurons [64]. The brain-specific miR-9 and miR-134 are found to be involved in different aspects of neural development [65, 66]. Moreover, aberrant expression of miRNAs is associated with abnormal brain development and the pathogenesis of several neurodevelopmental diseases, such as Tourette’s syndrome, Alzheimer’s disease and Parkinson’s disease [67]. For instance, low miR-107 expression is found in the cortex of Alzheimer’s disease patients [68], and the expression levels of blood miR-1, miR-22*, and miR-29 can be useful biomarkers for Parkinson’s disease [69]. MiRNAs have been found to be key regulators of cardiac development as well as multiple cardiovascular diseases [70]. MiRNAs are up or downregulated in vascular disease, heart failure, ischemic cardiomyopathy, dilated cardiomyopathy, and aortic stenosis [71, 72]. Since miRNAs in the systemic circulation may reflect tissue damage, circulating miRNAs such as miR-1, miR-208a, and miR-126 have been suggested as potential biomarkers for the acute myocardial infarction diagnosis [73-75].
Besides, miRNAs are used as biomarkers for the diagnosis of various other diseases. For example, circulating miR-122, miR-22, and miR-34a are found to be correlated with human immunodeficiency virus, and can serve as biomarkers for liver injury in human immunodeficiency virus patients [76]. Urinary miRNAs such as miR-1, miR-133, miR-223, and miR-199 are dysregulated in patients with autosomal-dominant polycystic kidney disease, and can be used as potential biomarkers of disease progression [77]. Plasma miR-122 is proposed as a biomarker for hepatic diseases [78]. In addition, circulating miR-323-3p is suggested as a biomarker for the diagnosis of ectopic pregnancy [79].
13
Taken together, understanding the functions of different individual and combined miRNAs, identifying disease-relevant signatures of miRNAs, and detecting them as biomarkers in tissues as well as in body fluids can be of paramount importance for both diagnostics and therapy of cancers or other diseases.
2.2 MiRNA detection methods
2.2.1 Introduction
As the clinical and biological implications of miRNAs have been sufficiently elucidated, it is of great significance to develop robust analytical technologies that facilitate routine miRNA detection. While owing to the unique characteristics of miRNA, such as small size, low abundance, sequence similarity, and their ability to regulate multiple targets, the progress in miRNA detection modalities meets many challenges and remains to be improved [6].
First, due to the small size as well as the GC content variation of miRNA, specific thermodynamic constraints should be taken into account, which can potentially introduces sequence-specific bias and significantly complicate the vast majority of hybridization-based, especially polymerase chain reaction (PCR)-hybridization-based, detection methods [80]. Second, miRNAs are often expressed differing only by single nucleotides. The high sequence similarity among family members makes the specific detection more difficult. Third, miRNAs make up only a small fraction (roughly 0.01%) of the mass in total RNA extracted from a sample of interest, and miRNA concentration in cellular can be as low as a few molecules per cell [81]. The extremely low abundance of miRNA requires a highly sensitive assay. Moreover, the abundance of particular miRNA sequences varies by as much as four orders of magnitude from a few copies to over 50,000 copies per cell [82], thus, a wide dynamic range of miRNA detection is also a necessity. Importantly, beyond specificity, selectivity, and large dynamic range, another challenge is high-order multiplexing,whereby levels of more than one miRNA are quantitated simultaneously and from a single sample. Most mRNAs are regulated by one or more miRNAs [83], and further study revealed that
14
multiple miRNAs can target the same mRNA [84], adding complexity to the mechanisms through which miRNAs regulate gene expression. Hence, it requires methods to detect multiple miRNAs to fully understand the important and complex function of these regulation mechanisms.
Given the aforementioned analytical challenges, considerable effort has been continuously devoted to explore miRNA analysis strategies to meet the requirements for accuracy, sensitivity, specificity, high-throughput, and capacity to high-order multiplexing.
2.2.2 Conventional methods
At present, the major approaches used to analyze miRNAs are reverse transcription quantitative polymerase chain reaction (RT-qPCR), microarrays, next-generation sequencing (NGS), in situ hybridization (ISH), and northern blotting (NB).
RT-qPCR. As the current gold standard for miRNA analysis, there already exists some
commercial assays and protocols, such as miRCURY LNA miRNA PCR Assays from QIAGEN, TaqMan Assays from Thermo Fisher Scientific, and Two-tailed miRNA Assays from TATAA Biocenter. As mentioned before, the small size of miRNA (roughly the same size as traditional primer) complicates most PCR-based detection schemes. To overcome this challenge, two strategies are most commonly used: (1) stem-loop RT-based miRNA assays using TaqMan probe; (2) poly (A) tailing-based and direct RT-based miRNA assays using SYBR green dye [85]. The overall workflow for both of these RT-qPCR approaches are illustrated in Figure 2.2a. The principle of these RT-qPCR methods mainly relies on reverse transcription of miRNA to complementary DNA (cDNA), followed by quantitative PCR with real-time monitoring of reaction product accumulation using either intercalating dye or TaqMan probe.
Microarray. Microarrays were among the first methods to be utilized for parallel analysis
of large amounts of miRNAs, that rely on nucleic acid hybridization between target miRNAs and their corresponding complementary probes (Figure 2.2b). Several technical variations of the approach have been developed independently including the probe design, immobilization chemistry, sample labeling, and microarray chip signal detection methods
15
platforms for studying the role of miRNAs and their involvement in a broad spectrum of developmental and physiological mechanisms.
NGS. The NGS technique has enabled another major approach for miRNA expression
profiling, of which unique is the ability to identify novel miRNA sequences that are not already annotated in miRNA databases. The main NGS technologies have been reviewed
[87]. Generally, NGS begins with the preparation of a small cDNA library from the miRNA sample of interest using a RT process similar to RT-qPCR. Adaptors are ligated to both the 5′ and 3′ ends of the cDNA products, and the resulting products are attached to either a planar or bead based substrate (Figure 2.2c). This is then followed by the massively parallel sequencing of millions of individual cDNA molecules from the library. Bioinformatic analysis of the sequence reads identifies both known and novel miRNAs in the data sets and provides relative quantification using a digital approach.
ISH. Since it was firstly used for miRNA detection in 2006 [88], ISH has become a
common and unique technique for miRNA profiling which identifies the native locations of miRNA in a single cell, inside tissues, or in cell compartments. Depending on the detection method, ISH can be divided into chromogenic enzyme-based ISH and fluorescent ISH (FISH). Global miRNA expression analysis in tissues is typically performed with the help of chromogenic enzyme-based ISH detection methods, while for more precise small RNA localization studies, FISH imaging is more suitable [89]. Various approaches, including modification of hybridization probes, cell fixation and permeabilization, amplification of the target sequence and detection signal, enable the significant progress in single molecule RNA FISH techniques [89, 90].
NB. At present, NB for miRNA analysis is a readily available technology for molecular
biology laboratories. Common protocol for NB involves miRNA isolation, polyacrylamide gel electrophoresis, transfer of the separated sample to the blotting membrane, and visualization via hybridization with a radioactively labeled DNA strand complementary to the miRNA of interest. As NB involves a size-based separation step, it can simultaneously detect both mature and precursor forms of a miRNA, which can be utilized for the studies on miRNA processing mechanisms [91].
16
Figure 2.2 Schematic representation of major conventional methods for miRNA detection: a.
reverse transcription quantitative polymerase chain reaction (RT-qPCR); b. microarray; c. next-generation sequencing (NGS). (Adapted with permission from reference [92]. Copyright 2012 Springer Nature.)
17
Recently, these conventional methods for miRNA detection were compared, and each method showed its strengths and weaknesses [86, 93] (Table 2.2). Owing to the high sensitivity, RT-qPCR and NGS are the most often applied approaches for detecting miRNAs, and have been used for commercial test. However, each method has limitations, such as low sensitivity (microarray, NB) and throughput (ISH, NB, RT-qPCR), expenditure of costs (microarray, NGS), specialized and expensive instruments (NGS, microarray, ISH), lack of absolute quantification (microarray, NGS) and high-order multiplexing from a single sample (RT-qPCR, NGS), time consuming procedures, and difficulties associated with comparable results across different platforms.
Table 2.2 Advantages and disadvantages of the conventional methods used to detect miRNAs.
(Adapted with permission from reference [86]. Copyright 2019 Oxford University Press.)
Methods Advantages Disadvantages
RT-qPCR - widely used for high sensitivity - lack of multiplexing
- biases and errors due to exponential amplification
microarray - provides genome wide coverage - multiplexing capability
- low sensitivity
-lack of absolute quantification - requires specialized instruments - requires specific probes
- difficult data normalization - lack of reproducibility NGS - high sensitivity
- provides genome-wide coverage - identifies novel miRNAs - identifies single nucleotide polymorphisms in miRNAs
-lack of absolute quantification - lack of multiplexing
- requires specialized instruments - requires skilled bioinformatician - complicated data analysis ISH - spatiotemporal distribution in cells
or tissue sections
- low throughput
- requires specialized instruments - requires specialized skills - laborious
- time consuming NB - detects non-amplified miRNAs - low sensitivity
- low throughput
- requires many starting materials - laborious
- time consuming - radioactivity
18 2.2.3 Isothermal amplification-based methods
Isothermal amplification has emerged as a powerful method for quantification of nucleic acids and has already proven its utility for developing highly specific and sensitive miRNA assays. Alternative to PCR methods that rely on the precise and complex thermocycling, isothermal amplification-based methods can rapidly and efficiently amplify the short target nucleic acids or the signal of a recognition event at constant temperature under simple conditions. Since the first isothermal amplification technique was introduced to detect miRNA [94], creative miRNA assays using isothermal amplification have been developed, achieving miRNA detection with high specificity (single-nucleotide resolution) and superior sensitivity (detection limit reaching femtomolar or attomolar level). Sequentially, these methods are demonstrated to be capable for miRNA quantification in clinical samples (tissues, serum, and plasma), and well suitable for miRNA in situ detection due to their mild reaction conditions and localized amplification ability [95]. A multitude of isothermal amplification techniques has been exploited. For instance, rolling circle amplification (RCA), duplex-specific nuclease signal amplification (DSNSA), loop-mediated isothermal amplification (LAMP), and strand-displacement amplification (SDA), that are mainly realized by enzyme-based replication or digestion. Besides, isothermal amplification can also be achieved via enzyme-free strand displacement processes, such as catalytic hairpin assembly (CHA) and hybridization chain reaction (HCR). Table 2.3 summarizes the basic mechanism and Figure 2.3 shows the schematic representation of these isothermal amplification-based methods for miRNA detection, respectively. The appealing attributes of isothermal amplification are: (1) the capability for rapid and high amplification (usually amplification efficiency of 103-106 within 3h); (2) the programmability allowing for
construction of cascade amplification; (3) the compatibility with diversified detection platforms, such as fluorescence, electrochemistry, and colorimetry [95]. These advantages provide an excellent opportunity to build various sensitive and rapid bioassays for miRNA detection.
19
Figure 2.3 Schematic representation of isothermal amplification-based methods for miRNA
detection: a. rolling circle amplification (RCA); b. duplex-specific nuclease signal amplification (DSNSA); c. loop-mediated isothermal amplification (LAMP); d. strand-displacement amplification (SDA); e. catalytic hairpin assembly (CHA); f. hybridization chain reaction (HCR). (Adapted with permission from reference [95]. Copyright 2017 American Chemical Society.)
20
Table 2.3 Summary of the isothermal amplification-based methods for miRNA detection.
(Adapted with permission from reference [95]. Copyright 2017 American Chemical Society.)
Methods Amplification mechanism Enzyme Role of miRNA
Linear or exponential amplification
RCA polymerase extension,
strand displacement DNA polymerase, ligase primer both DSNSA cleaving DNA probe duplex-specific nuclease template linear
LAMP polymerase extension,
strand displacement DNA polymerase primer exponential SDA polymerase extension, strand displacement, nicking DNA polymerase, nicking endonuclease primer or initiator both CHA strand displacement enzyme-free initiator linear HCR strand displacement enzyme-free initiator linear
RCA. In the 1990s, it was reported that DNA polymerase can utilize circular templates to
make a long linear strand, containing multiple copies of a given sequence and this process was referred to as RCA [96, 97]. RCA can be coupled to the ligation of a padlock probe (in the presence of a target analyte) to provide sensitive detection of nucleic acids, and it was firstly used to detect miRNA in 2006 [98]. The padlock probe is a single probe that contains 3’- and 5’-end sequences that bind to target miRNA sequences in a juxtapose manner to aid a ligase-mediated circularization of the padlock probe if the 5’-end is phosphorylated. After circularization of the padlock probe, target miRNA (or an external primer) and DNA polymerase are used to produce long repeating DNA, which can generate amplification with high efficiency sequences (Figure 2.3a). Besides padlock probes, dumbbell probes-mediated RCA strategy is also widely used [99,100]. Subsequently, a target miRNA recycled RCA assay with specially designed dumbbell probe is proposed without utilization of ligases [101]. The dumbbell probe is already circularized but the primer-binding site is sequestered in the duplex region of the dumbbell. Upon target binding, the duplex region of dumbbell probe opens up to enable the primer to bind and the RCA process to begin. In contrast to linear RCA techniques mentioned above, the proposal of exponential amplification method hyperbranched RCA (HRCA) leads to the sensitivity significantly
21
improved, which is reported that more than 109 copies of the circle can be produced within 90 min at approximately 60 °C [102]. The schematic representation of HRCA is shown in
Figure 2.4. During the linear RCA process, the forward primer (usually the target miRNA)
produces a multimeric ssDNA RCA product, which then becomes the template for the reverse primer. The DNA polymerase then extends the reverse primer, and during the extension process the downstream DNA is displaced to generate branching or a ramified DNA complex, which induces a discrete series of single-stranded DNA (ssDNA) or double-stranded DNA (dsDNA) fragments of various lengths comprising one or multiple units of the circular probe.
Figure 2.4 Schematic representation of HRCA strategy: (1) forward primer binds to ligated circular
probe and is extended by DNA polymerase; (2) the continuous amplification generates a long ssDNA, which contains binding sites for reverse primer; (3) reverse primers bind to the long ssDNA and are extended by DNA polymerase; (4) the nascent ssDNA generated from reverse primer extension can also serve as templates to synthesize other primers. (Adapted with permission from reference [103]. Copyright 2014 The Royal Society of Chemistry.)
22
In most cases, target miRNA is generally used as the template for selective ligation of a padlock probe to generate the oligonucleotide circle. Due to the limited length of miRNA, mismatch between miRNA and ssDNA padlock, even if there is a mismatch of only one pair of bases, would lead to a significant decrease in melting temperature, which means an extremely low possibility of oligonucleotide circle generation and thus forbidden RCA
[104]. In other words, using miRNA as a ligation template could provide improved
specificity in miRNA assays and single-base differences between miRNAs have been correctly discriminated. Additionally, the exploitation of T4 RNA ligase 2 and SpintR ligase (Chlorella virus DNA ligase) leads to the higher selectivity and sensitivity than the commonly used T4 DNA ligase for RNA splinted DNA ligation [105-107]. RCA has been widely used in miRNA detection due to its high sensitivity and specificity.
DSNSA. Duplex specific nuclease is an enzyme that shows a strong preference for cleaving
DNA in dsDNA or DNA-RNA hybrid duplexes with little activity against ssDNA or RNA, exhibits good capability to discriminate perfectly matched short DNA duplexes from non-perfectly matched ones [108]. By taking these particular properties of nuclease, DSNSA possesses an intrinsic advantage for miRNA assay. As shown in Figure 2.3b, DSNSA is achieved by the miRNA-mediated cycle of probe capturing, cleavage and fragment release. In typical DSNSA-based miRNA detection methods, target miRNAs can continuously capture specific DNA probes once they are released in reaction systems, no matter the probes are designed to be linear- or hairpin-structured [109], fluorophore-labeled or label-free [110]. Upon using differently labeled DNA probes, simultaneous detection of multiple miRNAs can be realized [111, 112]. Moreover, low error rates occur owing to the one-step amplification based on simple hybridization between the target miRNAs and probes.
LAMP. LAMP strategy was firstly introduced in 2000 [118], which exhibits great
sensitivity as aresult of its exponential amplification feature. As illustrated in Figure 2.3c, the LAMP system consists of a template DNA (M, F2c, F1c, B1, B2, B3), forward inner primer (F1c, F2), backward inner primer (B1c, B2) and outer primer B3. In the initial step, forward inner primer hybridizes to F2c in the template DNA and extends in the presence of DNA polymerase. Afterwards, target miRNA hybridizes to M in the template DNA and
23
initiates the extension along the DNA template and the strand displacement DNA synthesis with the help of DNA polymerase. Consequently, forward inner primer-linked ssDNA is released and forms a stem-loop structure at the 5’-end through the hybridization between F1 and F1c. At the 3’-end of this ssDNA, backward inner primer hybridizes to B2c to perform the primer extension and then the outer primer B3 hybridizes to B3c in the 3’-end of the ssDNA to perform the strand displacement DNA synthesis, releasing a backward inner primer-linked ssDNA, which can form dumbbell structures at 3’- and 5’-end, respectively. This auto-cycling strand displacement DNA synthesis can be repeated continuously and leads to exponential amplification of miRNA. LAMP can amplify a few copies of the target to 109 in less than one hour with high specificity [113].
However, the major disadvantages of LAMP strategy are the complicated design of primers for stem-loop formation, effected performance due to the synergistic hybridization and extension of the multiple primers along the long template, and the positive false signal caused by the indirect evaluation methods [114]. Though several new ideas have been put forward in order to overcome these shortcomings [115-117], there is still brilliant space for retrofitting primers and detection probes to adapt to the detecting requirement.
SDA. SDA is a kind of isothermal reaction, of which the mechanism relies on nicking,
polymerase extension, and strand displacement. In terms of miRNA detection, two types of SDA strategies have been developed allowing for exponential and linear signal amplification (Figure 2.3d). In exponential amplification strategy, target miRNA works as a primer and hybridizes with a carefully designed ssDNA template. Once captured by the template, target miRNA is extended by DNA polymerase to generate one or more recognition sites for nicking enzyme, and the released DNA strands trigger a downstream detection signal. In some more complex cases, released DNA strands can be re-captured by the same or another ssDNA template, acting as primers to trigger another amplification SDA cycle. In linear amplification strategy, probe is designed as hairpin structure that the primer hybridization region is blocked in the stem region. The primer in the reaction solution can only be captured by probes that opened by target miRNA. Afterwards, a cycle
24
of miRNA-induced primer capturing, polymerase extension, and subsequent miRNA strand release are created, resulting in a linear amplification of the signal.
The commonly used polymerases in SDA are Bst DNA polymerase [118], Klenow fragment polymerase [119], and phi29 DNA polymerase [120], that have been widely reported to construct sensitive miRNA sensing platforms. However, the conventional utilization of enzymes hinders SDA from wider application because enzyme-mediated reactions are restricted by temperature, ionic composition, and other factors [114]. Hence, the developments of more transformational SDA methods are important.
CHA. Since originally developed in 2008 [121], CHA has received particular interest
owing to its excellent property of enzyme-free signal amplification. As illustrated in Figure
2.3e, two complementary nucleic acid hairpins are designed and the reaction is inactivated
in the absence of target. Only upon addition of the target miRNA which acts as initiator, one of the hairpins can be opened based on the toehold-mediated strand displacement, and then further enable the assembly of both hairpins to form double-stranded CHA product. Subsequently, the spontaneously displaced and recycled miRNA can act as a catalyst to induce more hairpin assembly events. However, the background signal caused by the nonspecific CHA products in the absence of target may counteract the specificity of signal amplification methodologies and compromise their analytical performance [122]. Aiming at this challenge, an improved CHA strategy is proposed by introducing mismatched base pairs into the breathing sites of the hairpin substrates [123]. This kind of mismatched CHA amplification significantly decreased the background reaction signal, which improved the properties of CHA-based biosensing strategies for miRNA detection [124-126].
CHA is a simple and nimble isothermal amplification method, which can be ascribed to its enzyme-free peculiarity. It avoids the disadvantages of enzymatic reactions, including particular reaction times and conditions to maintain the enzyme's activity. In addition, the cyclic utilization of the target miRNA during CHA procedure make designed biosensors achieve excellent sensitivity even in the low level of miRNA.
25
HCR. As another enzyme-free isothermal amplification method, the basic mechanism of
HCR was firstly reported by Pierce and Dirks in 2004 [127]. As seen from Figure 2.3f, two species of hairpin DNA (H1, H2) are rationally designed, and one hairpin DNA (H1) comprises sequences complementary to the target miRNA and another hairpin DNA (H2). Only in the presence of initiator target miRNA, the hairpin structure of H1 can be opened, and then hybridize with H2, forming a nicked long double-stranded DNA structure to amplify the signal readout.
HCR shows great potential in biosensor because it can bind thousands of auxiliary hairpin probes to amplify signal [128]. What's more, the enzyme-free reaction eliminates the restrictions of enzyme-coupled methods. Nevertheless, deficiencies such as environmental sensitivity still need to be addressed for more extensive applications in clinical miRNA diagnostics.
2.3 Förster resonance energy transfer
Förster resonance energy transfer (FRET) is a well-established photophysical phenomenon, by which energy transfers from a donor molecule in excited state to an acceptor molecule in ground state over reasonable distances (typically 1-20 nm). Such energy transfer is a non-radiative process (without emission of photon) and is the result of dipole-dipole interactions between the donor and acceptor. If the donor-acceptor pair is correctly oriented and luminescence spectrum of the donor overlaps with the absorption spectrum of the acceptor, energy can be transferred leading to luminescence quenching of donor and emission from FRET-sensitized acceptor (when the acceptor is luminescent).
The discovery of the FRET phenomenon could be traced back to the beginning of the twentieth century [129, 130]. Afterwards in 1927, Jean Perrin [131] initially put forth a classical explanation of this phenomenon, and proposed the relationship between the dipole interactions and the transferred energy. Later in 1932, his son Francis Perrin [132]
developed a corresponding quantum mechanical theory based on Kallmann’s and London’s results [133]. He recognized the influence of the spectral overlap between the emission
26
spectrum of donors and the absorption spectrum of acceptors on energy transfer efficiency. However, the relation between easily accessible spectroscopic data and theoretical equations was achieved by Theodor Förster [134-138]. By extending the Perrins’ original ideas, he proposed a quantitative theory to describe the non-radiative energy transfer depending on the spectral overlap and the intermolecular distance that are still valid today thus enabling the possibility of many FRET applications in all kinds of natural sciences
[139]. To date, FRET has become an outstanding tool for the study of intermolecular
interactions with many applications in biological technologies, sensing, and conformational studies.
The discussion below presents some basic knowledge of mechanisms in terms of FRET theory (Section 2.3.1) and FRET measurement techniques (Section 2.3.2) that are mainly extracted from reference [140], and a short review of FRET-based applications in miRNA biosensing (Section 2.3.3).
2.3.1 FRET theory
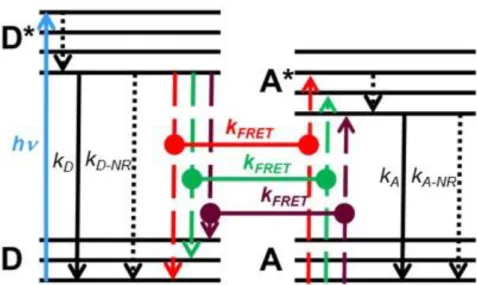
The basic principle of FRET can be described in the Jablonski diagram. As illustrated in
Figure 2.5, the donor and acceptor possess several different electronic states, and the
energy transfer only happens when they share the same electronic transition (red, green and purple line). It takes place from the state in which the donor is excited (D*) to a state in which the acceptor is excited (A*), where an electronic transition from a higher to a lower energy level in donor leads to an electronic transition from a lower to a higher energy level in acceptor. Thus the shared electronic transition, the spectral overlap between donor emission and acceptor absorbance in terms of spectroscopy, is an indispensable condition for FRET. In addition, due to the dipole-dipole interaction, the distance between donor and acceptor must be close but not too close. In fact, this dipole-dipole coupling should be dominant at the usually considered FRET distance range of approximately 1-20 nm, where orbital overlap-related mechanisms (for very short distances) and radiative mechanisms (for long distances) play minor roles [140].
27
Figure 2.5 Basic FRET principle described in simplified energy level scheme (Jablonski diagram).
The donor is excited (hv) from an electronic ground state (D) to an excited state (D*), then goes to an excited electronic ground state by inner relaxation (dotted arrow), then goes to ground state by radiative decay (kD), non-radiative decay (kD-NR) or FRET (kFRET). The FRET process from D* to
A* occurs when they share the same electronic transition (the difference between the respective energy levels need to be equal, vertical dashed lines in red, green and purple color). After FRET, the acceptor is in an excited state (A*), followed by radiative decay (kA) or non-radiative decay (k A-NR) to its ground state (A). (Adapted with permission from reference [140]. Copyright 2013 The
Wiley-VCH Verlag GmbH & Co. KGaA.)
The FRET rate (𝑘𝐹𝑅𝐸𝑇)can be described as following Equation 2.1:
𝑘𝐹𝑅𝐸𝑇 = 9(ln 10)κ2Փ𝐷 128𝜋5𝑁
𝐴𝑛4𝜏𝐷𝑟6 𝐽(𝜆)
(2.1)
where κ2 is the orientation factor of coupled donor and acceptor transition dipole moments, Փ𝐷 is the luminescence quantum yield of donor in absence of energy transfer, 𝑁𝐴 is Avogadro’s number (6.023 × 10²³ mol-1), 𝑛 is the refractive index of the medium, 𝜏𝐷 is the luminescence lifetime of donor (in the absence of acceptor), 𝑟 is the distance between donor and acceptor, and 𝐽(𝜆) is the spectral overlap integral between the donor emission and acceptor absorption defined in wavelength scale.
28
When the 𝑘𝐹𝑅𝐸𝑇 and other decay rates are in equilibrium (𝑘𝐹𝑅𝐸𝑇 = 𝑘𝐷+ 𝑘𝐷−𝑁𝑅 = 𝜏𝐷−1), and the FRET efficiency (𝜂𝐹𝑅𝐸𝑇) is 50% at a distance 𝑟, this distance is commonly referred as Förster distance 𝑅0, which can be calculated by replacing 𝑘𝐹𝑅𝐸𝑇 with 𝜏𝐷−1 and 𝑟 with 𝑅0 in Equation 2.2: 𝑅0 = (9(ln 10)κ2Փ𝐷 128𝜋5𝑁 𝐴𝑛4 𝐽(𝜆)) 1 6⁄ = 0.02108(κ2Փ 𝐷𝑛−4𝐽(𝜆)) 1 6⁄ nm (2.2)
The spectral overlap integral 𝐽(𝜆) describes the degree of energetic resonance between donor and acceptor (Figure 2.6), which is accessible with precise spectroscopy measurements and is given by Equation 2.3:
𝐽 = ∫ 𝐼̅ (𝜆) 𝜀𝐷 𝐴(𝜆)𝜆4𝑑𝜆 (2.3)
where 𝜀𝐴(𝜆) is the acceptor extinction coefficient (or molar absorptivity) spectrum, 𝐼̅ (𝜆) 𝐷 is the donor emission spectrum normalized to unity and is given by Equation 2.4:
∫ 𝐼̅ (𝜆) 𝑑𝜆 = 1𝐷 (2.4)
Figure 2.6 The overlap (gray area) of the area normalized emission spectrum of donor (D) (cf. Equation 2.4) and the extinction coefficient spectrum of acceptor (A) 𝜀𝐴 defines the overlap integral 𝐽 (cf. Equation 2.3). (Adapted with permission from reference [140]. Copyright 2013 The Wiley-VCH Verlag GmbH & Co. KGaA.)
29
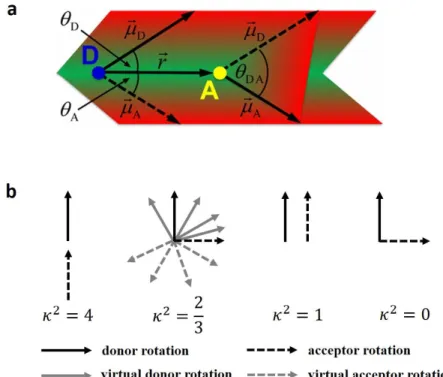
Figure 2.7 a. The orientation of donor emission transition dipole moment 𝜇⃗𝐷, the orientation of
acceptor absorption transition dipole moment 𝜇⃗𝐴, and connection vector 𝑟⃗ . (Adapted with permission from reference [141]. Copyright 2016 American Chemical Society.); b. The possible virtual orientations of donor and acceptor transition dipole moments and the corresponding κ2. (Adapted with permission from reference [142]. Copyright 2015 MDPI.)
In addition, another important variable for FRET is the orientation factor κ2 (in Equation
2.1 and Equation 2.2). Figure 2.7a describes the orientation of the donor and acceptor
dipole moments within the basic concept of FRET. With the different angles between the transition dipole moments of donor (𝜇⃗𝐷) and acceptor (𝜇⃗𝐴) and the connection vector between them (𝑟⃗), κ2 can be calculated as following Equation 2.5:
κ2 = [𝜇̂
𝐷∙ 𝜇̂𝐴− 3(𝜇̂𝐷∙ 𝑟̂)(𝜇̂𝐴∙ 𝑟̂)]2 = (cos 𝜃𝐷𝐴− 3 cos 𝜃𝐷cos 𝜃𝐴)2 (2.5)
where 𝜇̂𝐷, 𝜇̂𝐴, and 𝑟̂ represent the unit vectors of 𝜇⃗𝐷, 𝜇⃗𝐴, and 𝑟⃗, respectively, 𝜃𝐷𝐴 is the angle between the donor and acceptor transition dipole moments (𝜇⃗𝐷 and 𝜇⃗𝐴), 𝜃𝐷 and 𝜃𝐴 are the angles between the respective dipole moments and the donor-acceptor connection vector (𝜇⃗𝐷 and 𝑟⃗, 𝜇⃗𝐴 and 𝑟⃗).
30
According to the Equation 2.5, κ2 can range from 0 to 4 depending on the relative orientation of donor and acceptor transition dipole moments. As illustrated in Figure 2.7b
[142], κ2 can be 4 for head-to-tail parallel transition dipole moments, 1 for the parallel
transition dipole moments, and κ2 = 0 can occur for the perpendicular orientation. Often, κ2 = 2 3⁄ is assumed to be a good approximation and is used for many practical FRET application [140]. When both donor and acceptor can take any possible orientation during the FRET time (1 𝑘⁄ 𝐹𝑅𝐸𝑇), which means that the average rotation rate is much larger than the average FRET rate (𝑘𝑟𝑜𝑡𝑎𝑡𝑖𝑜𝑛 ≫ 𝑘𝐹𝑅𝐸𝑇), the system is in a dynamic averaging regime and κ2 becomes 2 3⁄ . Even if one of the FRET pair shows average orientation and the other has a fixed orientation, then κ2 can take values between 1 3⁄ and 4 3⁄ , for which 2 3⁄ is still a decent approximation.
Taking Equation 2.1 and Equation 2.2 allows to the relation between the FRET rate (𝑘𝐹𝑅𝐸𝑇), the luminescence decay time of donor (𝜏𝐷), and the donor-acceptor distance (𝑟). As described in Equation 2.6, 𝑘𝐹𝑅𝐸𝑇 is inverse sixth power distance dependent (𝑟−6):
𝑘𝐹𝑅𝐸𝑇 = 𝜏𝐷−1 (𝑅0 𝑟)
6
(2.6)
Then the FRET efficiency (𝜂𝐹𝑅𝐸𝑇) can be given by Equation 2.7:
𝜂𝐹𝑅𝐸𝑇 = 𝑘𝐹𝑅𝐸𝑇 𝑘𝐹𝑅𝐸𝑇+𝑘𝐷+𝑘𝐷−𝑁𝑅 = 𝑘𝐹𝑅𝐸𝑇 𝑘𝐹𝑅𝐸𝑇+𝜏𝐷−1 = 1 1+(𝑟 𝑅0⁄ )6= 𝑅06 𝑅06+𝑟6 (2.7)
As shown in Figure 2.8, due to the 𝑟−6 distance dependency, FRET efficiency is mostly sensitive in the region of 0.5 𝑅0 to 2.0 𝑅0(gray area). Beyond this range, FRET is either too efficient for shorter distances or negligible for longer distances.
31
Figure 2.8 FRET efficiency as a function of donor (D) to acceptor (A) distance (cf. Equation 2.7).
(Adapted with permission from reference [140]. Copyright 2013 The Wiley-VCH Verlag GmbH & Co. KGaA.)
As FRET is a deactivation process of the excited donor, the photophysical properties of the donor change in the FRET process. Thus, in terms of different spectroscopy, FRET efficiency (𝜂𝐹𝑅𝐸𝑇) can be determined by measuring the luminescence intensity (𝐼), or luminescence decay time (𝜏), or quantum yield (Փ) of the donor in the presence (𝐼𝐷𝐴, 𝜏𝐷𝐴, Փ𝐷𝐴) and in the absence of the acceptor (𝐼𝐷, 𝜏𝐷, Փ𝐷), respectively (Equation 2.8).
𝜂𝐹𝑅𝐸𝑇 = 1 −𝐼𝐷𝐴 𝐼𝐷 = 1 −𝜏𝐷𝐴 𝜏𝐷 = 1 −Փ𝐷𝐴 Փ𝐷 (2.8) In summary, an effective FRET depends on several factors that must be carefully taken into accountbefore thinking about an application of FRET:
(i) Spectral overlap integral 𝐽(𝜆) : the donor emission spectrum must overlap with the acceptor.absorption spectrum.
(ii) Distance between FRET pair 𝑟: due to the strong distance dependence (𝑟−6) of FRET efficiency, a slight modification of 𝑟 can induce a significant change on FRET signals in the range of 0.5 𝑅0 to 2.0 𝑅0. The distance 𝑟 should be neither too far nor too close (ca. 1-20 nm).
(iii) The orientation factor κ2: the donor emission dipole moment, the acceptor absorption dipole moment, and their separation vectors must be in favorable mutual orientation. κ2 is usually assumed to be 2 3⁄ , which is the average value integrated over all possible angles for freely rotating attached-lumiphores.