Biological and particulate contaminants in interfaces
by
Jia Su
Submitted to the Department of Civil & Environmental Engineering
in partial fulfillment of the requirements for the degree of
Master of Science in Civil & Environmental Engineering
at the
MASSACHUSETTS INSTITUTE OF TECHNOLOGY
February 2018
Massachusetts Institute of Technology 2018. All rights reserved.
Signature
A u th o r ...
Department of Civil & Environmental Engineering
January 19, 2018
Certified by....
Signature
redacted
Prof. Lydia Bourouiba
Assistant Professor
Thesis Supervisor
Signature
redacted
Accepted by
ARCHIVES
MASSACHUSETTS INSTITUTE OF TECHNOLOGYAPR
182018
Chairman, Department
Prof. Jesse Kroll
Commit e on Graduate Theses
Biological and particulate contaminants in interfaces
by
Jia Su
Submitted to the Department of Civil & Environmental Engineering on January 19, 2018, in partial fulfillment of the
requirements for the degree of
Master of Science in Civil & Environmental Engineering
Abstract
The transport of biological, chemical, or particulate contaminants shapes disease transmission, chemical spills, climate, ecology, and bio-hazard risks. Yet, little is understood on the mechanisms controlling droplet formation and selection of droplet sizes and contamination levels from a contaminated water bulk. Bubbles play a crit-ical role in shaping this transfer of chemcrit-icals, particulates, and biologcrit-ical organisms from water to air. They surface, and eventually burst, emitting myriads of droplets into the air. Despite recent progress in our understanding of bubble formation and bursting at the air-water interface, the factors selecting the loads that they carry and emit into the air remain unknown in part due to limitation in direct measurements. In this thesis, we discuss a method of direct visualization and quantification of par-ticulates contained in contaminated bubble films at interfaces. The calibration of this method is key to progress in our understanding of particulate transport from water to air. In particular, although our method allows to reveal contaminants within films via the appearance of spots, the exact link between the size of such spots and the size of the original particles or organisms, their shape, wetting, and the size of the film remain unexplored. In this thesis, we performed a series of systematic measure-ments and calibrations using bacteria, particles, and rods of various sizes and wetting properties to calibrate the spot sizes observed on contaminated bubbles and films. We rationalized the dependencies observed using a combination of optical ray-tracing and modelling of film distortion in the presence of contaminant. Our results have im-portant implications for in situ study of particles and bacterial communities within large scale complex interfaces.
Thesis Supervisor: Prof. L. Bourouiba Title: Assistant Professor
Acknowledgments
I would first like to express my sincere gratitude to my advisor Prof. Lydia Bourouiba,
Esther and Harold E. Edgerton Career Development Assistant Professor of Civil and Environmental Engineering and Mechanical Engineering at the Massachusetts Insti-tute of Technology, a talented teacher and passionate scientist, for the continuous support of my studies and research, for her patience, motivation, enthusiasm, and inspiration. She is one of the most brilliant, dedicated and determined women scien-tists I have ever met. Her guidance helped me throughout my research, study, and writing of this thesis. I could not have imagined having a better advisor and mentor.
I am extremely thankful to my labmate Stephane Poulain for his kind help
through-out my research. He is not only my labmate but also my role model. He shared his excellent advice with me, helping to improve my skills in both coding and writing. I cannot express enough how thankful I am to him.
Besides, I would like to thank all the people who helped me with my research at MIT: Prof. Jesse H. Kroll for the moral support of all the graduate students in our department, Prof. Otto Cordero and his student Elise Ledieu for training us with bacterial culture skills, Prof. Benedetto Marelli and his student Yunteng Cao for their collabration, and Prof. Benjamin Kocar and his student Michael Chen for helping us with storage of our fragile bacteria.
My sincere thanks also goes to all my other labmates in the Fluid Dynamics of
Disease Transmission Laboratory: Dr. Timothee Jamin, Dr. Youngsoo Joung, Yongji Wang, Maxime Inizan, Nicole Bustos, Vira Dhaliwal, Raj Dandekar, Skungkwon Lee, Nicholas Kwok, Baptiste Lafoux, and Max Louyot. Thanks for all the fun and support. Graduate school can be a difficult draining experience, but I am proud to say my experience here was intellectually exciting and fun.
Last but not the least, I would like to thank my parents Mrs. Yun Yun and Mr. Zhongjin Su for supporting me spiritually throughout my studies and entire life.
We gratefully acknowledge support of the MIT-Lincoln Laboratory through the
Contents
1 Chemical, particle, and pathogen transfers 15
1.1 Bubbles and contaminants . . . . 18
1.2 Water-air exchanges via bubbles . . . . 20
1.2.1 Physiology of a bubble . . . . 21
1.3 Overview of the project . . . . 22
2 Bubbles and contamination 25 2.1 Bubbles in contaminated water . . . . 25
2.2 Bubbles and pathogens . . . . 26
2.3 Sum m ary . . . . 29 3 Biological background 31 3.1 Bacteria protocol . . . . 31 3.1.1 Echerichia coli . . . .. 31 3.2 M ethodology . . . . 32 3.2.1 Bacterial Culture . . . . 32
3.2.2 Protocols to make LB agar . . . . 33
3.2.3 E. coli culture from -80 'C freezers . . . . 35
3.2.4 Purification . . . . 36
3.3 Behavior of the bacteria liquid . . . . 37
3.3.1 OD and pH evolution.... ... 37
4 Schlieren imaging and design of the experiments 43
4.1 Introduction ... ... 43
4.2 Bubble cap film thickness . . . . 44
4.3 Deformation of thin films . . . . 46
4.4 Schlieren visualization . . . . 47
4.4.1 Bacteria and particles in bubbles . . . . 47
4.4.2 Particles in flat films . . . . 49
4.4.3 Rods in bubbles . . . . 50
4.4.4 Rods in flat films . . . . 51
5 Schlieren visualization: spot size to particle size ratio 55 5.1 Results and summary . . . . 57
List of Figures
1-1 Direct visualizations of different events at the origin of infectious droplets potentially responsible transmission through air and on surfaces. (a) Trajectory of mucosalivary fluid droplets expelled after a cough. (b) Fragmentation of mucosalivary fluid filaments into droplets following a sneeze. (c) Trajectory of droplets above a toilet bowl and created during the flush of a standard high-pressure hospital toilet. (d - e) Burst of a bubble at the surface of water contaminated with E. coli and ejecting droplets in the air. Reproduced from
[1-41.
. . . . 161-2 On-shore wave breaking generates large numbers of bubbles. Bursting bubbles in turn generate sea sprays disseminated in the air we breath. The size of the bubbles generated govern the size and speed of the spray droplets created
[5].
The composition of the droplets is determined bythe composition of the bubble film. Picture credit L. Bourouiba. . . . 17
1-3 Mechanisms of generation of ocean spray, from bubble bursting (jet and film drops) to spume drops generated during wave-crest break-ing. Rainfalls also contribute to bubble generation and bursting, and subsequent droplet emission [6]. . . . . 18
1-4 Representation of organic material inside and on the ocean Surface M icrolayer (SM L) [7]. . . . . 19 1-5 Film drops created from the burst of a bubble of radii on the order of
2-5 mm. The droplets emitted have a wide range of sizes and speeds
2-1 A 22s-old bursting bubbles gives birth to numerous micro droplets. Scale bar 1 mm, 0.22 ms between each frame. . . . . 26
2-2 Life story of a bubble: (A) birth, (B) rise, (C) surfacing, (D) burst,
(E) film drop production, (F) jet drop production. Reproduced from [8]. 27
2-3 (A) Film drops and (B) jet drops can be a vector for pathogens.
Re-produced from [81. . . . . 28
2-4 Through Schlieren photography (the upper part is the set up), we can see bacteria in a bubble film. The concentration of bacteria is about
5 x 10⁸ cells/ml (OD600 = 0.470) in DI water, the times are t =10,
26, 29, and 36s. The corresponding bubble cap thickness are h = 2.5, 1.3, 1.1, and 0.9 Pm. Scale bar is 1mm. Bacteria are observed at long
lifetimes, when the bubble film reaches a thickness of the order of the bacteria size. . . . . 29
3-1 E. coli GFP 0157:H7 giggling under the microscopy. The time between
each frame is 0.21s, the scale bar is 2 pm. . . . . 32 3-2 Echerichia coli GFP 0157:H7 with four different cell concentrations
under microscope. The OD6 00 is: (1) 0.744, (2) 0.372, (3) 0.186, (4) 0.093. They produce strong green fluorescence when excited by blue
light. Scale bar is 50 pm . . . . 34
3-3 Measured E. coli growth curve using OD6 00 in LB medium. We can see
that after 10 hours the concentration becomes stable . . . . 37
3-4 E. coli concentration as a function of the optical density at 600 nm
(OD6 0 0) in three different media: deionized (DI) water, and two other
minimal solutions of salt: phosphate buffer (KP), and potassium phos-phate buffer (PBS). . . . . 38
3-5 OD60 0 value of E. coli with five different initial concentrations. These
time evolution show that E. coli in PBS do not grow, regardless of their initial concentration. . . . . 39
3-6 Bacteria phosphate buffer (KP) solution. From left to right, the con-centration of bacteria increases, so that the transmittance of light de-creases. However, surface tension changed little with concentration. Scale bar is 1 cm . . . . . 40
3-7 The surface tension of bacteria with different concentrations in different
solutions. We can see that the concentration of bacteria will not change the surface tension of the solution in either PBS or KP. . . . . 41
4-1 E. coli in a bubble film. The concentration of bacteria is approximately
5 x 10⁸ cells/ml in DI water. The times are t =10, 26, 29, and 36s.
The corresponding bubble cap thickness are h = 2.5, 1.3, 1.1, and 0.9 pm. Scale bar is 1mm. Reproduced from [11. . . . . 44 4-2 Measurement of the bubble cap film thickness. A needle punctures the
film and creates a hole that recedes at constant speed Uc, related to the film thickness by Taylor-Culick relationship: U, = V2u-/ph, where h is the film thickness, - the surface tension and p is the density of
flu id . . . . . 4 5 4-3 Bubble cap film thickness time evolution in deionized water inoculated
with E. coli at OD60 0 = 0.474. Each point correspond to a single
bursting bubbles. The longer bubbles stay at the surface, the thinner
they are... 46
4-4 Particle entrapped in a thin liquid film of thickness ho, which is smaller than the particle diameter 2rp. O, is the contact angle between the fluid in the film and the particles. Figure adapted from
[9].
. . . . 47 4-5 Diagram of a Schlieren setup. Rays from an initial light sources gothrough 3 lenses and a pinhole to generate parallel beams. In the test area, light is deflected when it encounters a change of optical index, such as when going through a bubble. The beam are then refocused on the sensor of a camera. . . . . 48
4-6 Numerical Schlieren visualization of a meniscus around a particle in a thin film (a). After parallel light goes through the meniscus, the Schlieren optical setup (b) acts as a magnifier: the trace of the particle on the camera sensor (c) is larger than the particle itself. Schlieren images of menisci from experiments (d) show a very good agreement
with the simulation (Scale bars: 100 [m). . . . . 49
4-7 Particles in a flat soap film. The upper one is particle with diameter
= 0.5 pm, the lower one is particle with diameter = 2 pm. Scale bar
is 1 cm. g is the direction of gravity. . . . . 50
4-8 Copper rod going through a bubble. We can observe a meniscus profile around it. d is the diameter of the rod, D is the diameter of the
meniscus profile. d = 260pm, D = 2.33 mm. . . . . 51
4-9 Schlieren radius (Rmeniscus) of steel rods with different diameters as a function of tim e. . . . . 52
4-10 When a cylindrical needle is placed in a soap film, we can observe a meniscus profile around it (left down). After the film bursts, the meniscus profile disappears (right down). d is the diameter of the rod,
D is the diameter of the meniscus profile. d = 137pm, D = 1.87mm. . 53
5-1 The set up of the Copper Ring frame. We used 1mm diameter copper
wire to make the ring frame. . . . . 56 5-2 The diameter of yellow copper rods were measured under the microscope. 56 5-3 Contact angle measurement. 01 and 02 are the two contact angles,
measured using a in-house precise image processing code . . . . 57
5-4 Schlieren spot diameter as a function of the rod diameter. Results from experiments (colors) and simulations (black) are represented. CA refers to contact angle. . . . . 58
List of Tables
3.1 The pH evolution of E.coli with four different initial concentrations. The pH did not change a lot . . . . 38
Chapter 1
Chemical, particle, and pathogen
transfers
Despite widespread vaccination programs, the healthcare and economic burdens of respiratory diseases remain enormous. Influenza returns every year, SARS and MERS are growing concerns, and the threat of emerging and re-emerging pathogens to the global population is growing. In this context, understanding the dynamics of pathogen transfer from one host to the next directly or indirectly via contamination of water or surfaces is critical to improve the modelling of epidemics and ultimately to develop efficient mitigation strategies [10-12]. Nevertheless, the transmission mechanisms of even the most common diseases remain poorly understood.
Droplets and droplet nuclei carrying chemicals, spores, viruses, and bacteria can be created directly from an infected or contaminated host, such as from respiratory events such as coughs, sneezes, talks, or laughs [2, 131. The distance over which respiratory droplets can be transmitted depends on their size and on the properties of the sneeze or cough cloud produced, it can range from 1 m to the entire length of a hospital ward [2, 3, 14]. They can also originate from contaminated water bodies [8]: sea and ocean sprays [15], wastewater plants [16, 17], sewage [18], pools and hot tubs
[19, 20], or flushes in indoor lavatory systems [4], as illustrated in figure 1-1. Droplets
originating from contaminated water pools have been directly linked to respiratory diseases through the release of droplets in the air. This can be caused by various
.~**~~(d) ~ 0.1 cm
7All
Figure 1-1: Direct visualizations of different events at the origin of infectious droplets potentially responsible transmission through air and on surfaces. (a) Trajectory of mucosalivary fluid droplets expelled after a cough. (b) Fragmentation of mucosalivary fluid filaments into droplets following a sneeze. (c) Trajectory of droplets above a toilet bowl and created during the flush of a standard high-pressure hospital toilet.
(d - e) Burst of a bubble at the surface of water contaminated with E. coli and ejecting droplets in the air. Reproduced from [1-4].
fragmentation processes, among which bursting bubbles (figure 1-1(d, e)) is the most ubiquitous and has been shown to be very efficient at transferring pathogens from infected water to the air we breathe
[15].
In the environment, bubbles produce spray. Ocean spray droplets play a key role in the ocean-atmosphere physical and biochemical exchange. This exchange is critical in the dispersal of organic, inorganic, and biological compounds in this atmospheric boundary layer, which in turn can shape chemical reactions and physical processes in the atmosphere. When fully or partially evaporated, droplet-residues become solid particles that can promote cloud drop or ice nucleation and precipitation. In fact, such sprays can reside in the atmosphere for days transported in various forms. Spray
Figure 1-2: On-shore wave breaking generates large numbers of bubbles. Bursting bubbles in turn generate sea sprays disseminated in the air we breath. The size of the bubbles generated govern the size and speed of the spray droplets created [5]. The composition of the droplets is determined by the composition of the bubble film. Picture credit L. Bourouiba.
drops also play a key role for the dispersal of ocean organisms. They can furthermore contribute to changes in the thermodynamics and heat-exchange in the atmosphere, which in turn can have important feedback on the ocean dynamics itself (e.g., hur-ricane formation). Despite numerous attempts to sample and quantify sea spray to better estimate its effect on local and global climate and sea-atmosphere exchanges, our understanding of sea sprays and their complex formation and dissemination pro-cesses remains very limited. Wave breaking and rain can both lead to spray formation
by inducing the formation of bubbles of a range of sizes that can re-surface and burst,
thus projecting either jet or film drops depending on the size of the bubbles (Figure 1-2). Other effects such as spurs of fluid sheared off by wind from wave-crests can also produce sprays (Figure 1-3).
Here, our focus is on the role of bubble bursting as it remains a major contributor to the formation of ocean sprays. Despite recent work on spray from bubble bursts, the results remain confined to highly idealized studies of pure water, soapy or highly viscous bubbles, thus severely limiting the relevance of the results for the oceans. Moreover, the effects of environmental, chemical, and biological conditions on bubble-bursting and resulting spray is a complex problem with entangled factors that have
Spume drops
Film and jet drops produced by
bursting bubbles -
-Figure 1-3: Mechanisms of generation of ocean spray, from bubble bursting (jet and film drops) to spume drops generated during wave-crest breaking. Rainfalls also contribute to bubble generation and bursting, and subsequent droplet emission
[61.
so far been difficult to parse out. A recent comprehensive review of research on Ocean Spray by Veron
[6J
identified seven key future issues and needs in research in ocean spray, including "Small film andjet
droplets transport significant amounts of organicmatter and inorganic chemical species. It is likely that the size-dependent biochemical compositions need to be included in the source
functions for
the smallest droplets to better estimate their aggregated impact on the global aerosol cycle ". However before even examining the composition of the droplets, one key question remained undressed: the dynamics of enrichment of the bubbles as they move up the water column and surface.1.1
Bubbles and contaminants
Presence and transport of organic and inorganic particles at the oceanic liquid-air interface (Figs. 1-2, 1-3) play a vital role in sustaining marine ecology and impact climate, making the study of these phenomena of extreme relevance in oceanogra-phy [6, 21-30]. This liquid-air boundary layer is typically 40-100 microns thick and is therefore also known as the Surface Microlayer (SML). It contains chemical and biological materials, and its importance can hardly be overestimated, given that it occupies more than 70% of the Earth's surface. It is the medium for dispersal of
con-ATMOSPHERE
SEA SURFACE MIC
Po yacrds. C02-+1-+
Phytoplankton Transparent Exopotymer Parficls
Gel partices/Aggregates .art Mkrobial cells
- + Carbon transport
OLAYER
OCEAN
Figure 1-4: Representation of organic material inside and on the ocean Surface Mi-crolayer (SML) [7].
stituents of bulk ocean water to the atmosphere and therefore serves as a crucial link between aquatic life in the ocean water and the overlying air. For instance, through diffusion, convection or advection, sea-spray aerosols formed at the SML catapult or-ganic materials from the oceans to the troposphere where they can act as nucleating agents for ice and cloud formation [21]. These processes therefore have significant implications for local and global precipitation levels. Understanding and accurately modeling these SML processes from the viewpoint of the relevant hydrodynamic inter-actions at the ocean surface can therefore lead to more accurate and effective climate and weather modeling, prediction, and control or mitigation in times of detrimental or toxic chemical or biological pollutants or invasions of the oceans/seas/coastal re-gions [21, 31]. Besides the impact on climate, weather, and radiative transfers, the biogeochemical exchange serves as a mechanism for nourishment to many life forms on and below the water surface. The SML is therefore especially critical to the ma-rine ecosystem (Figure 1-4). The microbial and chemical transport that occurs in the
SML can also affect human populations onshore, especially in the vicinity of lakes
and oceans [22, 24, 32-36].
The rich lifeforms make up a biofilm consisting of algae, bacteria and viruses and form an integral part of the marine surface ecology. This micron sized layer is also the home for various autotrophs, ranging from bacteria to algae [37, 381. They help in nutrient, 02 and CO2 transport to and from the ocean surface to the atmosphere and also affect energy transfer
[39].
Bacterial and algal neustonic communities have the potential to serve as important transfer sites, either accelerating or slowing the fluxes of elements or compounds between the atmosphere and the water column andvice versa [40].
1.2
Water-air exchanges via bubbles
Winds also play a pivotal role in convection of sea sprays and their particulate residues over large distances [23, 25, 41, 421. Microbial transport is greatly aided by strong winds [41], given breaking waves and spumes that occur; while the presence of oil slicks dampens the effects of winds and thus inhibits energy transfer and mass trans-port across the SML. Accurate physically-rooted mathematical modeling of these important factors is required to improve our assessment of the spread of chemical and biological organisms and contaminants. Two particular mechanisms that are highly efficient in these exchanges are: bubble movement through the water bulk; and bub-ble bursting at the liquid-air interface [8, 21, 23, 43, 44]. The latter generates a large range of sizes of droplets as illustrated in Figure 1-5 and is part of the focus of this thesis.
Woodcock [45] was the first to observe that bubbles originating from waves gener-ate infected droplets causing acute respiratory illness. Many other case studies report a link between infected water bodies, bubble bursting, and respiratory illness [8, 15]. One of the main mechanisms that has been proposed to explain the rich concentra-tion of contaminaconcentra-tion in droplets when compared to the bulk concentraconcentra-tion is that a bubble scavenges contaminants on its way as it rises through the water column (See Fig. 1-3) [46-481. However, the discrepancy in the measurements carried out in these
L
Figure 1-5: Film drops created from the burst of a bubble of radii on the order of 2-5 mm. The droplets emitted have a wide range of sizes and speeds which depend on the film thickness and properties at burst
[1].
studies do not allow for a clear mechanism to emerge or be validated
[48,
49].1.2.1
Physiology of a bubble
At the end of its travel through a water bulk, a bubble reaches the air-water interface forming a thin liquid film, a bubble cap, which encapsulates the air cavity. Competing gravitational and interfacial forces select the bubble equilibrium shape [50, 51]. The
capillary length f, = Vo/p1g, on the order of the millimeter for air-water interfaces, is the length scale at which these forces balance; with a the water surface tension,
pw the water density, and g the gravitational acceleration. For small Bond number
Bo = (R/&)2 bubbles remain mostly submerged and spherical, while buoyancy drives
larger bubbles to extend further into the air. Bubbles smaller than O(ec) remain mostly submerged and spherical, while buoyancy drives larger ones to extend further into the air against surface tension.
All bubbles eventually burst. Their cap radius R, which measures their cap shape
and extension above the water surface, selects the mechanisms of their ageing, burst, and the outcome of such burst [1]. A single bursting surface bubble can generate hundreds of such film drops (figure 1-5). While bubbles responsible for film drops are suspected to be less numerous than those responsible for jet drops at the surface of oceans [52], most sea surface droplets are nevertheless thought to originate from film
drops [53-55]. For relatively clean water interfaces, and for bubbles for which gravi-tational drainage can be neglected (an assumption valid for R < 5f,), the number N and mean diameter (d) of film drops are estimated to be controlled by the bubble cap radius R and film thickness at burst hb as N ~ (R/lc)2(R/hb)7
/8 and (d) ~ R3/8h 5/
[56].
What sets the concentration of organisms of chemicals or particles in these droplets is not known. Although the dynamics of scavenging of biological or chemical agents during the rise of the bubble can play a role, another neglected piece of this problem is the dynamics at the interface after the bubble has surfaced (Figure 1-5). In fact, the mechanism that triggers bubble rupture and is responsible for the selection of droplet sizes and speeds remains little understood. Indeed, since 1966 it has been thought that the thin film cap forming bubbles at the interface simply drains and thins until burst. The dynamics of the burst is governed by a rich interplay of film thinning and interaction with local surfactant or particles and a coupling with the air surrounding the bubble as recently discussed in [1]. The dynamics of the thinning and burst is rich, but remain outside of the scope of this thesis. In this thesis, our focus is on the development of a method for visualization of contaminated bubble caps after they surface. We aim to develop a method to quantify directly the dynamics of interaction between the contaminants, particles or organisms, and the film they are trapped in.
1.3
Overview of the project
In this chapter, we briefly introduced the essential role that contaminated droplets can play in the environment and health. We introduced the important role of bubbles in the environment and their role in coupling the content of water (good or bad) with the air we breathe. We also introduced some key concepts relevant to bubble life and death that contribute to this process of water-to-air transfer. However, key questions remain unknown. The central question on which we focus is the dynamics of contaminated bubbles at the interface. In this thesis, we focus on developing and validating a technique and model to directly visualize and quantify the contaminants
on bubble interfaces during their life at the surface. In terms of contaminants, in this thesis, we will consider a combination of biological agents such as Escherichia coli and artificial agents, such as solid particles and rods of a range of wetting and surface properties.
In the first part (chapters 2), we focus on observing particles in bubbles. Bubbles are small, and the particles inside bubbles are even smaller. We used a visualization method called Schlieren imaging to visualize for the first time particles and bacteria in bubbles. In Chapter 3, we discuss our biological methodology for preparation of a range of solutions to test the efficacy of this method to visualize organisms and under which conditions. In Chapter 4, we discuss the theoretical models at plan that can explain our visualization quantitatively. In Chapters 4-5, we discuss a series of analog experiments involving particles, rods, and bacteria coupled with bubbles and thin vertical films aiming to validate the calibration from Schlieren spot observed to particle size or intrusion in the thin interface. Finally we discuss the next steps and implication of our results in Chapter 6.
Chapter 2
Bubbles and contamination
2.1
Bubbles in contaminated water
In nature, bubbles are considered to be critical in exchanging materials from water to the air [8, 57]. Sea spray, produced by bursting bubbles, plays an essential role in transporting chemicals, viruses, and bacteria [15, 58] from the oceans to the atmo-sphere. Waterborne diseases, caused by pathogens in contaminated water for instance from in sewage, toilets, pools, or tap water may also be transmitted by aerosols gen-erated by bubbles [59]. Bubbles burst after they arrive at the surface of a liquid, forming an entrapped air cavity which rapidly collapses 160]. When a bubble bursts, it generates droplets (Figure. 2-1) which disperse what was contained in the bulk water [571.
Woodcock (1948) recognized that droplets ejected by bubbles from the sea shore can cause respiratory diseases [61, 621. Harold (1974) suspected that bursting bubbles eject microalgae into the air, causing allergies and respiratory illnesses [63]. Higgins (1964) tested the aerosol produced by bursting bubbles created by water contami-nated by different bacteria, and found that the concentration of some species (e.g.,
S. marcescens) in the droplets was higher than in the water bulk
[64].
Blanchard and Syzdek (1970) showed that the concentration of bacteria in the droplets createdby bursting bubbles can be up to a thousand time greater than in the bulk water [15, 33, 65].
Figure 2-1: A 22s-old bursting bubbles gives birth to numerous micro droplets. Scale bar 1 mm, 0.22 ms between each frame.
Microbial aerosols produced by sewage treatment plants have also been suspected to cause health issues for plant workers and nearby residents, as they disperse viruses, bacteria, and other pathogens
[66].
High concentration of bacteria can be found in wastewater treatment plants [67], estuarine water [68], and other places. The density of bacteria in the surface is higher than in the bulk water because of the formation of microlayers [34].2.2
Bubbles and pathogens
Bubbles are ubiquitous and understanding their role in droplet production requires an understanding of their physics. In this section, we will discuss the physical principles ruling the life of bubbles.
Bubbles can be created for instance by strong flows that blend air into water [691,
by rain [331, or from dissolved gases or rapid changes of pressure via cavitation [57].
Once formed, bubbles move upward due to their buoyancy. Rising bubbles interact with the surrounding fluid [81: they can capture particles and pathogens along their trajectory. The process through which bubbles collect particles on their surface is called scavenging [70]. Scavenging can result in an increase in concentration of bac-teria or particles on the surface of bubbles
[711.
Some materials and organisms haveA
QB
E
F
Figure 2-2: Life story of a bubble: (A) birth, (B) rise, (C) surfacing, (D) burst, (E) film drop production, (F) jet drop production. Reproduced from [8].
abundant hydrophobic sites and are particularly good candidate to be scavenged by rising bubbles [65]. When a bubble surfaces, its shape is defined by the competition between gravity and capillarity. The liquid in the bubble film drains into the bulk water, the film becomes thinner until it ruptures [8]. Bursting bubbles create two types of drops [72]. The first set of droplets are called film drops: they are created from the bubble cap film which separates the inside of the bubble from the air above it (Figure 2-2 -E). The second set of droplets are called jet drops, which are gener-ated later from the liquid jet following the film rupture (Figure 2-2 -F). Bursting of relatively large bubbles (greater than 1 mm in diameter) mainly creates film droplets
[731. These droplets can transport pathogens (Figure. 2-3) [8].
The bacterial enrichment factor (EF) is the concentration of bacteria in drops
Moro---.~/IM 0R*
B
Figure 2-3: (A) Film drops and (B) jet drops can be a vector for pathogens. Repro-duced from [8].
when they are produced divided by their concentration in the water where the bubble was formed [651. It is usually greater than 1: droplets from bubbles are highly concentrated in bacteria. Three parameters are believed to control enrichment[15:
1) the mechanisms of bubble scavenging, 2) the type of bacteria, and 3) the droplet
size, and 4) the drop position in the jet set. Bubble scavenging, as introduced in the previous paragraph, happens when bubble rise in the water. The volume of bacteria collected by a bubble can be described as a function of bubble rise distance, which is the height that a bubble rises through the water [15]. Bacteria follow the streamlines close the bubble, contact with the bubble, and are scavenged [70]. Prior studies showed that there exists a maximum EF in a certain jet drop diameters and the EF decreases from the top to the bottom of a jet set [65]. However, we cannot create an estimation of EF from one study to another. There is no clear understanding of what parameters shape the composition of film drops. Because these droplets originate from the bubble cap film, to understand them we first need to understand the bubble cap and its composition.
In this thesis, we focus on developing a method of observation of particles within the bubble cap to gain fundamental insights into the mechanism of pathogen
,_________________________-A
lens lens lens Schlieren object
j
pinhole lens cameraIDY
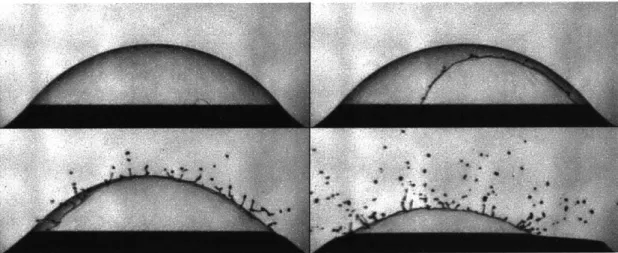
test area . 41 9-d~iiIi~bbhFigure 2-4: Through Schlieren photography (the upper part is the set up), we can see bacteria in a bubble film. The concentration of bacteria is about 5 x 10' cells/ml
(OD60 0 = 0.470) in DI water, the times are t =10, 26, 29, and 36s. The corresponding
bubble cap thickness are h = 2.5, 1.3, 1.1, and 0.9 pm. Scale bar is 1mm. Bacteria
are observed at long lifetimes, when the bubble film reaches a thickness of the order of the bacteria size.
ination and droplet enrichment from bursting bubbles. Indeed, figure 2-4 is a striking illustration of visualization of bacteria in bubbles.
2.3
Summary
Bubbles are ubiquitous and they play critical roles in transporting materials from liquid to air. Air bubbles that move upward to the surface can collect organic and non-organic particles during their journey. When they burst at the surface, they produce film drops and jet drops, and the concentration of bacteria, viruses, or par-ticles in these drops can be several hundred times higher than in the bulk water. Understanding how microorganisms or particles are enriched in bubble caps is very important to gain insight into the mechanism of water-born pathogen dissemination and to control it. In this thesis, we focus on developing a method of observation
point light source
of particles within the bubble cap to gain fundamental insights into the physics of bubble enrichment and air contamination by them.
Chapter 3
Biological background
We used Echerichia coli (E. coli) GFP 0157:H7 attenuated laboratory strains as the mock pathogen for this study. This chapter starts by introducing the protocols associated with the preparation of these bacteria. We chose E. coli as model organisms to illustrate the dynamics of contamination because it is one of the most ubiquitous and studied bacteria. We note that, in contrast, the body of work of Blanchard and Syzdek
[151
on bacteria and bubbles was performed with S. marcescens. In the second part of this chapter we also evaluate the effect of bacteria in a range of concentrations on water properties, namely its surface tension, which is key for the life of bubbles at the interface. In fact, we find little effect, yet this might not be the full picture and subtle changes in surface tension might still have important effects as discussed at the end of this chapter.3.1
Bacteria protocol
3.1.1
Echerichia coli
Echerichia coli (E.coli) are bacteria widely found in the environment, food, and
intestines of animals. Most E.coli strains are harmless, but some serotypes are as-sociated with severe human diseases, among which 0157:H7 is the most prevalent in North and South America and in the UK [74, 75]. E. coli 0157:H7 is one of the
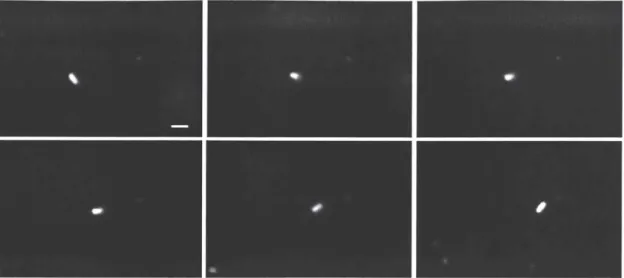
Figure 3-1: E.coli GFP 0157:H7 giggling under the microscopy. The time between each frame is 0.21s, the scale bar is 2 pm.
Shiga-toxin-producing types of E. coli, which can cause diarrhea, hemorrhagic col-itis, and hemolytic uremic syndrome [751. In our project, we used E.coli Biosafety level 1 (BSL-1)
[76]
attenuated laboratory strain. A microscopic visualization of E.coli is shown Fig. 3-1.
3.2
Methodology
3.2.1
Bacterial Culture
E.coli are cultured in Luria broth (LB) media with ampicillin 100mg/ml added to
prevent the growth of other bacteria. LB is a nutrient-rich medium commonly used to culture bacteria in the lab. The addition of agar to LB results in the formation of a gel that bacteria can grow on, as they are able to gather nutrition from LB within the agar but cannot digest agar.
Plasmids can carry one or more antibiotic resistance genes, which confer resistance to a specific antibiotic to the bacteria carrying them. The presence of an antibiotic resistance gene on a plasmid allows to easily isolate bacteria containing that plasmid from bacteria. The addition of an antibiotic to the medium allows for the selection of only those bacteria with specific antibiotic resistance, which is usually conferred by a
plasmid carrying the antibiotic resistance gene. The E. coli ampicillin resistance gene, whose nucleotide sequence is pBR322, encodes a penicillin O-lactamase [771.
Ampi-cillin is a
#-lactam
antibiotic that can kill Gram-positive and some Gram-negativebacteria. It almost does not affect the growth of E.coli when the concentration is
appropriate and will delay the log phase when the concentration is relatively high
1781. Therefore, we add ampicillin in an appropriate volum to the LB media, so as to prevent the growth of other bacteria and not delay the growth of E.coli.
3.2.2
Protocols to make LB agar
The protocol to make IL of LB agar (makes about 50 LB agar plates):
1. Weight out the following into a IL Erlenmeyer flask: 10g NaCl, 10g Tryptone, 5g Yeast Extract, 15g Agar. And add deionized water to 1L.
2. Swirl to mix.
3. Cover the top of the bottle and lable with autoclave tap.
4. Autoclave on the liquid setting for 40 minutes.
5. After removing the solution from the autoclave, put them into water-bath to cool to 55 *C.
6. Add Ampicillin 100 pg/mL to the solution and swirl to mix.
7. Keep your bench area sterile by working near a flame or bumsem burner.
8. Pour 20mL of LB agar per 10cm polystyrene Petri dish.
9. Place the lids on the plates and allow them to cool until solidified, then invert the plates.
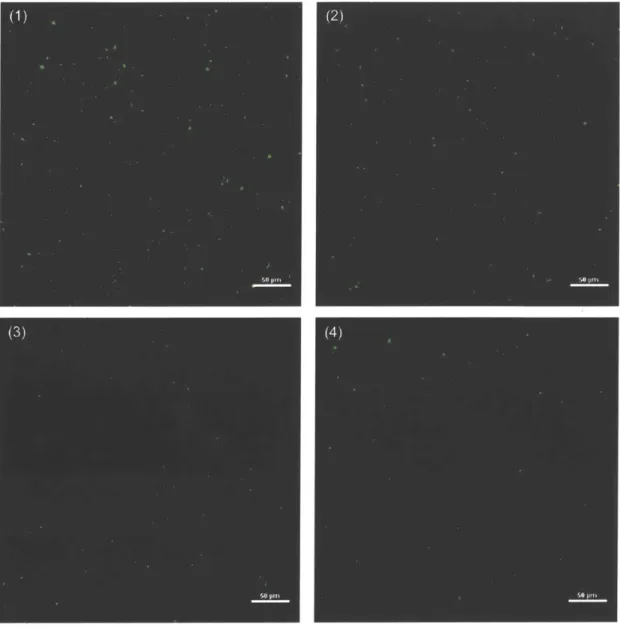
--Figure 3-2: Echerichia coli GFP 0157:H7 with four different cell concentrations under microscope. The OD6 00 is: (1) 0.744, (2) 0.372, (3) 0.186, (4) 0.093. They produce
3.2.3 E.coli culture from -80 'C freezers Culture bacteria from glycerol stocks
1. Take E.coli from -80 'C freezers, put them in ice/ dry ice.
2. Keep your bench area sterile by working near a flame or bumsem burner.
3. Label the bottom of the plate with the plasmid name, the date, the antibiotic
resistance, your name.
4. Using a sterile inoculate tube, touch the bacteria growing within the punctured area of the stab culture or the top of the glycerol stock.
5. Gently spread the bacteria over a section of the plate.
6. Incubate plate with newly plated bacteria for 24 hours at 37 'C.
7. In the next day, colonies should be visible. A single colony should look like a white dot growing on the solid medium. This dot is composed of millions of genetically identical bacteria that arose from a single bacterium.
Inoculating a liquid bacterial culture
1. Using an inoculate tube, a sterile pipette tip or toothpick, select a single colony
from your LB agar plate.
2. Drop the tip or toothpick into the liquid LB + antibiotic and swirl.
3. Loosely cover the culture with a cap that is not air tight, or leave at least half
of the tube with air.
4. Incubate bacterial culture at 37 'C for 8 - 10 hours (in the exponential phase
according to the growth curve) in a shaking incubator.
Creating Bacterial Glycerol Stocks
Bacterial glycerol stocks are important for long-term storage of plasmids. If you freeze the glycerol stock tube at -80 'C. The stock will be stable for years.
1. Follow the steps in Section 3.2.3.
2. Make the 50% glycerol solution by diluting 100% glycerol 1:1 in dH20.
3. After you have bacterial growth, add 500 ML of the overnight culture to 500 AL
of 50% glycerol in a 2 mL screw top tube and gently mix. 4. Shake the tube to make sure no bubbles in the mixed solution.
5. Put the tube in the dry ice as soon as possible and move them to the -80 'C
freezer.
6. To recover bacteria from the glycerol stock, open the tube and use a sterile
inoculate tube to scrape some of the frozen bacteria off of the top and follow the steps in Section 3.2.3. Do not let the glycerol stock unthaw!
We measured the growth curve of E.coli and found that the concentration of bacteria in LB media saturates at OD6 0 0 equal to 0.654 (Table. ??) after 8 to 10
hours (Figure 3-3). OD6 0 0 is the absorbance of a sample measured at a wavelength
of 600 nm. It is a common method for estimating the concentration of bacterial in a liquid and indicating the stage of cultured cell population
[79].
To guarantee the quality of bacteria (prevent the generation of old cells and death cells), we used fresh bacteria typically cultivated for 10 hours.3.2.4 Purification
When bacteria solutions is needed, first LB medium is washed of to ensure not du-plication in the solution used. We wash bacteria with minimal medium two times by centrifugation (10 mn at 5000 rpm), then they are resuspended in deionized water or other media. Indeed, we also investigated two minimal media: phosphate-buffered
0.7 0.6- 0.5e 0.4 Q 0.3 - 0.2- 0.1-04 0 5 10 15 20 25 time (hour)
Figure 3-3: Measured E. coli growth curve using OD6 0 0 in LB medium. We can see
that after 10 hours the concentration becomes stable
saline (PBS) and phosphate buffer (KP). PBS is a water-based salt solution contain-ing disodium hydrogen phosphate and sodium chloride. Second, the bacteria solution
was diluted use spectrophotometry (OD60 0 measurements) to estimate and adjust the
concentration of bacteria.
We used a C-chip hemacytometer to count the cell concentration of E. coli in different solutions and at different OD6 0 0 (Figure 3-4). As expected, the relationship between OD6 0 0 and cell concentration is linear in a wide range of concentration.
3.3
Behavior of the bacteria liquid
3.3.1
OD and pH evolution
In order to observe the behavior of bacteria in the new solution, we measured the evolution of OD6 0 0 and pH of bacteria solution in different concentrations. The results
show that OD6 00 and pH remain stable within 24 hours (Fig. 3-5, Table.3.1), which
1A x108 0 0 12 10 8 6 4 2 0 0.2 0.4 0.6 0.8 1
Figure 3-4: E. coli concentration as a function of the optical density at 600 nm
(OD6 0 0) in three different media: deionized (DI) water, and two other minimal
solu-tions of salt: phosphate buffer (KP), and potassium phosphate buffer (PBS).
time High (H) Middle (M) Low (L) Ultra Low (UL) PBS DI water Oh 6.82 6.89 6.77 6.83 6.87 5.79 0.5h 6.71 6.72 6.74 6.79 6.82 5.99 1h 6.71 6.72 6.75 6.95 6.75 5.69 1.5h 6.70 6.68 6.67 6.69 6.76 5.95 2h 6.74 6.73 6.77 6.76 6.79 5.82 pH value 2.5h 6.74 6.73 6.77 6.76 6.79 5.52 3h 6.67 6.68 6.70 6.70 6.72 5.89 3.5h 6.59 6.51 6.69 6.58 6.71 6.10 4h 6.58 6.72 6.76 6.62 6.69 5.71 24h 6.71 6.78 6.75 6.72 6.82 5.76 48h 6.74 6.72 6.73 6.76 6.76 5.96 72h 6.78 6.76 6.74 6.79 6.82 5.52
Table 3.1: The pH evolution of E.coli with four different initial concentrations. The
pH did not change a lot
I I II
-.- DI water
- -.- KP
-.- PBS
-1 0.9 0.8 0.7 0 -- IHigh -f- Middle -+-Low
-i- Ultra Low
-.- PBS DI water 0.6 0.5 - 0.44- 0.3-0.2 1.1 - a
tZL-
-Vx-I
a~i
0 - -0 5 -- - - - - - - - - - - - - - - - - - I-10 15 20 25 Time (hours)Figure 3-5: OD6 00 value of E.coli with five different initial concentrations. These time evolution show that E. coli in PBS do not grow, regardless of their initial con-centration.
Figure 3-6: Bacteria phosphate buffer (KP) solution. From left to right, the concen-tration of bacteria increases, so that the transmittance of light decreases. However, surface tension changed little with concentration. Scale bar is 1 cm.
3.3.2 Surface tension
In addition, we also measure the surface tension of bacteria with different concentra-tions in two different minimal media to observe whether the concentration of bacteria will change the surface tension or not. We used tensiometer (Figure 3-6) to measure the surface tension by the pendant drop methods. A drop was produced by a needle, and then captured by camera. The drop profile is detected and can be used to find the value of the surface tension [80]
Figure. 3-7 shows the results of surface tension change with the concentration of bacteria in two different media. The result show that the surface tension did not change with bacteria concentration within the test range. This is important as we would like to test the contamination of bubbles in a manner that does not alter fundamentally their physics. Note however, that the effect of bacterial concentration could be subtle, involving dynamic rather than static surface tension changes. Indeed, clustering effects on the interface and increase of secretion of surfactant by such clusters of organisms could introduce small local gradients of surface tension, which can, in turn, drive distinct and rich surface dynamics on the bubble cap. Our focus in this thesis is to develop a method to visualize directly, quantify, and calibrate the particle or organism load in the bubble films. We shall discuss this further in the next chapter.
80 -f media:PBS -75 65 0 0.5 1 1.5 2 2.5 ODoo 80 ( media:KP 75 -S70- -65 0 0.5 1 1.5 2 2.5 OD600
Figure 3-7: The surface tension of bacteria with different concentrations in different
solutions. We can see that the concentration of bacteria will not change the surface tension of the solution in either PBS or KP.
Chapter 4
Schlieren imaging and design of the
experiments
4.1
Introduction
As discussed in the first chapter, bubbles play essential roles in exchanging materials from water to the air. However, bubbles are small, and the particles inside bubbles are even smaller. Conventional imaging does not allow for visualization of particle movement on or in bubbles [81]. Due to this gap in direct visualization, the details of the interaction between small particles and bubbles remain speculative. To capture the fluid motion and particle movement in bubbles, we employed Schlieren imaging
[811 to visualize inhomogeneities of the bubble cap. With this method, the number
and movement of small particles such as bacteria and microspheres present in the bubble film can be readily observed. Using Schlieren imaging, we can observe black spots resulting from the presence of bacteria, but these spots are much larger than the bacteria themselves (Figure.4-1). The goal of this work is to calibrate the Schlieren spot size with the size of the original object. Indeed, we will see that the meniscus surrounding particles in the cap film shapes the Schlieren spot size observed. This is important from a fundamental point of view to understand contaminant-interface interactions in dynamic objects such as those of bubble caps. This is also important from a practical point of view to develop ways of tracking accurately the interaction
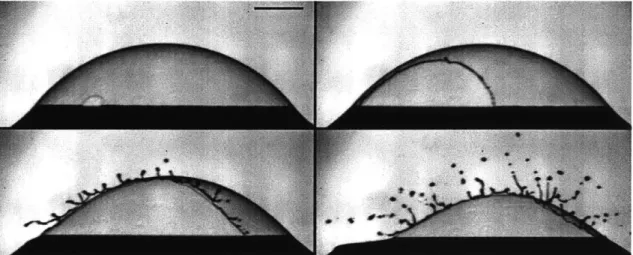
Figure 4-1: E. coli in a bubble film. The concentration of bacteria is approximately
5 x 10⁸ cells/ml in DI water. The times are t =10, 26, 29, and 36s. The corresponding
bubble cap thickness are h = 2.5, 1.3, 1.1, and 0.9 pm. Scale bar is 1mm. Reproduced
from [1].
and changes in morphology and numbers of organisms or communities of organisms in situ on interfaces. This include, tracking cell division, interaction between organisms to study their predatory or cooperative dynamics and many more possibilities.
4.2
Bubble cap film thickness
The bubble cap film thickness controls the number, size, and speeds of droplets emit-ted at burst [43], therefore controlling the efficiency of the exchange of chemicals and pathogens from water to air (Chapter 1). Figure 4-2 shows an example of how we estimate the thickness of the bubbles at burst: we measure the speed of the hole nu-cleating on the bubble during its burst with precise image processing which is directly linked to the bubble thickness [82, 831. In figure 4-3 we report our measurements of the thickness of bubble films as they burst after different lifetimes at the surface: older bubbles are thinner, they therefore generate smaller and faster droplets [43]. This also shows that the bubble cap film reaches a thickness of the order of 1 Am at long lifetimes, which is close to the size of the bacteria we study, E. coli. As we shall see in the next sections, this is why we are able to observe large Schlieren spots (Fig. 4-1 and 4-2) on old bubbles. We examine next how particles interact with films.
t= 0.00
Ms
t
=
0.15 ms
t
=
0.25 ms
Figure 4-2: Measurement of the bubble cap film thickness. A needle punctures the film and creates a hole that recedes at constant speed Uc, related to the film thickness
by Taylor-Culick relationship: U, = V2o/ph, where h is the film thickness, o the surface tension and p is the density of fluid.
- - ----*1 10
8-6-6 01 ** . 2 -0%.. * 0
0
10
20
30
40
t
(s)
Figure 4-3: Bubble cap film thickness time evolution in deionized water inoculated with E. coli at OD,00 = 0.474. Each point correspond to a single bursting bubbles. The longer bubbles stay at the surface, the thinner they are.
4.3
Deformation of thin films
When a particle is present in a liquid film whose thickness is less than the particle diameter, a meniscus forms around the particle due the deformation of the fluid interface (Figure. 4-4). Danov et al. [9] derived the shape of this meniscus for a spherical particle. It is characterized by z = ((x, y) (Figure. 4-4) and follows Laplace
equation:
UV(
1(1 + IV(12)/2 P 41
where o is the surface tension, Pc is the capillary pressure (the pressure difference across the meniscus), and V is the two-dimensional gradient operator in the plane of the film. When the particle only slightly deforms the interface, the slopes are small
(V( < 1) and equation (3.1) simplifies to:
c -Ac ho
2 rc
Figure 4-4: Particle entrapped in a thin liquid film of thickness ho, which is smaller than the particle diameter 2rp. 0, is the contact angle between the fluid in the film and the particles. Figure adapted from
[9].
with
1C= - (4.3)
the capillary length, the characteristic decay length of the interfacial deformation,
p the water density and g is the acceleration due to gravity; This is a well know
differential equation that can be solved to yield [9]:
(()=AKo ()(4.4)
where r is the radial distance from the particle center, KO is the modified zero order Bessel function of second kind, and A is a constant of integration that depends on the film thickness, particle radius, particle wetting properties. We shall determine the relationship between these three variables next.
4.4
Schlieren visualization
4.4.1
Bacteria and particles in bubbles
When bacteria are present in a thin bubble film they can deform it as explained above. Figure 4-1 shows E. coli revealed in a bubble cap film with Schlieren imaging. E.coli are typically rod shaped, about 2.0 pm in length and 0.25 to 1 pm in diameter. In this figure, it is clear that we are not able to visualize E. coli when the bubble cap is
lens lens lens Schheren object lens camera
point light pinhole test area
source
Figure 4-5: Diagram of a Schlieren setup. Rays from an initial light sources go through 3 lenses and a pinhole to generate parallel beams. In the test area, light is deflected when it encounters a change of optical index, such as when going through a bubble. The beam are then refocused on the sensor of a camera.
too thick. However, when it lives long enough to reach thicknesses that are less than approximately 1.5 1Lm, the typical the length of E.coli, large dark spots are observed. They originate from the meniscus profile derived in the previous section.
Light propagates uniformly in homogeneous media, but when a parallel beam travels through a region of nonuniform density, or of distinct refractive index, it is deflected. Schlieren imaging takes advantage of this property to reveal such density variations [81, 84]. Here, we use it to visualize variations of thicknesses in the caps of bubbles. We set up a Schlieren system with a point light source, a pinhole, four lenses, and a camera (Figure.4-5) and used it to visualize bubbles (e.g., Fig. 4-1 and 4-2). To verify that what we observe with bacteria on bubbles in Figure 4-1 is consistent with the meniscus profile derived in 4.3, a ray-tracing algorithm was developed to simulate Schlieren images of such menisci. This is illustrated Figure 4-6(a - c): parallel light arrives perpendicular to a thin film which contain a particle
that deforms the film according to Eq.(4.4). Our optical experimental setup is then simulated to obtain a numerical estimation of what would be observed on our camera. Clearly, the film thickness plays an important role also in the spot size, hence the importance of measuring it directly as well for this calibration of spot to particle size. Recall that we can measure film thickness as shown in figure 4-2.
The simulated images are very similar to what we observe when we seed bubbles
with bacteria (Fig.4-1) particles of different sizes ( Figure 4-6(d)).
(a) (b) Vater film Lens Filter Screen (c) Schlieren spot E WinE Particle Water film Length (mm) (d) d, 100 pm 10 pm 6.3 pm 4.5 pm 3.2 pm
Figure 4-6: Numerical Schlieren visualization of a meniscus around a particle in a thin film (a). After parallel light goes through the meniscus, the Schlieren optical setup (b) acts as a magnifier: the trace of the particle on the camera sensor (c) is larger than the particle itself. Schlieren images of menisci from experiments (d) show a very good agreement with the simulation (Scale bars: 100 Am).
in bubble films can be obtained from Schlieren. However, obtaining precise data with bacteria and on bubbles is very challenging. First, the thickness of bubbles changes
with the age of the bubble (Figure 4-3). Second, the size of the meniscus profile is
also difficult to measure due to the continuous movements of the bubble at the surface and to its curvature.
To gain insights and obtain a calibration between the spot and particle sizes, we move on to an analog system: particles in a flat soap film. The advantage is the control of particle size and shape and the more precise evolution of its film thickness.
4.4.2 Particles in flat films
The thickness gradients of a soap film can be observed by interference fringes color matching [85], which results in more precise measurements than an estimation of the Taylor-Culick speed on bubbles (Fig. 4-3). We also use commercial spherical particles of known diameter and geometry.
Figure 4-7 shows Schlieren images of particles on a flat films, where Schlieren spots
Figure 4-7: Particles in a flat soap film. The upper one is particle with diameter =
0.5 tim, the lower one is particle with diameter = 2 pm. Scale bar is 1 cm. g is the direction of gravity.
are also clearly identified. A soap film drains due to gravitational drainage, and its upper part is therefore thinner than its lower part. This explains why we are able to observe 0.5 pm particles at the top of the soap film, but only 2 Pm particles at the bottom when using two different sizes of particles.
4.4.3
Rods in bubbles
The experiments described previously show that when the film thickness is close to the size of the perturbation, the micrometric particles or bacteria can be observed with regular Schlieren imaging. However, the precise relationship between the spot size, particle size, and wetting properties of the particle are experimentally challenging.
A first simplifying assumption consists in neglecting the influence of the film
thick-ness. To do so, we pierce bubbles (Fig. 4-8) or flat soap films (Fig. 4-10) with cylindrical rods much larger (50 to 100 times) than the film thickness. Figure 4-8 shows a bubble with a rod through it: a Schlieren spot, much larger than the rod
I
z


![Figure 1-4: Representation of organic material inside and on the ocean Surface Mi- Mi-crolayer (SML) [7].](https://thumb-eu.123doks.com/thumbv2/123doknet/14163182.473525/19.917.146.763.133.496/figure-representation-organic-material-inside-ocean-surface-crolayer.webp)