HAL Id: hal-01172713
https://hal.sorbonne-universite.fr/hal-01172713
Submitted on 7 Jul 2015HAL is a multi-disciplinary open access archive for the deposit and dissemination of sci-entific research documents, whether they are pub-lished or not. The documents may come from teaching and research institutions in France or abroad, or from public or private research centers.
L’archive ouverte pluridisciplinaire HAL, est destinée au dépôt et à la diffusion de documents scientifiques de niveau recherche, publiés ou non, émanant des établissements d’enseignement et de recherche français ou étrangers, des laboratoires publics ou privés.
Combined 3DISCO clearing method, retrograde tracer
and ultramicroscopy to map corneal neurons in a whole
adult mouse trigeminal ganglion
Pierre-Serge Launay, David Godefroy, Hanen Khabou, William Rostene,
José-Alain Sahel, Christophe Baudouin, Stéphane Melik-Parsadaniantz,
Annabelle Reaux-Le Goazigo
To cite this version:
Pierre-Serge Launay, David Godefroy, Hanen Khabou, William Rostene, José-Alain Sahel, et al.. Combined 3DISCO clearing method, retrograde tracer and ultramicroscopy to map corneal neurons in a whole adult mouse trigeminal ganglion. Experimental Eye Research, Elsevier, 2015, 139, pp.136-143. �10.1016/j.exer.2015.06.008�. �hal-01172713�
Section: Methods article
COMBINED 3DISCO CLEARING METHOD, RETROGRADE
TRACER AND ULTRAMICROSCOPY TO MAP CORNEAL
NEURONS IN A WHOLE ADULT MOUSE TRIGEMINAL
GANGLION
LAUNAY Pierre-Serge1,2,3, GODEFROY David1,2,3, KHABOU Hanen1,2,3, ROSTENE William1,2,3, SAHEL Jose-Alain1,2,3,4, BAUDOUIN Christophe1,2,3,4, MELIK-PARSADANIANTZ Stéphane1,2,3, REAUX-LE GOAZIGO Annabelle1,2,3*.
1 INSERM, U968, Paris, F-75012, France
2 Sorbonne Universités, Université UPMC, Paris 06, UM 80, Institut de la Vision, 75012 Paris, France
3 CNRS, UMR 7210, Paris, F-75012, France
4 Centre Hospitalier National d’Ophtalmologie des Quinze-Vingts, Paris, F-75012, France
* Correspondence:
Annabelle REAUX-LE GOAZIGO Institut de la Vision
UMR S 968 Inserm/ UPMC/ CNRS 7210 17, rue Moreau 75012 Paris
Phone :+ 33 1-53-46-25-72 annabelle.reaux@inserm.fr
Running title: Corneal neurons, somatotopy, 3DISCO method, trigeminal ganglion. Abbreviations:
Cholera toxin subunit B (CTB), trigeminal ganglion (TG), ophthalmic branch (V1), maxillary branch (V2), mandibular branch (V3).
ABSTRACT
Tissue clearing and subsequent imaging of intact transparent tissues have provided an innovative way to analyze anatomical pathways in the nervous system. In this study, we combined a recent 3-dimensional imaging of solvent cleared organ (3DISCO) procedure, light-sheet microscopy, fluorescent retrograde tracer, and Imaris software to 3D map corneal
sensory neurons within a whole adult mouse trigeminal ganglion (TG). We first established the optimized steps to easily and rapidly clear a fixed TG. We found that the 3DISCO procedure gave excellent results and took less than 3 hours to clear the TG. In a second set of experiments, a retrograde tracer (cholera toxin B Alexa 594-conjugated) was applied to de-epithelialized cornea to retrograde-labeled corneal sensory neurons. Two days later, TGs were cleared by the 3DISCO method and serial imaging was performed using light-sheet ultramicroscopic technology. High-resolution images of labeled neurons can be easily and rapidly obtained from a 3D reconstructed whole mouse TG. We then provided a 3D reconstruction of corneal afferent neurons and analyzed their precise localization in the TG. Thus, we showed that neurons supplying corneal sensory innervation exhibit a highly specific limited dorsomedial localization within the TG. We report that our combined method offers the possibility to perform manual (on 20 µm sections) and automated (on 3D reconstructed
trigeminal ganglion) counting of labeled cells in a cleared mouse TG. To conclude, we illustrate that the combination of the 3DISCO clearing method with light-sheet microscopy, retrograde tracer, and automatic counting represents a rapid and reliable method to analyze a subpopulation of neurons within the peripheral and central nervous system.
Keywords: clearing method, 3DISCO, neurons, somatotopy, trigeminal ganglion, cornea,
INTRODUCTION
The cornea is the most densely innervated tissue of the body (Muller et al., 2003; Muller et al., 1996; Muller et al., 1997). The corneal sensory nerve fibers originate from neuronal cell bodies located in the ipsilateral trigeminal ganglion (TG) (Felipe et al., 1999; Marfurt and Del Toro, 1987; Marfurt et al., 1989). The TG is composed of three nerve branches: (i) the ophthalmic branch, V1, (ii) the maxillary branch, V2, and (iii) the mandibular branch, V3, each branch having its own primary sensory neurons organized inside the ganglion (Marfurt et al., 1989).
Until now, published studies in the literature have reported the distribution of TG neurons supplying the corneal innervation by means of classical histological approaches. All of these studies used serial TG tissue sections from animals whose corneas were treated with various retrograde tracers (such as Cholera toxin subunit B (CTB), Fast blue, Fluorogold,
horseradish peroxidase (HRP), wheat germ agglutinin (WGA), etc) (Bron et al., 2014;
Ivanusic et al., 2013; Marfurt and Del Toro, 1987). However, these procedures required serial sections, microscopic analysis, and manual cell counting, all of which are time consuming (Bron et al., 2014; Ivanusic et al., 2013; Marfurt and Del Toro, 1987). The only way to obtain spatial organization of cells in tissues was to obtain sections and image the cells by epifluorescence, confocal, or two-photon microscopy. Unfortunately, these methods are not suitable to perform spatial reconstruction in large and thick tissues (up to 500 µm of thickness). Nowadays, new technologies have arisen to help scientists overcome this optical limit. For the last three years, several groups have developed new tissue clearing methods for enhanced imaging of entire tissues: ClearT (Kuwajima et al., 2013), SeeDB (Ke et al., 2013; Ke and Imai, 2014), ScaleA (Hama et al., 2011), CLARITY (Chung et al., 2013; Tomer et al., 2014), PACT/PARS (Yang et al., 2014), CUBIC (Susaki et al., 2014; Tainaka et al., 2014), and 3-dimensional imaging of solvent cleared organ (3DISCO) (Erturk and Bradke, 2013;
Erturk et al., 2014). When combined with subsequent light-sheet laser scanning microscopy
(Dodt et al., 2007), 3DISCO, offers the possibility of imaging entire transparent organs without the need for sectioning (Dodt et al., 2007; Erturk et al., 2012; Erturk and Bradke, 2013).
In this study, we report the 3D mapping of corneal afferent neurons within the adult mouse TG using the 3DISCO clearing method. More interestingly, we combined this procedure with a fluorescent retrograde tracer, light-sheet microscopy, and automated counting using Imaris software to rapidly obtain a 3D somatotopy of corneal neurons in the entire TG. Here, we provide evidence that clearing a whole mouse TG (containing retrograde labeled neurons) with 3DISCO and light-sheet microscopy imaging allows to obtain, in one day, a precise somatotopy of a specific neuronal population in solvent-cleared tissue.
2. Materials and supplies
2.1 Supplies
Surgical blade (Swann-Morton Ref. S0201)
70% ethanol solution (Ethanol 100% Sigma-Aldrich Ref. 32221, v70EtOH100%/v30H20) Ophthalmic gel (Dechra, Lubrithal Eye Gel, 10g)
Cholera toxin subunit B (CTB)-Alexa Fluor 594 conjugate (Cell Signaling, Danvers, MA, USA, Ref. C34777)
1x PBS (Gibco, Ref. 10010-023)
Paraformaldehyde (Sigma-Aldrich, Ref. 441244) Stuart tube rotator (model SB3)
Tetrahydrofuran absolute, over molecular sieve, containing ~ 0,025% 2,6-di-tert-butyl-4-methylphenol as stabilizer ≥ 99,5% THF (Sigma-Aldrich, Ref. 87371)
Dichloromethane (DCM, Sigma-Aldrich, Ref. 270997) Dibenzyl ether (DBE, Sigma-Aldrich, Ref. 108014)
2.2 Equipment
Binocular microscope (World Precision Instrument, Ref. 502000).
Ultramicroscope (LaVision Biotec) equipped with an Olympus binocular body (MXV10) and an Olympus objective MVPLAPO 2XC with variable magnification from 0.63x to 6.3x and equipped with a PCO Edge SCMOS camera: Scientific low noise CMOS camera Sensors CMOS, CIS 2051 Pixel (2560 x 2160 pixel, pixel size 6.5 x 6.5 µm2, LaVision Biotec).
ImageJ 1.48 Software was downloaded from the website (http://imagej.nih.gov/ij/download.html).
Computer Intel® Core™ i7-3930 with powerful graphic card NVIDIA GeForce GTX 560 and 64 gigabytes of RAM. 3D.
2.3 Fluorescent retrograde tracer preparation
CTB-Alexa Fluor 594 conjugate was prepared at a concentration of 1µg/µL in 1x PBS.
2.4 Experimental animals
Adult male C57BL/6 mice weighing 30 g (Janvier Labs, Le Genest Saint Isle, France) were maintained under controlled conditions (22 ± 1 °C, 60 ± 10% relative humidity, 12/12 h light/dark cycle, food and water ad libitum). All procedures were in strict accordance with the guidelines for the care and use of experimental animals approved by the French National Institute of Medical Research (INSERM) and national and international law and with policies for the use of animals in Research in Vision and Ophthalmology (European Communities Council Directive 86/609/EEC, Authorization No. 75-1235 Granted to A. R-LG).
3. Detailed methods
3.1 Retrograde tracing experiments and tissue preparation
To identify the corneal afferent neurons in the TG, we used CTB-Alexa Fluor 594 conjugate as a tracer. Animals were anesthetized intraperitoneally with a mixture of Ketamine 1000 U (100 mg/kg body weight) and xylazine (10 mg/kg body weight, Virbac, France). Only the left eye was processed in these experiments. The right eye was maintained hydrated during the surgery by placing a drop of ophthalmic gel.
Under a binocular microscope, a filter paper disc (3 mm in diameter) soaked with 70% ethanol solution was positioned in the corneal surface and left in place for 30 seconds. The disc was then withdrawn and the corneal epithelium of the left eye was removed using a
surgical blade. It is important to note that the same experimenter routinely managed this surgical procedure. Using a fluorescein test and under slit lamp examination in another group of animals, the experimenter has previously quantified that nearly 90% of the surface of the corneal epithelium was removed (data not shown).
A total of 1 µl (5 applications of 0.2 µl using a 10 µl tip) of CTB-Alexa 594 solution (1µg/µl in 1x PBS) or 1 µl of 1x PBS (control mice) was meticulously placed in the damaged left cornea under the binocular microscope to avoid diffusion of the CTB solution outside the de-epithelialized cornea. As control conditions, we also applied CTB solution on healthy cornea. The solution was maintained in contact with the cornea for 10 minutes. This experimental approach allows the tracer to be taken up by central and peripheral corneal nerve fibers and not surrounding tissues. Animals were left to recover from anesthesia in their cages.
3.2 Tissue preparation
Two days after the CTB application, PBS- or CTB- treated mice were deeply anesthetized with Ketamine 1000 U (100 mg/kg) /Xylazine (10 mg/kg, Virbac, France). Animals were then perfused via the ascending aorta with 10 ml of 0.9% saline followed by 40 ml of 4% paraformaldehyde in PBS (0.1 M, pH 7.4). After fixation, TGs were gently dissected out. During the dissection, it was important to keep the mandibular branch (V3) intact, which constitutes an anatomical landmark during image acquisition under the ultramicroscope. To limit tissue autofluorescence, TGs were not post-fixed in 4% paraformaldehyde, but were placed in 1x PBS solution at 4°C until the 3DISCO clearing-tissue procedure.
3.3 3DISCO clearing method
We adapted the 3DISCO clearing method previously described by Erturk et al. (Erturk et al., 2012; Erturk and Bradke, 2013) for clearing adult mouse TGs. All of the following steps
(Table 1) were performed under agitation and rotation (14 rpm speed) at room temperature. TGs were placed in 15 ml falcon tubes, and incubated in 15 ml of 50% tetrahydrofuran (THF) solution for 30 min. The TGs were then placed in 80% THF (vol/vol) solution for 30 min, and then for 2 x 30 min in 100% THF solution. The TGs were then incubated in 5 ml of 100% dichloromethane solution for 10-20 min. Finally, the TGs were cleared in 15 ml of dibenzyl ether (DBE) for an unlimited time until image acquisition.
3.4 Ultramicroscopy imaging
Samples were imaged on a light-sheet microscope. The ultramicroscope device is adapted on a 100% quartz imaging reservoir where light sheet illuminates and crosses cleared samples. The refractive index (index ɳ = 1,56) between the sample and imaging solution renders the sample completely clear. We performed light sheet serial imaging at wavelength 488 or 561 nm (Coherent Sapphire Laser, LaVision Biotec) in 1 µm incremental steps of the entire TG using the 1.6 x or 4 x objective (for higher magnifications) with lens capable of capturing a large visual field with low working distance. We performed 488 nm (power: 56%) and 561 nm (power: 80%; depending on the brightness of the retrograde cellular bodies) wavelength acquisitions. Using an Alexa-594 conjugated retrograde tracer, a 488 nm acquisition was required to avoid false positive signal. Ultramicroscopy generated high-resolution 16 bit images (11 megabytes in size). On average, one reconstructed TG required 800 to 900 images acquired from the ventrodorsal region and weighed almost 10-15 gigabyte.
3.5 Image processing
For the reconstruction of entire adult mouse TGs, we used the Imaris 7.6.1 software (Bitplane, Zurich, Switzerland, http://www.bitplane.com/imaris/imaris) piloted by an efficient computer with an Intel® Core™ i7-3930 processor and a powerful graphic card NVIDIA GeForce GTX
560 and 64 gigabytes of RAM. 3D reconstructions of the TG were obtained from all the acquired light-sheet images and assembled in space by the software.
3.6 Image analysis, automatic and manual cell counting
3.6.1 Automatic procedure
Using the Imaris software, the parameters for spot detection (corresponding to retrograde labeled neurons) were the following: spot diameter set at 10 µm (corresponding to the smallest diameter of the spot we wished to detect) and the threshold of mean grey value was manually set to have a better ratio between positive signals and background by selecting the ‘quality’ option. The total cell count (obtained with these settings) is obtained by clicking on the statistics tab. The reconstruction and the cell counting in whole cleared TG require 15 min. Videos were done using the animation option of Imaris software set at 24 frames per second.
3.6.2 Manual procedure
ImageJ 1.48 was downloaded from the website and used for manual counting. Twenty individual images (incremental steps of 1µm each, 16 bit) acquired under the ultramiscroscope were stacked to obtain a 20 µm-stacked image (Z projection, Projection type: Max intensity). To reconstruct an entire mouse TG, 25-30 stacks were required. After being reconstructed, a region of interest (ROI) of the TG was manually defined in the spot item in order to cover all the retrograde-labeled corneal neurons in x,y,z axes. Only spot diameters greater than 10 µm were included in the quantification. The manual reconstruction and cell counting of the whole TG required at least 1 h.
RESULTS
In this study, we report the 3D distribution of retrograde-labeled corneal neurons in a whole adult mouse TG using a combination of the 3DISCO clearing method, light-sheet microscopy, and fluorescent retrograde tracer.
Optimal steps for clearing an adult fixed mouse TG with 3DISCO
According to the criteria of time, quality of clearing, tissue expansion and cost, 3DISCO is an excellent clearing method for our purpose (Table 1). In our hands, this is a highly reproducible, rapid, inexpensive, and straightforward method. In addition, a sample cleared with 3DISCO can be easily and quickly imaged with ultramicroscopy. In this study, we first determined the optimal steps for clearing the adult mouse TG with the 3DISCO method (Table 2). We observed that it is crucial not to maintain the TG in a 4% PFA solution after the dissection but to keep it in 1X PBS at 4 °C to avoid autofluorescence of the tissue. In addition, TGs were kept in the dibenzyl ether (DBE) solution at the end of the clearing procedure until image acquisition.
As illustrated in Figure 1, mouse TG was cleared after the 3DISCO clearing procedure. We observed that the tissue exhibited a slight shrinkage after clearing (Fig. 1A and B). In addition, the clearing steps made the tissue firm but sufficiently malleable. To prevent any fragmentation of the tissue, careful manipulation of the cleared TG was crucial, particularly when fixing it onto the plastic holder located in the DBE reservoir before image acquisition.
Cleared TGs were then imaged by light-sheet microscopy (Fig. 1C) in the final clearing DBE solution (which has the same refractive index as the cleared tissue), allowing light to penetrate throughout the tissue.
Somatotopy of retrograde-labeled corneal neurons in whole cleared mouse TG
For the labeling of sensory TG neurons innervating the cornea, a retrograde fluorescent tracer (CTB-Alexa Fluor 594 conjugate, CTB-594) was placed on a de-epithelized mouse cornea (Fig. 2, schematic diagram). Two days after treatment, TGs were dissected out, cleared, and placed in the DBE reservoir. Serial images of 1 µm optical sections from the dorsal to the ventral part of the TG were then acquired. Acquisitions at 561 nm highlighted bright cell bodies corresponding to the retrograde-labeled cells containing CTB-594. Interestingly, most of the neurons supplying the corneal innervation were found in the dorsomedial part of the TG (Fig. 2A, panel 2, arrows). We noted that the corneal neurons decreased in number in the ventral part of the ganglion (Fig. 2A, panels 3-6). A 3D reconstruction of the intact TG was then built from individual images (Fig. 2B). The cleared reconstructed TG displays a homogenous internal light autofluorescence at 561 nm and 488 nm, allowing visualization of the morphology (including the mandibular V3 branch) of the entire TG (Fig. 2A and B). Furthermore, no staining was observed with light sheet microscopy at 561 nm in control mice (cornea treated with 1x PBS) (Movie 1) and in control mice receiving CTB-594 on healthy corneas (data not shown). Under 488 nm illumination, we did not observe any false positive staining (Fig. 2B-C).
One advantage of this technique is that the virtual reconstructed TG can be observed from any angle. For example, Figure 2 (panels B-C) represents two consecutive views obtained after rotating the TG from 0 to 90 degrees. Under 561 nm illumination, we observed that most of the retrograde-labeled corneal neurons were distributed in the dorsomedial part of the mouse TG (Fig. 2B, panels 1-3), opposite to the mandibular V3 branch. In agreement with our previous observations made from optical sections, the main population of corneal neurons was mostly located in the dorsomedial part of the ganglia (Fig. 2C, panels 1-3). Movie 2 (built and piloted by Imaris software) shows the somatotopy of corneal neurons.
Another advantage was the ability to easily obtain high-resolution images of ROIs. Figure 3 illustrates images obtained with a 3D reconstructed TG with a numerical 4x objective. At a higher magnification (Fig. 3, panels B-D), we observed a heterogeneous population of labeled neurons: the uptake of the CTB occurs in small- and medium-sized neurons in the TG (Fig. 3, panels C, D). In addition, some scattered nerve fibers containing CTB-594 were also detected in the entire TG (Fig. 3).
Manual and automated counting of corneal retrograde-labeled neurons
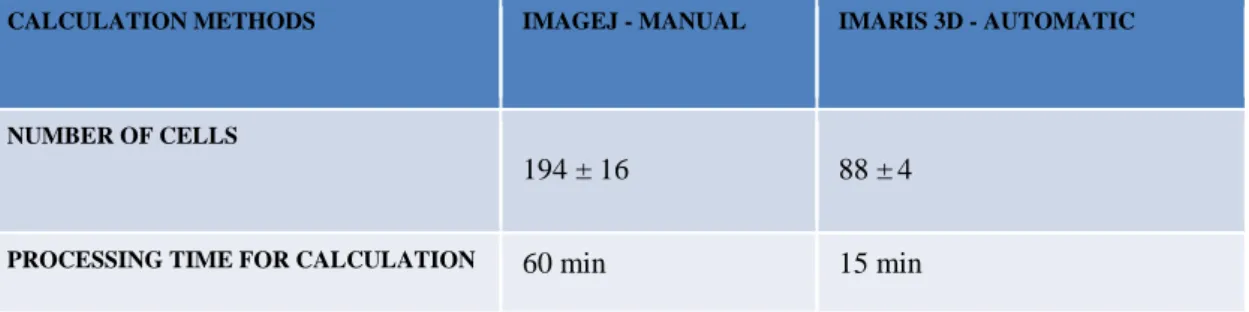
An important application of volume imaging is the possibility to quantify a neuronal population more easily than on tissue sections. Here, we compared two methods of cell counting (manual and automated) to quantify the number of positive cells in the mouse TG. We first performed a manual cell count using ImageJ software on reconstructed 20 µm stacked images (Z projection, Projection type: Max intensity). Twenty-five to 30 stacks of 20 µm were needed to reconstruct the entire mouse TG. In our experimental conditions, we found a sample population of 194 ± 16 labeled neurons. This manual method for counting neurons was time consuming and required almost 1 h for each TG (Table 3).
We then compared these results with the automated counting method using Imaris Software in a 3D reconstructed mouse TG. In our cleared samples, the signal-to-noise ratio and resolution were sufficiently high to enable automated counting of the total number of positive neurons in the TG. To accomplish this automated cell quantification, we manually determined a ROI by using the detection spot option proposed by Imaris software (Fig. 4A). Only spots superior to 10 µm XY in diameter were counted. This function allowed to precisely quantify individually labeled neuronal populations in a chosen view, e.g. lateral and frontal views (Fig. 4, panels B-D). This process took less than 15 min and gave a sample population of 88 ± 4 corneal
DISCUSSION
Recently, clearing and imaging intact transparent tissues has offered a novel approach to visualize a specific tissue in its entirety. Several important new clearing methods have been developed and used: ScaleA2 (Hama et al., 2011), 3DISCO (Belle et al., 2014; Erturk et al., 2012; Erturk and Bradke, 2013; Erturk et al., 2014), SeeDB (Ke et al., 2013; Ke and Imai, 2014), CLARITY (Chung et al., 2013; Tomer et al., 2014), PACT/PARS (Yang et al., 2014) and CUBIC (Susaki et al., 2014; Tainaka et al., 2014).
According to criteria of time, quality of clearing, and cost, we report that the 3DISCO approach is an excellent method to rapidly clear the adult mouse TG, confirming data from a recent study using mouse brains (Kim et al., 2013). In the present study, we combined the 3DISCO clearing protocol, retrograde tracing, ultramicroscopy, and automated cell counting with Imaris software to explore the somatotopy of trigeminal sensory neurons that innervate the mouse cornea.
We provide evidence that a 3D somatotopy of corneal neurons in a whole adult mouse ganglion is easily and rapidly obtained. These combined methods give excellent results, faster than classical histological methods, and allow us to describe the in situ somatotopy of a subpopulation of neurons in an entire ganglion. The mammalian cornea is one of the most richly innervated structures in the body, containing 300-600 times more nerve terminals than the skin and 20-40 times more than tooth pulp (Rozsa and Beuerman, 1982). Corneal innervation originates principally in the TG and receives a modest sympathetic innervation from the superior cervical ganglion (Bron et al., 2014; Felipe et al., 1999; Marfurt and Del Toro, 1987; Marfurt et al., 1989). Since the end of the eighties, the localization of a sample population of corneal afferent neurons in rodent TGs has been described using classical histological methods (where the TG is sectioned) and various retrograde tracers such as WGA-HRP, Fluorogold, Fast blue, or CTB (Bron et al., 2014; De Felipe and Belmonte, 1999;
Felipe et al., 1999; Ivanusic et al., 2013; Keller et al., 1991; LaVail et al., 1993; Marfurt et al., 1989; Nakamura et al., 2007).
Here, we used CTB-Alexa 594, which is routinely used for neuroanatomical tracing. In addition, we also tested other CTB-Alexa fluor dyes (Alexa Fluor 488 and 555), which gave similar results (not shown). We show that the labeled corneal afferent neurons are mainly detected in the dorsomedial part of the whole mouse TG. Such localization of the neurons innervating the mouse cornea is in agreement with previous studies that have used serial histological sections performed in mammals (Bron et al., 2014; Felipe et al., 1999; Ivanusic et al., 2013; LaVail et al., 1993; Marfurt and Del Toro, 1987; Marfurt et al., 1989; Nakamura et al., 2007). However, our combined method offers the advantage of being able to give a high-resolution distribution and serial images at the desired depth in the intact mouse TG. Furthermore, it has recently been shown that immunolabeling of whole adult (Renier et al., 2014) or embryo (Belle et al., 2014) tissues is compatible with the 3DISCO method. This combination thus gives researchers the possibility of performing double or triple immunolabeling experiments.
We demonstrate that by combining the 3DISCO method and Imaris software, automated counting of labeled cells is easily and quickly performed in a whole cleared mouse TG. This method of calculation is faster than a manual cell count on 20 µm-stacked images using ImageJ software. Both methods of calculation gave a sample population of corneal neurons that is comparable to that previously reported with different anatomical techniques (Bron et al., 2014; De Felipe and Belmonte, 1999; Felipe et al., 1999). Another advantage of light-sheet fluorescent microscopy is the ability to easily generate high-resolution images of ROIs (Belle et al., 2014; Erturk et al., 2014). Here, we combined light sheet imaging and Imaris software to obtain high-resolution images of labeled corneal afferent neurons in a whole TG. In our experimental conditions, the analysis of high-resolution images showed that the CTB
tracer was incorporated in a population of medium, and small sized sensory neurons.
Further investigations from our group will focus on the representation of corneal afferent fibers in a cleared brain using a mixture of tracers that discriminate between myelinated and unmyelinated fibers. It is well known that each fiber type projects preferentially to different laminae of the dorsal horns of the medulla and spinal cord; CTB mainly labels terminals in laminae I and III-V, but not in lamina II (Baseer et al., 2014; Shehab and Hughes, 2011). The full range of ocular surface afferents has been previously described from animals whose corneas were treated with a mixture of HRP-CTB and HRP-WGA, using classical histological methods (Panneton et al., 2010). Therefore, a similar approach could easily be performed with the 3DISCO method, which is suitable for a combination of tracers, depending on the set up of the ultramicroscope.
Following administration of the CTB tracer in the cornea, the time point of 48 h was chosen based on previous data from our group (not shown): 24 h was not optimal since corneal afferent neurons were only lightly stained with CTB-Alexa 594 and at 72 h, the results were comparable to 48 h.
The 3DISCO clearing method is faster than traditional histological methods, with high-resolution images being obtained within 24 h. This procedure is also efficient in preventing counting bias, preserving the whole tissue structure and making it possible to observe the spatial organization of labeled cells. However, as observed with the classical histological paraffin inclusion process (Gerdes et al., 1982; Iwadare et al., 1984), the 3DISCO method induces TG shrinkage (due to dehydration). Tissue shrinkage has recently been estimated at about 20% for the spinal cord (Erturk and Bradke, 2013; Erturk et al., 2014). However, the proportion and spatial organization of the TG are preserved in cleared tissues as recently described (Belle et al., 2014; Erturk et al., 2012; Erturk and Bradke, 2013; Erturk et al., 2014; Renier et al., 2014). Cleared tissues can be stored for months at room temperature in DBE
solution and can be acquired de novo by ultramicroscopy, provided that they remain transparent. Moreover, if necessary, cleared tissues can also be subsequently and rapidly imaged using laser-scanning microscope or 2-photon imaging to obtain a complete high-resolution 3D image of the tissue.
Potential pitfalls and troubleshooting
The 3DISCO method does have its limitations. Clearing, which can only be performed on fixed tissues, alters the chemical composition. Moreover, we observed that the 3DISCO method induces a slight background autofluorescence in the processed TG. However, autofluorescence is not exclusive to the TG, since it has also been reported in other tissues (Erturk et al., 2012). Autofluorescence appears to be useful to help visualize the entire morphology of the tissue and position the sample during image acquisition. To maximally reduce tissue autofluorescence, we recommend not leaving the tissue in the fixation solution after dissection and washing the TG in 1x PBS. Furthermore, the tissue should not be kept at 4°C for longer than 24 h before the clearing procedure. Importantly, transcardiac perfusion of animals with a ready-to-use fixative solution of paraformaldehyde 4% containing ethanol is not recommended, as it was shown to increase autofluorescence.
In this study, we were able to easily detect labeled cellular bodies but axons were less frequently detected. One reason for this is probably due to retrograde CTB preferentially accumulating in the cell bodies rather than in the nerve fibers. The second reason could be that the density of corneal neurons is not sufficient to detect nerve pathways within whole TGs. Previously published studies using the 3DISCO clearing method have all used transgenic mice overexpressing fluorescent proteins such as Thy1-GFP transgenic mice (GFP-M mice) (Erturk et al., 2012; Erturk et al., 2014; Renier et al., 2014). This high level of endogenous fluorescent protein allows an easier visualization of axonal pathways and the fine
details of neuronal structures (cortical dendritic spines, dendrites and axons) of transparent spinal cord segments from GFP-M.
In conclusion, the combination of a simple, rapid 3DISCO method with a retrograde tracer, light sheet imaging, and automated cell counting offers novel perspectives in Neuroscience. Although this optimized, combined procedure focuses on corneal neuronal cells, this protocol is probably suitable for analyzing neuronal subpopulations of cells within the peripheral and central nervous system.
Conflict of Interest: The authors declare no potential conflicts of interest.
Acknowledgements
This study was supported by the Agence Nationale pour la Recherche Grant R06282DS, Université Pierre and Marie Curie (Paris VI), the Institut National de la Santé et de la Recherche Médicale LABEX (ANR-10-LABX-65) and the Rotary Club programme “Espoir en tête”. The authors thank R. N. Cooper for editorial assistance with this manuscript. We thank Stéphane Fouquet (imagery platform) and the staff of the animal house facilities at the Institut de la Vision for their help.
References
Baseer, N., Al-Baloushi, A.S., Watanabe, M., Shehab, S.A., Todd, A.J., 2014. Selective innervation of NK1 receptor-lacking lamina I spinoparabrachial neurons by presumed nonpeptidergic Adelta nociceptors in the rat. Pain 155, 2291-2300.
Belle, M., Godefroy, D., Dominici, C., Heitz-Marchaland, C., Zelina, P., Hellal, F., Bradke, F., Chedotal, A., 2014. A simple method for 3D analysis of immunolabeled axonal tracts in a transparent nervous system. Cell Rep. 9, 1191-1201.
Bron, R., Wood, R.J., Brock, J.A., Ivanusic, J.J., 2014. Piezo2 expression in corneal afferent neurons. J. Comp. Neurol.; 522, 2967-2979.
Chung, K., Wallace, J., Kim, S.Y., Kalyanasundaram, S., Andalman, A.S., Davidson, T.J., Mirzabekov, J.J., Zalocusky, K.A., Mattis, J., Denisin, A.K., Pak, S., Bernstein, H., Ramakrishnan, C., Grosenick, L., Gradinaru, V., Deisseroth, K., 2013. Structural and molecular interrogation of intact biological systems. Nature 497, 332-337.
De Felipe, C., Belmonte, C., 1999. c-Jun expression after axotomy of corneal trigeminal ganglion neurons is dependent on the site of injury. Eur. J. Neurosci. 11, 899-906.
Dodt, H.U., Leischner, U., Schierloh, A., Jahrling, N., Mauch, C.P., Deininger, K., Deussing, J.M., Eder, M., Zieglgansberger, W., Becker, K., 2007. Ultramicroscopy: three-dimensional visualization of neuronal networks in the whole mouse brain. Nat. Methods 4, 331-336.
Erturk, A., Becker, K., Jahrling, N., Mauch, C.P., Hojer, C.D., Egen, J.G., Hellal, F., Bradke, F., Sheng, M., Dodt, H.U., 2012. Three-dimensional imaging of solvent-cleared organs using 3DISCO. Nat. Protoc. 7, 1983-1995.
Erturk, A., Bradke, F., 2013. High-resolution imaging of entire organs by 3-dimensional imaging of solvent cleared organs (3DISCO). Exp. Neurol. 242, 57-64.
Erturk, A., Lafkas, D., Chalouni, C., 2014. Imaging cleared intact biological systems at a cellular level by 3DISCO. J. Vis. Exp., 1-13.
Felipe, C.D., Gonzalez, G.G., Gallar, J., Belmonte, C., 1999. Quantification and immunocytochemical characteristics of trigeminal ganglion neurons projecting to the cornea: effect of corneal wounding. Eur. J. Pain 3, 31-39.
Gerdes, A.M., Kriseman, J., Bishop, S.P., 1982. Morphometric study of cardiac muscle: the problem of tissue shrinkage. Lab. Invest. 46, 271-274.
Hama, H., Kurokawa, H., Kawano, H., Ando, R., Shimogori, T., Noda, H., Fukami, K., Sakaue-Sawano, A., Miyawaki, A., 2011. Scale: a chemical approach for fluorescence imaging and reconstruction of transparent mouse brain. Nat. Neurosci. 14, 1481-1488.
Ivanusic, J.J., Wood, R.J., Brock, J.A., 2013. Sensory and sympathetic innervation of the mouse and guinea pig corneal epithelium. J. Comp. Neurol. 521, 877-893.
Iwadare, T., Mori, H., Ishiguro, K., Takeishi, M., 1984. Dimensional changes of tissues in the course of processing. J. Microsc. 136, 323-327.
Ke, M.T., Fujimoto, S., Imai, T., 2013. SeeDB: a simple and morphology-preserving optical clearing agent for neuronal circuit reconstruction. Nat. Neurosci. 16, 1154-1161.
Ke, M.T., Imai, T., 2014. Optical clearing of fixed brain samples using SeeDB. Curr. Protoc. Neurosci. 66, Unit 2 22.
Keller, J.T., Bubel, H.C., Wander, A.H., Tierney, B.E., 1991. Somatotopic distribution of corneal afferent neurons in the guinea pig trigeminal ganglion. Neurosci. Lett. 121, 247-250.
Kim, S.Y., Chung, K., Deisseroth, K., 2013. Light microscopy mapping of connections in the intact brain. Trends Cogn. Sci. 17, 596-599.
Kuwajima, T., Sitko, A.A., Bhansali, P., Jurgens, C., Guido, W., Mason, C., 2013. ClearT: a detergent- and solvent-free clearing method for neuronal and non-neuronal tissue. Development 140, 1364-1368.
LaVail, J.H., Carter, S.R., Topp, K.S., 1993. The retrograde tracer Fluoro-Gold interferes with the infectivity of herpes simplex virus. Brain Res. 625, 57-62.
Marfurt, C.F., Del Toro, D.R., 1987. Corneal sensory pathway in the rat: a horseradish peroxidase tracing study. J. Comp. Neurol. 261, 450-459.
Marfurt, C.F., Kingsley, R.E., Echtenkamp, S.E., 1989. Sensory and sympathetic innervation of the mammalian cornea. A retrograde tracing study. Invest. Ophthalmol. Vis. Sci. 30, 461-472.
Muller, L.J., Marfurt, C.F., Kruse, F., Tervo, T.M., 2003. Corneal nerves: structure, contents and function. Exp. Eye Res. 76, 521-542.
Muller, L.J., Pels, L., Vrensen, G.F., 1996. Ultrastructural organization of human corneal nerves. Invest. Ophthalmol. Vis. Sci. 37, 476-488.
Muller, L.J., Vrensen, G.F., Pels, L., Cardozo, B.N., Willekens, B., 1997. Architecture of human corneal nerves. Invest. Ophthalmol. Vis. Sci. 38, 985-994.
Nakamura, A., Hayakawa, T., Kuwahara, S., Maeda, S., Tanaka, K., Seki, M., Mimura, O., 2007. Morphological and immunohistochemical characterization of the trigeminal ganglion neurons innervating the cornea and upper eyelid of the rat. J. Chem. Neuroanat. 34, 95-101.
Panneton, W.M., Hsu, H., Gan, Q., 2010. Distinct central representations for sensory fibers innervating either the conjunctiva or cornea of the rat. Exp. Eye Res. 90, 388-396.
Renier, N., Wu, Z., Simon, D.J., Yang, J., Ariel, P., Tessier-Lavigne, M., 2014. iDISCO: a simple, rapid method to immunolabel large tissue samples for volume imaging. Cell 159, 896-910.
Rozsa, A.J., Beuerman, R.W., 1982. Density and organization of free nerve endings in the corneal epithelium of the rabbit. Pain 14, 105-120.
Shehab, S.A., Hughes, D.I., 2011. Simultaneous identification of unmyelinated and myelinated primary somatic afferents by co-injection of isolectin B4 and Cholera toxin subunit B into the sciatic nerve of the rat. J. Neurosci. Methods 198, 213-221.
Susaki, E.A., Tainaka, K., Perrin, D., Kishino, F., Tawara, T., Watanabe, T.M., Yokoyama, C., Onoe, H., Eguchi, M., Yamaguchi, S., Abe, T., Kiyonari, H., Shimizu, Y., Miyawaki, A., Yokota, H., Ueda, H.R., 2014. Whole-brain imaging with single-cell resolution using chemical cocktails and computational analysis. Cell 157, 726-739.
Tainaka, K., Kubota, S.I., Suyama, T.Q., Susaki, E.A., Perrin, D., Ukai-Tadenuma, M., Ukai, H., Ueda, H.R., 2014. Whole-body imaging with single-cell resolution by tissue decolorization. Cell 159, 911-924.
Tomer, R., Ye, L., Hsueh, B., Deisseroth, K., 2014. Advanced CLARITY for rapid and high-resolution imaging of intact tissues. Nat. Protoc. 9, 1682-1697.
Yang, B., Treweek, J.B., Kulkarni, R.P., Deverman, B.E., Chen, C.K., Lubeck, E., Shah, S., Cai, L., Gradinaru, V., 2014. Single-cell phenotyping within transparent intact tissue through whole-body clearing. Cell 158, 945-958.
TABLE LEGENDS
TABLES
Table 1: 3DISCO clearing method for adult mouse trigeminal ganglion.
METHOD TIME FOR CLEARING APPAREANCE AFTER CLEARING IMAGE ACQUISITION ULTRAMICROSCOPY TIME FOR IMAGE ACQUISITION FLUORESCENCE QUENCHING
3DISCO 3h Transparent Compatible 15 min No
Table 2: 3DISCO procedure. 3DISCO method adapted for the adult mouse TG. Clearing
reagents. All steps were performed at room temperature, under agitation and under a hood. THF: tetrahydrofuran; DCM: dichloromethan; DBE: dibenzyl ether. *Samples should remain in DBE solution until image acquisition.
SOLUTIONS TIME 1x PBS 5 min (twice) 50% THF 30 min 80% THF 30 min 100% THF 30 min twice DCM 10-20 min DBE ∞*
Table 3: Comparison of manual and automated methods for counting cells in the mouse
TG (n = 12 animals).
CALCULATION METHODS IMAGEJ - MANUAL IMARIS 3D - AUTOMATIC
NUMBER OF CELLS
194 ± 16 88 ±4
FIGURE LEGENDS
Fig. 1. Ultramicroscopy device. A-B: A mouse trigeminal ganglion (TG) before (A) and after
3DISCO clearing (B) placed in the plastic holder. C: LaVision Biotec Ultramicroscope device. D: Schematic representation of the ultramicroscope light sheet acquisition. Images were obtained by placing the TG in a 100% quartz-imaging reservoir containing DBE. The cleared tissue is illuminated by 1 µm light sheet (561 nm) and a high sensitivity camera collects the fluorescent signal.
Fig. 2: Schematic representation of CTB retrograde tracer applied to the de-epithelialized
cornea. Typical distribution of retrogradely labeled corneal afferent neurons within the intact mouse TG obtained from 3DISCO and ultramicroscope light sheet imaging. A: 100 µm serial images of mouse cleared TG obtained by the ultramicroscope, light sheet technology (dorsal to ventral, from 0 to 500 µm in depth, at 561 nm, 1.6x objective). White arrows show corneal afferent neurons labeled with CTB-594. B: 3D representation of the reconstructed TG obtained with ultramicroscope serial images and illustrating the medial distribution of corneal neurons (white arrows). Note the absence of positive cells at 488 nm. C: 90 degrees reoriented TG showing the dorso-ventral distribution of retrogradely labeled neurons innervating the cornea, V1: Ophthalmic branch V2: maxillary branch; V3, mandibular branch; Dal: Dorsal; Val: Ventral. Scale bars = 600 µm.
Fig. 3: Example of high-resolution images obtained from a 3D reconstructed mouse TG. A- 3D reconstructed TG containing CTB-labeled neurons. Reconstruction was made with images acquired with a 4x objective. B-C-D High-resolution images of labeled trigeminal neurons.
Note that small and medium sized cells were labeled with CTB. Some nerve fibers were also detected. V3: mandibular branch Scale bars. A: 200 µm, B: 100 µm, C-D: 50 µm.
Fig. 4: Selection of the ROI and quantification of the CTB-labeled neurons in the TG. A:
Representative image of a reconstructed mouse TG with a 1.6x objective and the ROI covering all the retrogradely labeled neurons (red spots). B-C: Lateral views of the TG showing retrogradely labeled corneal neurons detected in the ROI (B, red balls) after being analyzed and counted by Imaris (C, white balls). D-E: Dorsomedial distribution of corneal afferent neurons detected in the ROI (front side view). V1: Ophthalmic branch V2: maxillary branch, V3: mandibular branch. Dal: Dorsal; Val: Ventral Scale bars = 600 µm (A), 300 µm (B).
Movie 1: 3D reconstructed TG from a control mouse not treated with fluorescent tracer.
Control TG exhibits a light homogenous internal auto-fluorescence at 561 nm. Note that no neurons were detected in the cleared TG. Time: 24s, frames: 576, format: MP4).
Movie 2: 3D organization of the corneal afferent neurons, retrogradely labeled with
CTB-Alexa 594 inside the intact mouse TG. The movie shows the somatotopy of the retrogradely labeled neurons inside an intact reconstructed TG by Imaris software. Bright bodies are labeled neurons, which are automatically detected in the ROI (red balls). The majority of labeled cells remain in the lateral part of the TG, opposite the mandibular branch. (Time: 25s, frames: 600, format: MP4).