Publisher’s version / Version de l'éditeur:
Vous avez des questions? Nous pouvons vous aider. Pour communiquer directement avec un auteur, consultez la première page de la revue dans laquelle son article a été publié afin de trouver ses coordonnées. Si vous n’arrivez pas à les repérer, communiquez avec nous à PublicationsArchive-ArchivesPublications@nrc-cnrc.gc.ca.
Questions? Contact the NRC Publications Archive team at
PublicationsArchive-ArchivesPublications@nrc-cnrc.gc.ca. If you wish to email the authors directly, please see the first page of the publication for their contact information.
https://publications-cnrc.canada.ca/fra/droits
L’accès à ce site Web et l’utilisation de son contenu sont assujettis aux conditions présentées dans le site LISEZ CES CONDITIONS ATTENTIVEMENT AVANT D’UTILISER CE SITE WEB.
OSA Topical Meeting on Photonics in Switching, July 25-28, 2010, Monterey,
California [Proceedings], 2010-07-25
READ THESE TERMS AND CONDITIONS CAREFULLY BEFORE USING THIS WEBSITE. https://nrc-publications.canada.ca/eng/copyright
NRC Publications Archive Record / Notice des Archives des publications du CNRC :
https://nrc-publications.canada.ca/eng/view/object/?id=877c8152-eb0a-43f2-9392-b843f30fe62b
https://publications-cnrc.canada.ca/fra/voir/objet/?id=877c8152-eb0a-43f2-9392-b843f30fe62b
NRC Publications Archive
Archives des publications du CNRC
This publication could be one of several versions: author’s original, accepted manuscript or the publisher’s version. / La version de cette publication peut être l’une des suivantes : la version prépublication de l’auteur, la version acceptée du manuscrit ou la version de l’éditeur.
Access and use of this website and the material on it are subject to the Terms and Conditions set forth at
Silicon-chip-based optical performance monitoring of THz bandwidth
phase and intensity modulated signals
Corcoran, Bill; Vo, Trung D.; Pelusi, Mark D.; Monat, Christelle; Densmore,
Adam; Ma, Rubin; Xu, Dan-Xia; Janz, Siegfried; Moss, David J.; Eggleton,
Benjamin J.
Silicon-chip-based optical performance monitoring of THz
bandwidth phase and intensity modulated signals
Bill Corcoran1, Trung D. Vo1, Mark D. Pelusi1, Christelle Monat1, Alan Densmore2, Rubin Ma2, Dan-Xia Xu2, Siegfried Janz2, David. J. Moss1 and Benjamin J. Eggleton1
1 CUDOS, IPOS, School of Physics, University of Sydney, Sydney, Australia, 2006 2 Institute for Microstructural Sciences, NRC-CNRC, Ottawa, ON, Canada K1A-0R6
trungvo@physics.usyd.edu.au, billc@physics.usyd.edu.au
Abstract: We present a silicon-chip-based optical performance monitor, using an all-optical RF spectral analysis technique, capable of real-time performance monitoring both phase and intensity encoded signals. The device operates unimpeded by the effects of photo-generated free-carriers.
©2010 Optical Society of America
OCIS codes: 190.4360 Nonlinear optics, devices, 060.4256 Networks, network optimization
1. Introduction
Optical performance monitoring, the measurement of impairments on data signals, is crucial to the operation of reconfigurable optical networks [1, 2]. In ultrahigh speed serial data communications, optical performance monitoring requires tools able to characterise short, broad-bandwidth pulses to ensure optimal performance. Traditional electronic methods, limited to bandwidths of <100GHz, are unable to achieve this. All-optical techniques, particularly those harnessing ultrafast optical nonlinearities, may solve this problem. Recent interest has piqued in providing new short pulse characterization solutions with the capacity for on-chip integration [3-7]. Of these new techniques, cross-phase modulation based radio-frequency spectrum analysis (XPM-RFSA) has been proved as an effective tool for chip-based optical performance monitoring [8]. Silicon is particularly interesting for integration, due to the reliability and cost-effectiveness of CMOS fabrication processes. However previous XPM-RFSA performance monitoring demonstrations have been achieved chalcogenide glasses, which unlike silicon do not suffer photo-generated free-carrier effects that are well known to complicate nonlinear interactions [9]. This raises concerns about the usefulness of silicon waveguides for XPM-RFSA.
In this paper we demonstrate silicon-chip-based optical performance monitoring of both phase- and intensity-modulated signals. We use XPM-RFSA to monitor residual group velocity dispersion on differential phase-shift keyed (DPSK) and return-to-zero on-off keyed (RZ-OOK) signals at serial data rates of 640Gbit/s, using techniques that lend themselves to on chip integration. We show that despite the issue of free-carriers, we are able to accurately measure radio-frequency (RF) spectra through cross-phase modulation (XPM) in a silicon nanowire waveguide, demonstrating the first silicon-chip-based XPM-RFSA. Our results demonstrate a modulation format versatile solution to terabaud optical performance monitoring, with the potential for monolithic integration on a CMOS compatible platform.
2. Background
RF spectral monitoring is commonly used to analyse the temporal characteristics of signals. The RF spectrum is the power spectrum of signal intensity, i.e. for optical signals this is the squared magnitude of the Fourier transform of time varying intensity. RF spectra are usually obtained by electronic means – after measuring time-varying intensity with a photodetector, analysis is done in the electronic domain. However, the limited bandwidth (<100GHz) of photodetectors restricts the usefulness of electronics in analysis of the ultra-short optical pulses necessary for ultrahigh-speed serial communication links.
a) b)
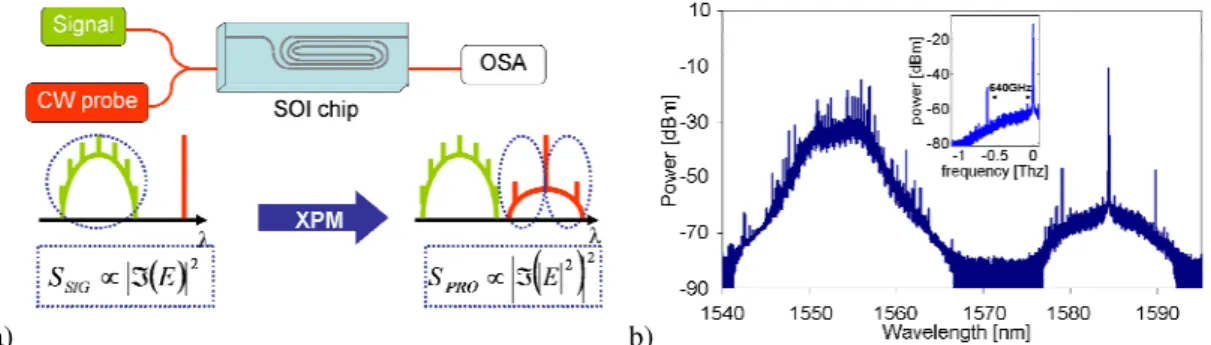
Figure 1 – a) Concept of silicon-based XPM-RFSA. A signal with optical spectrum SSIG and a monochromatic CW wave mix in a
silicon waveguide via XPM. The RF spectrum of the signal SRF=|ℑ(|E|2)|2 is superimposed on the spectrum of the CW wave SPRO, and
analysed on an optical spectrum analyser (OSA) b) Optical spectrum out of our device for a 640Gbaud RZ-OOK input (inset – magnified long wavelength sideband, frequency axis is detuning from CW wave central frequency).
An all-optical analogue to electronic RF spectral analysis is available through XPM-RFSA. As this technique utilises the ultrafast Kerr nonlinearity, XPM-RFSA has an intrinsic bandwidth of 10s of terahertz,
sufficient for the analysis of terabaud optical data. XPM-RFSA utilises XPM induced by an optical signal on a CW probe to superimpose the signals RF spectrum SRF onto the optical spectrum of the probe wave SPRO, as
represented in figure 1. Importantly, this relationship holds only if Kerr-based XPM is the dominant source of cross-chirp, and only where the maximum accumulated cross phase shift φ is small (φ<<1)[6]. If these conditions are met, SPRO can be represented by to equation 1, such that the modulation sidebands generated are
proportional to SRF.
( )
f[
(
1)
exp[
2 i(
f f0)
t]
dt]
2SPRO = +φ ⋅ − π − ⋅
(1)
Additionally, the Weiner-Kintchine theorem states that the inverse Fourier transform of a power spectrum is an autocorrelation, so XPM-RFSA can be used to obtain signal autocorrelations. We utilise this to gain a qualitative measure of device accuracy. It is also possible, through analysis of the RF spectrum, to measure the severity of signal transmission impairments that manifest as temporal variations in intensity. As both amplitude and phase encoded signals are distorted by transmission impairments – such as group-velocity dispersion (GVD) and decreasing optical signal-to-noise ratio (OSNR) – in this manner, RF spectrum analysis can be used for optical performance monitoring.
3. Experiments and Discussion
We use a silicon-on-insulator nanowire waveguide, Si02 clad, in our investigations. The waveguide is 1.5cm
long, 450nm wide by 260nm high. We couple to the TE mode of the waveguide, with a calculated effective index neff~2.5, ~3dB/cm propagation loss and ~8dB per facet coupling loss from lensed fibres to the waveguide.
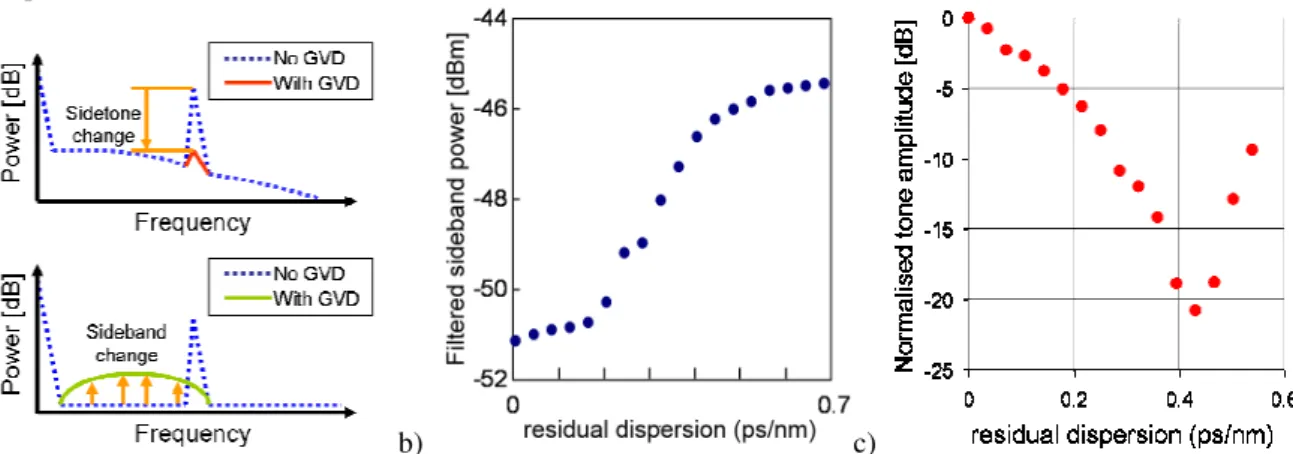
Signal transmission impairments impart different RF spectral signatures, dependant on data modulation format. For instance, GVD reduces the sidetone power in the RF spectrum of an intensity encoded RZ-OOK signal [5], while for a phase encoded DPSK signal new RF frequency components between the CW probe and the 640GHz clock-tone are generated [10], as illustrated in figure 2a. We use these known effects to monitor GVD on both phase and intensity modulated signals, taking real-time measurements using optical filters and slow photodetectors.
a) b) c)
Figure 2 – a) Illustration of the changes in the RF spectrum of (top) RZ-OOK and (bottom) DPSK optical signals impaired by GVD. b) Filtered sideband power vs. applied GVD for a 640Gbaud, DPSK encoded signal. c) Sidetone power variation with applied GVD for a 640Gbaud, RZ-OOK encoded signal.
Figure 2b and c shows the experimental results of 640GHz DPSK and OOK signals with controlled amounts of GVD applied through a programmable spectral phase filter (Finisar WaveShaper). 40Gb/s OOK and DPSK signals are generated from 40GHz pulse trains, imprinted with a 40Gb/s pseudo-random bit sequence (PRBS) of 231-1 pattern length via appropriate modulators. The 640Gb/s signals are produced from 40Gb/s data via four-stage optical time division multiplexing. Figure 2b shows GVD monitoring of a 640Gb/s DPSK signal. The power between CW probe and 640GHz tone increases with increasing GVD. We optically filter this sideband, measure power using a slow photodiode, allowing real-time measurement of GVD. The dynamic range of this measurement is similar to results HNLF [10], for a factor 16 higher bit rate. Figure 2c shows GVD monitoring of a 640Gb/s OOK signal. The measured sidetone amplitude varies by over 20dB, similar to ref [5]. As GVD affects the RF spectra of DPSK and OOK modulated signals in different ways, different features in the RF spectrum are used to monitor dispersion [5, 10]. As such, it is unsurprising that a difference in measurement dynamic range exists between in figures 2b and c.
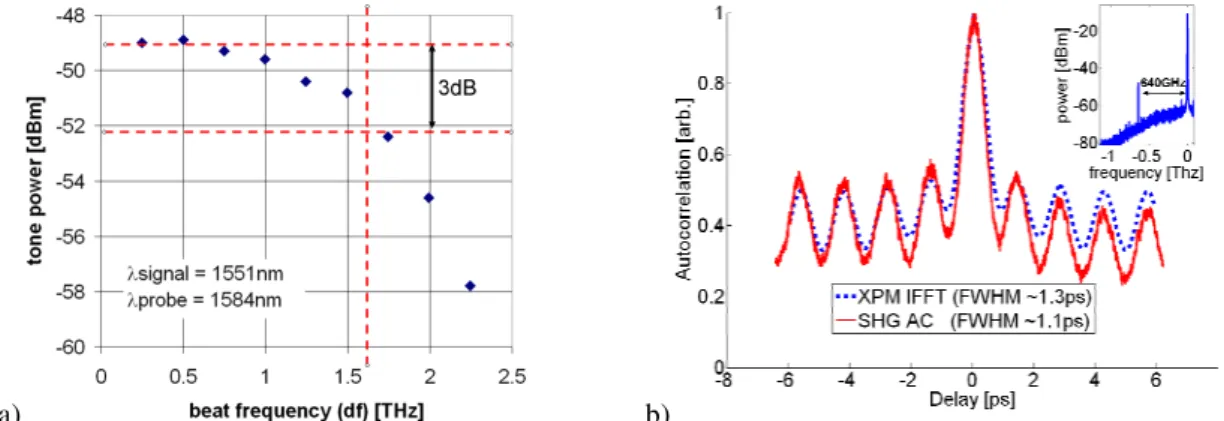
In waveguides, the bandwidth of XPM-RFSA is generally limited by dispersion. The XPM bandwidth of our device can be measured (as per ref [6]) by mixing two beating CW signal waves, equally spaced by a separation df about a central frequency fS, with a third, weaker probe wave detuned from that signal at frequency fP. This creates sidetones about the CW wave at fP±df. Analysing the change in sidetone amplitude with
changing df allows measurement of the XPM bandwidth. Figure 3a shows the results of this measurement, with a bandwidth of ~1.6THz measured, showing our device capable of XPM-RFSA for terabaud optical data.
To gain a qualitative estimate of the accuracy of our Si-based XPM-RFSA, we compare the autocorrelation extracted via Fourier transform from XPM-RFSA, with a trace gathered from a commercial second-harmonic generation (SHG) autocorrelator. We measure the RF spectrum of the same 640Gbaud RZ-OOK stream as used earlier. The coupled average power of the signal and probe are ~13dBm and ~7dBm respectively. Figure 3b show this comparison, with the trace gathered through SHG closely matching the one gathered through XPM-RFSA, indicating that our device operates without significant cross-chirp effects from photo-generated free-carriers. The central peak FWHM for the XPM-RFSA trace is 1.3ps versus 1.1ps for the SHG trace. The measured bit period matches up well, reflecting the match between the 640GHz sidetone on the RF spectrum (see inset fig 3b) and the baud rate of the signal.
a) b)
Figure 3 – a) Measured XPM bandwidth of the device. For a signal-probe separation is ~33nm, a bandwidth of ~1.6THz is measured. b) Comparison of autocorrelations of a 640Gbaud signal (inset – XPM sideband from which the XPM-based autocorrelation is extracted)
As we have been able to accurately measure RF spectra, we expect the effect of free-carrier cross-chirp to be insignificant, otherwise the direct relationship between the cross-phase modulated probe and RF spectrum of the signal (as illustrated in equation 1) would not hold. A useful ratio of the magnitude of free-carrier cross chirp to Kerr induced cross-chirp can be found in ref [9]. Using this ratio we estimate that for our experiment, free-carriers produce ~400 times less cross-chirp than Kerr-based XPM. Furthermore, pulse propagation modelling predicts that both free-carrier and two-photon absorption have a negligible effect on transmission through our device [11](as per ref [9]). Our measurement of accurate RF spectra should also allow our device, via a more in-depth analysis of the RF spectrum, to perform simultaneous multiple-impairment monitoring [8].
4. Conclusion
We demonstrate optical performance monitoring through XPM-RFSA in a silicon waveguide. Through the use of appropriate optical filtering and slow photodetectors, group velocity dispersion can be measured on a real-time basis. As both filters and detectors have been demonstrated on silicon in CMOS compatible processes, there is potential for a fully integrated, ultrahigh-bandwidth chip-based device for optical performance
monitoring. We show that the device is capable of measuring accurate RF spectra, widening the possibilities of applications to simultaneous multiple impairment monitoring and ultrafast pulse characterization, again with potential to be realised monolithically on a chip.
5. References
1. M. Nakazawa, T. Yamamoto, and K. R. Tamura, "1.28Tbit/s-70 km OTDM transmission using third- and fourth-order simultaneous dispersion compensation with a phase modulator," Electron Lett 36, 2027-2029 (2000).
2. H. C. H. Mulvad, L. K. Oxenlowe, M. Galili, A. T. Clausen, L. Gruner-Nielsen, and P. Jeppesen, "1.28 Tbit/s single-polarisation serial OOK optical data generation and demultiplexing," Electron Lett 45, 280-U260 (2009).
3. M. A. Foster, A. C. Turner, M. Lipson, and A. L. Gaeta, "Nonlinear optics in photonic nanowires," Opt Express 16, 1300-1320 (2008). 4. N. K. Fontaine, R. P. Scott, L. J. Zhou, F. M. Soares, J. P. Heritage, and S. J. B. Yoo, "Real-time full-field arbitrary optical waveform
measurement," Nat Photonics 4, 248-254 (2010).
5. M. Pelusi, F. Luan, T. D. Vo, M. R. E. Lamont, S. J. Madden, D. A. Bulla, D. Y. Choi, B. Luther-Davies, and B. J. Eggleton, "Photonic-chip-based radio-frequency spectrum analyser with terahertz bandwidth," Nat Photonics 3, 139-143 (2009).
6. C. Dorrer and D. N. Maywar, "RF spectrum analysis of optical signals using nonlinear optics," J Lightwave Technol 22, 266-274 (2004).
7. T. D. Vo, H. Hu, M. Galili, E. Palushani, J. Xu, L. K. Oxenlowe, S. J. Madden, D. Y. Choi, D. A. Bulla, M. D. Pelusi, J. Schroeder, B. Luther-Davies, and B. J. Eggleton, "Photonic Chip Based 1.28 Tbaud Transmitter Optimization and Receiver OTDM Demultiplexing," in OFC, (Optical Society of America, 2010), PDPC5.
8. T. D. Vo, M. D. Pelusi, J. Schroder, F. Luan, S. J. Madden, D. Y. Choi, D. A. P. Bulla, B. Luther-Davies, and B. J. Eggleton, "Simultaneous multi-impairment monitoring of 640 Gb/s signals using photonic chip based RF spectrum analyzer," Opt Express 18, 3938-3945 (2010).
9. Q. Lin, O. J. Painter, and G. P. Agrawal, "Nonlinear optical phenomena in silicon waveguides: Modeling and applications," Opt Express 15, 16604-16644 (2007).
10. J. Y. Yang, L. Zhang, X. Wu, O. F. Yilmaz, B. Zhang, and A. E. Willner, "All-Optical Chromatic Dispersion Monitoring for Phase-Modulated Signals Utilizing Cross-Phase Modulation in a Highly Nonlinear Fiber," Ieee Photonic Tech L 20, 1642-1644 (2008). 11. B. Corcoran, T. D. Vo, M. D. Pelusi, C. Monat, A. Densmore, R. Ma, D.-X. Xu, S. Janz, D. J. Moss, and B. J. Eggleton, "Silicon