FJProf: Profiling Fork/Join Applications
on the Java Virtual Machine
Eduardo Rosales, Andrea Rosà, Walter Binder
Faculty of InformaticsUniversità della Svizzera italiana Lugano, Switzerland
{rosale,andrea.rosa,walter.binder}@usi.ch
ABSTRACT
An efficient fork/join application should maximize parallelism while minimizing overheads, and maximize locality while minimizing contention. However, there is no unique optimal implementation that best resolves such tradeoffs and failing in balancing them may lead to fork/join applications suffering from several issues (e.g., suboptimal forking, load imbalance, excessive synchronization), possibly compromising the performance gained by a task-parallel execution. Moreover, there is a lack of profilers enabling perfor-mance analysis of a fork/join application. As a result, developers are often required to implement their own tools for monitoring and collecting information and metrics on fork/join applications, which could be time-consuming, error-prone, and is often beyond the expertise of the developer. In this paper, we present FJProf, a novel profiler which accurately collects dynamic information and key metrics to facilitate characterizing several performance attributes specific to a fork/join application running on a single Java Virtual Machine (JVM) in a shared-memory multicore. FJProf reports information and graphics to developers that help them un-derstand the details of the fork/join processing exposed by a parallel application running on the JVM. We show how FJProf supports performance analysis by characterizing a fork/join application from the Renaissance benchmark suite.
CCS CONCEPTS
• General and reference → Metrics; • Software and its engi-neering → Software performance.
KEYWORDS
Performance analysis, fork/join parallelism, task granularity, Java Virtual Machine
ACM Reference Format:
Eduardo Rosales, Andrea Rosà, Walter Binder. 2019. FJProf: Profiling Fork/Join Applications on the Java Virtual Machine. In Proceedings of VAL-UETOOLS 2020 - 13th EAI International Conference on Performance Evaluation Methodologies and Tools (VALUETOOLS 2020). ACM, New York, NY, USA, 8pages.
1
INTRODUCTION
Hardware advances have brought shared-memory multicores to the mainstream, increasingly encouraging developers to write parallel applications. While modern machines enable speedups, developing parallel applications that fully exploit the underlying hardware remains a major challenge. We tackle this issue for fork/join ap-plications running in a single Java Virtual Machine (JVM) on a
shared-memory multicore. Fork/join applications are task-based, parallel versions of divide-and-conquer algorithms recursively split-ting (fork) work into tasks that are executed in parallel, waisplit-ting for them to complete, and then typically merging (join) the results computed by the forked tasks [21].
Since Java 7, the Java fork/join framework [21, 34] is inte-grated into the Java library to enable fork/join parallelism on the JVM. Developers are increasingly using this framework as it ex-ploits the symbiosis between recursion and parallel decomposi-tion, encouraging the use of a parallel divide-and-conquer pro-gramming style [20] in applications written in Java or in one of the multiple languages supported by the JVM (such as Scala [12], Apache Groovy [2] or Clojure [40]). The Java fork/join frame-work is a key component of the Java library, as it directly sup-ports parallel sorting in the java.util.Array [26] class, paral-lel functional-style operations in the java.util.stream pack-age [33] and the development of asynchronous programs in the java.util.concurrent.CompletableFutures [27] class. Fur-thermore, it has been extensively used to support applications based on Actors [22] and MapReduce [3,14,45], to mention some.
Despite the popularity and the extensive set of features offered by the Java fork/join framework, developing fork/join applications able to fully leverage the available computing resources remains challenging. An efficient fork/join application should maximize parallelism while minimizing overheads, along with maximizing locality while minimizing contention [20]. While design principles that guide developers in properly implementing fork/join paral-lelism have been proposed [20,34], unfortunately, there is no unique optimal implementation that best resolves such tradeoffs. Failing in balancing such competing forces may lead to fork/join applications suffering from several performance issues (such as suboptimal fork-ing, load imbalance, excessive synchronization) that may outweigh the benefits of a parallel execution [9,37]. Furthermore, conducting a thorough analysis of a fork/join application requires developers to monitor, collect, and correlate a variety of metrics and infor-mation, which can be time-consuming, error-prone, and is often beyond the expertise of a developer [9]. Although related work focuses on parallelism discovery [11,13,43] and parallelism pro-filing [1,16,25,41,46], with some authors studying the use of the Java fork/join framework [9,37], we are not aware of the existence of any profiler for the JVM specifically aiding performance analysis of a fork/join application.
Our work aims at filling this gap, introducing FJProf, a novel profiler specifically helping developers conduct performance anal-ysis of fork/join applications running in a single JVM on a shared-memory multicore. FJProf accurately collects key metrics and
dynamic information that enable characterizing multiple perfor-mance attributes specific to a fork/join application. FJProf reports to developers information and easy-to-interpret graphics that facil-itate the understanding of the details of the fork/join processing performed by a parallel application running on the JVM. The chal-lenges in developing FJProf stem from the difficulty of designing efficient profiling techniques suitable for the JVM, able to detect every task spawned by a fork/join application while also mitigat-ing performance overheads caused by the instrumentation code inserted. We apply our tool to a workload of Renaissance [38], a recently released benchmark suite for the JVM, showing how FJProfhelps developers characterize a realistic complex fork/join application.
Our work makes the following contributions. We present FJProf, a fork/join profiler for the JVM (Sec.3). To the best of our knowledge, the proposed tool is the first profiler for fork/join applications run-ning on the JVM. We characterize a workload from the Renaissance suite, showing how our tool provides detailed information that facilitate performance analysis of a modern, realistic and complex fork/join application (Sec.4). Sec.2provides background informa-tion. Sec.5discusses work related to our approach. Finally, Sec.6
concludes.
2
BACKGROUND
In this section, we introduce background information and the ter-minology we use to describe our approach.
In the Java fork/join framework, tasks are modeled as subtypes of the abstract class java.util.concurrent.ForkJoinTask. Therefore, we use the term task to define an instance of class ForkJoinTask. Class ForkJoinTask is usually not subclassed directly. Instead, developers often ex-tend one of following subtypes of ForkJoinTask, de-pending on the needed style of fork/join processing: java.util.concurrent.RecursiveActionfor computations that do not return results, java.util.concurrent.RecursiveTask for those that do, and java.util.concurrent.CountedCompleter for those in which completed actions can trigger other actions [29]. As indicated by its name, the primary methods offered by class ForkJoinTaskto express fork/join parallelism are fork, which arranges the task to asynchronously execute it (as explained below, this action is known as task submission) and join, which waits for a task to complete and then returns the result of its computation.
A ForkJoinTask is a much lighter weight entity than a normal thread. Computations modeled via ForkJoinTask should be of a size and structure that maintain as much independence as possible. They should minimize (if possible, eliminate) the use of shared resources, global (static) variables, locks, and dependencies [20]. Ideally, a task should contain code that runs to completion, avoiding expensive coordinated actions such as frequent communication with other tasks or the use of blocking synchronization apart from joining [21].
To execute parallel tasks, the Java fork/join frame-work employs a fork/join pool (implemented via class java.util.concurrent.ForkJoinPool). A fork/join pool is composed of a number of threads (called workers) whose purpose is to execute ForkJoinTasks. Workers are implemented via class
java.util.concurrent.ForkJoinWorkerThread(which in turn extends class java.lang.Thread). Each worker has a deque (i.e., a double-ended queue) of tasks and processes them one by one.
The fork/join pool implements a work-stealing [11,48] schedul-ing strategy, i.e., if the dequeue of a worker is empty, the worker “steals” tasks by taking them from the deques belonging to other active workers. When a worker encounters a join operation, it pro-cesses other tasks, if available, until the target task has completed. Otherwise, all tasks run to completion without blocking [21].
To be executed by a worker, a task must be submitted to the fork/join pool. This is done by calling methods execute, invoke, or submit, which are defined in class ForkJoinTask. All of these methods end up invoking fork as the primary mechanism provided by ForkJoinTask to arrange the asynchronous execution of a task. Upon task submission, the fork/join pool adds the task to one of the workers’ deques.
To execute a task, a worker invokes method ForkJoinTask.exec, which, according to the Java API, should contain the computations to be carried out by a task [29]. This method is not usually overridden directly. Instead, de-velopers often override one of the following methods in the abstract subtypes of ForkJoinTask: RecursiveAction.compute, RecursiveTask.compute, or CountedCompleter.compute, all of which end up invoking method exec. A worker always executes method exec to perform the main computations defined in a task. We use the term execution method to define the overridden exec method in any subtype of class ForkJoinTask. With task execution, we denote the execution of an execution method by a worker. We consider a task to be executed if its execution method has been executed at least once by a worker until normal or abnormal com-pletion. Finally, we define a task as active if a worker is executing the task.
3
PROFILING METHODOLOGY
This section describes our profiling methodology, detailing the information and metrics targeted by FJProf, the components used to collect them, and how the final traces are produced.
3.1
Metrics
Here, we detail all metrics which our profiler focuses on. As shown in Table1, FJProf collects a variety of metrics to provide extensive information enabling the analysis of a fork/join application.
Task Information. FJProf specifically targets tasks spawned by a fork/join application running on the JVM. To this end, our tool detects the creation, submission, and execution of each task, pro-filing the thread responsible for its creation, the worker executing it, and the type of the task. FJProf also collects the starting and ending execution timestamps for each task, to allow correlating the execution of a task with other collected metrics. Lastly, to enable the analysis of the fork/join processing exposed by a parallel appli-cation, FJProf profiles invocations of methods fork and join of class ForkJoinTask.
Overall, the information collected enables fine-grained character-ization of a fork/join application at a task-level, easing the analysis of a task to the point of recognizing the class where it originated, the time interval in which it was active, or the specific worker in
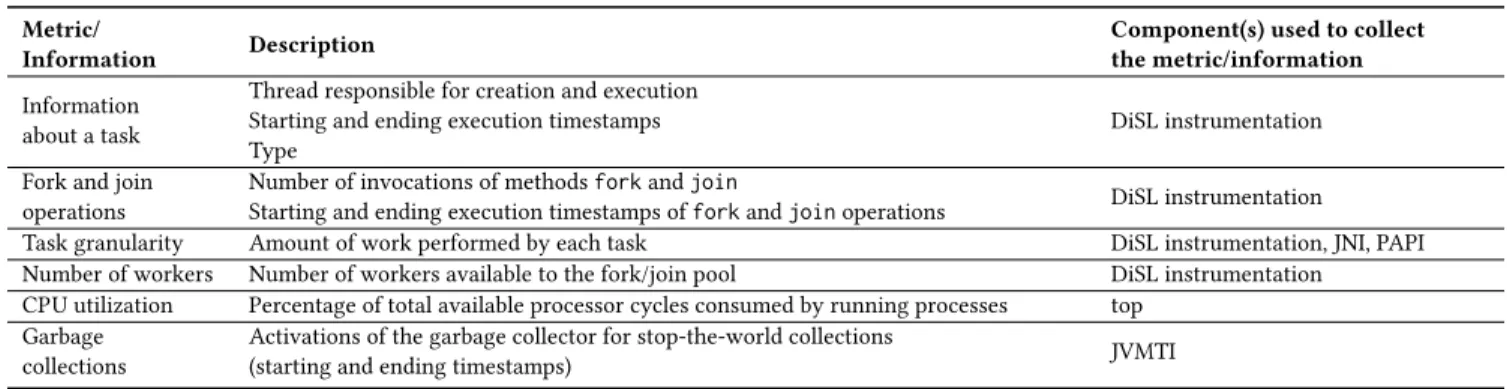
Table 1: Dynamic information and metrics collected by FJProf.
Metric/
Information Description
Component(s) used to collect the metric/information Information
about a task
Thread responsible for creation and execution Starting and ending execution timestamps Type
DiSL instrumentation Fork and join
operations
Number of invocations of methods fork and join
Starting and ending execution timestamps of fork and join operations DiSL instrumentation
Task granularity Amount of work performed by each task DiSL instrumentation, JNI, PAPI Number of workers Number of workers available to the fork/join pool DiSL instrumentation
CPU utilization Percentage of total available processor cycles consumed by running processes top Garbage
collections
Activations of the garbage collector for stop-the-world collections
(starting and ending timestamps) JVMTI
charge of executing it. Furthermore, the information collected for each task allows visually analyzing the level of parallelism exposed by a fork/join application in terms of the number of active tasks over time, along with the occurrences of fork and join invocations during the whole execution of the application (see Sec.3.2).
Task Granularity. We define task granularity as the amount of work performed by each task. Task granularity is a key performance attribute of fork/join parallelism, because it is related to the tradeoff between the overhead caused by a task-parallel execution and the potential performance gain.
If a fork/join application uses small tasks (thus, each one car-rying out only few computations), it can keep more CPU cores busy, improve locality and scalability, and decrease the amount of time that CPU cores must idly wait for another task to be exe-cuted [20]. However, spawning an excessive number of small tasks may overwhelm parallel processing due to overheads introduced by the creation, scheduling and managing of too many small tasks [29]. On the other hand, attempting to reduce such overheads by spawn-ing only a few too large tasks (thus, each one performspawn-ing substantial computations) may result in underutilizing some of the available computing resources, given the lack of tasks to be scheduled on idle cores. In consequence, a fork/join application may suffer from load imbalance and low CPU utilization, thus limiting task parallelism. There is no general optimal solution to the aforementioned trade-offs. However, it is possible to analyze task granularity for a specific parallel application. To account task granularity, FJProf measures the computations performed in the dynamic extent of the execution method of a task, considering all of them as part of the granularity of the task. Since measuring the granularity of tasks that are created but never executed it is unfeasible, FJProf discards such tasks.
To represent the task granularity of a fork/join application, FJProfenables selecting between one of the following metrics, each one having different strengths and limitations: execution time, byte-code count, and references-cycles count. This plurality increases the portability of our tool, making it suitable for diverse environments. Using execution time (i.e., the amount of time a task was in execution, measured as wall time [36]) as the metric to characterize task granularity has some advantages. This metric is easy to profile on the JVM, requiring very little instrumentation, thus mitigating the overheads incurred due to the inserted instrumentation code. Furthermore, wall time can be interpreted very easily. On the other
hand, this metric may account for time intervals where the worker executing the task was not scheduled to execute on a computing core by the operating system, resulting in an overestimation of task granularity. Moreover, this metric is platform-dependent, limiting the reproducibility of analyses focused on the task granularity exhibited by a fork/join application.
Complementary, FJProf can measure task granularity in terms of bytecode count, i.e., the number of bytecodes executed by a task. This metric is little perturbed by the inserted instrumentation code (since the metric disregards the inserted bytecodes), is platform independent (as long as the same Java library is used), and does not require any special hardware support [4,6]. However, bytecode count may underestimate the work performed by a task since it cannot track code without bytecode representation (e.g., native code), represents computations of different complexity with the same unit, and may account bytecode that is not executed due to optimizations performed by the JVM’s dynamic compiler.
Finally, FJProf can measure task granularity by profiling the number of reference cycles1elapsed during the execution of a task (excluding intervals where the worker was not scheduled to execute on a core). Reference cycles have the advantage of taking into account the complexity of operations, accounting latencies due to misalignments and cache misses, and can be used to obtain a temporal reference provided the nominal CPU frequency is known. On the other hand, reference cycles are platform-dependent and require hardware support, thus compromising the reproducibility of analyses concerning task granularity for fork/join applications. Number of Workers. FJProf profiles the number of workers available to the fork/join pool used by the analyzed application. This information is often useful during the performance analysis of a fork/join application, because it may have an impact on the management and scheduling of tasks by the fork/join pool.
CPU Utilization. FJProf measures CPU utilization. This metric allows determining whether the CPU is well utilized by the fork/join application. For instance, low values of CPU utilization may indicate low parallelism.
Garbage Collections. Lastly, FJProf detects all activations of the Garbage Collector (GC), for stop-the-world collections i.e., pe-riods when all threads cease modifying the state of the JVM. By
1Reference cycles are collected at the nominal CPU frequency, regardless of the
tracking GC activities, FJProf can filter out fluctuations on the CPU utilization due to garbage collection. This is important since no task can be in execution during stop-the-world collections, hence, any CPU-utilization measurement would not refer to parallelism exposed by a fork/join application.
3.2
Post-processing and Output
Here, we describe the traces provided by FJProf, the offline post-processing required to refine them and the generation of graphics produced by the tool.
Generated Traces. FJProf dumps the collected information and metrics into three different traces. A first trace contains all in-formation about tasks, task granularity, fork and join occurrences, and the number of workers available to the fork/join pool. A second trace reports GC activations. Lastly, FJProf generates a trace re-porting CPU-utilization measurements. Overall, all traces provide to developers detailed information that they can use to understand the behavior of a fork/join application running on the JVM.
The traces are post-processed offline to avoid data processing overheads during application execution. FJProf performs trace refinement by removing from the final traces both non-executed tasks and metrics collected during GC. Finally, the offline post-processing automatically produces the graphics described below.
Generated Graphics. FJProf produces a variety of graphics assisting developers in visually analyzing several performance at-tributes specific to a fork/join application running on the JVM.2
To support the analysis of task granularity, FJProf generates a box plot and a Cumulative Distribution Function (CDF). Both graphics provide complementary views facilitating developers un-derstanding the distribution of task granularities exhibited by a fork/join application. Thanks to both graphics, developers can easily identify the size of the tasks dominating the execution of a fork/join application, recognizing also the presence of outliers in the form of too small or too large tasks, which can pinpoint suboptimal task granularities.
Regarding the analysis of fork/join processing, FJProf generates a graphic depicting the occurrences of the fork and join operations performed by a fork/join application over time. This graphic assists developers in visually understanding the effectiveness of a partic-ular fork/join design by detailing how a parallel application uses fork/join processing during its whole execution.
To support analyses focused on task-parallelism, FJProf pro-duces a plot describing the number of active tasks over time. This figure is key in helping developers understand the level of paral-lelism achieved by the application during its execution, enabling the identification of periods of time where the application uses a significant number of tasks as well as intervals where task-parallel processing decreases.
In addition, FJProf generates a graphic reporting the CPU uti-lization of a fork/join application over time. This figure discrimi-nates CPU-utilization measurements by the user and system (ker-nel) components, complementary showing the total and average usage. This graphic allows developers to quickly realize whether a fork/join application makes good use of the available CPU re-sources.
2Examples of all produced graphics can be found in Sec.4.
The offline post-processing is fully supported by Python script-ing, which can be easily extended by users who require conducting additional customized analyses.
3.3
Implementation
In this section we detail the components of FJProf involved in metric collection and the interactions among them.
Table1shows the components of FJProf responsible for the collection of information and metrics. FJProf instruments every task executed by a fork/join application. To this end, FJProf builds on DiSL [24], a dynamic program analysis3framework resorting to bytecode instrumentation. The use of DiSL makes possible to accu-rately profile all information about tasks, invocations of methods forkand join, task granularity (measured using wall time, byte-code count, or reference-cycles count), along with querying the Java fork/join framework to obtain the number of workers available to the fork/join pool.
DiSL is spawned on a separate JVM, i.e., the DiSL server. A native agent attached to the JVM executing the target fork/join application intercepts classloading, sending loaded classes to the DiSL server. There, the instrumentation logic determines the methods to be pro-filed and inserts instrumentation code in them. Next, the modified classes are returned to the JVM executing the target application. The DiSL weaver guarantees full bytecode coverage, i.e., DiSL instru-ments every Java method with a bytecode representation, enabling the complete instrumentation of the Java library, which is notori-ously hard to instrument [5]. To further isolate the analysis from the application, FJProf uses Shadow VM [23], a deployment setting of DiSL which runs analysis code in a separate JVM process, reduc-ing overheads incurred by the instrumentation while preventreduc-ing known issues inherent to non-isolated approaches [19]. Upon col-lection, metrics are sent to the Shadow VM, which contains most of the profiling logic and data structures. FJProf interacts with the Shadow VM thanks to a native agent attached to the JVM executing the target fork/join application.
FJProfresorts to JVMTI [32] to detect GC activity. A dedicated agent attached to the fork/join application records timestamps upon the start (event GarbageCollectionStart) and end (event GarbageCollectionFinish) of each stop-the-world garbage col-lection.
To profile CPU utilization, our profiler integrates top [18], a tool capable of querying performance counters on Unix-based distribu-tions. This metric is sampled periodically at the minimum period allowed by the tool (i.e., approximately every 150ms), where each sample profiled by top represents the instantaneous CPU utilization. Finally, to measure task granularity using reference-cycles count, FJProfresorts to Hardware Performance Counters (HPCs) that can be queried efficiently via PAPI [15], a third-party C library provid-ing a common interface to query low-level per-thread virtualized counters. A JNI [31] agent attached to the target application en-ables the instrumentation logic to efficiently activate/deactivate the accounting of reference cycles per task execution.
3Dynamic program analysis employs runtime techniques (such as instrumentation
4
EVALUATION
In this section we evaluate FJProf, showing how it helps developers characterize a fork/join application running on the JVM.
4.1
Target Benchmark
Our evaluation targets a modern, complex and realistic fork/join application running on a single JVM in a shared-memory multicore. Specifically, we apply FJProf to a workload from Renaissance [38], a recently released benchmark suite for the JVM. This suite con-tains several modern, real-world, concurrent and object-oriented workloads that exercise various concurrency primitives. In contrast to previous well-known benchmarks suites for the JVM, such as DaCapo [7], ScalaBench [44], and SPECjvm2008 [8], Renaissance includes a workload specifically exercising fork/join parallelism: fj-kmeans. This workload implements a K-means4clustering al-gorithm that uses the Java fork/join framework. We use the latest release of Renaissance as time of writing, i.e., Renaissance v0.10, released on October 30, 2019.
4.2
Experimental Setup
The evaluation presented here considers only the steady-state, i.e., the state achieved after running several warm-up iterations until GC ergonomics and dynamic compilation stabilize. We run 30 warm-up iterations before profiling the benchmark with FJProf, which corresponds to the default repetition number for fj-kmeans as set by the developers of Renaissance [39].
We conduct our evaluation on a server-class machine equipped with two NUMA nodes, each one with an Intel Xeon E5-2680 (2,7 GHz) processor with 8 physical cores and 64 GB of RAM, running under Ubuntu 18.04.3 LTS. When profiling the workload, no other resource-intensive application was in execution. Moreover, we pin fj-kmeans to an exclusive NUMA node (i.e., other processes, includ-ing the DiSL Server and Shadow VM run on a different NUMA node). This deployment setting increases the isolation of the workload as it exclusively utilizes the CPU cores and the memory of its dedicated underlying NUMA node. Turbo Boost and Hyper-Threading are disabled, and the CPU governor is set to “performance”. Lastly, we use Java OpenJDK 1.8.0_222, build 25.222-b10.
4.3
Characterizing a Fork/Join Application
In this section we show how FJProf assists developers in character-izing several performance attributes that are specific to a fork/join application.
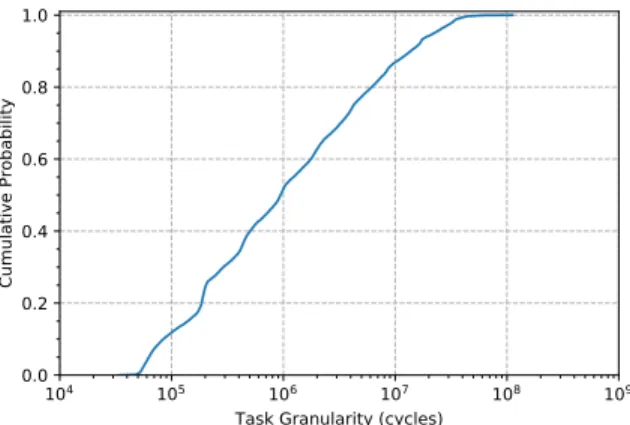
Task Granularity. When profiling fj-kmeans, FJProf detects 21 412 tasks spawned during the execution of the workload. In Figure1, we present the CDF of task granularity for fj-kmeans. The x-axis reports task granularity in terms of references-cycle count using a logarithmic scale, whereas the y-axis shows the cumulative probability. In the figure, we can observe that the size of most of the tasks (88.18%) spawned by fj-kmeans is within the range between 105and 108reference cycles.
Complementary, Figure2reports the box plot of the distribution of task granularity for fj-kmeans. The y-axis represents task granularity on a logarithmic scale. The green line represents
4K-means is a clustering algorithm that groups a set of items not previously classified
into a predefined number of k clusters.
104 105 106 107 108 109
Task Granularity (cycles) 0.0 0.2 0.4 0.6 0.8 1.0 Cu mu lat ive Pr ob ab ilit y
Figure 1: Cumulative Distribution Function (CDF) of task granularity for fj-kmeans.
104 105 106 107 108 109 Ta sk G ra nu la ri ty ( cy cl es)
Figure 2: Box plot of the distribution of task granularity for fj-kmeans.
the median (945 122 reference cycles). The lower and upper blue lines represent the first quartile (203 101 reference cycles), and the third quartile (4 256 321 reference cycles), respectively. The outliers are plotted individually as circles (they can be seen above the box). The traces show a group of 2 807 tasks, mainly of class org.renaissance.jdk.concurrent.JavaKMeans$Assignment-Task, executing more than 107 reference cycles. The largest granularity is equal to 111 476 466 reference cycles. The results presented in Figures1and2suggest that fj-kmeans may feature several tasks of a large size, which could be split into smaller tasks. This may lead to an improved load balancing and better CPU utilization, potentially enabling speedups.
Fork and Join Operations. Figure3shows the occurrences of fork and join operations executed by fj-kmeans. The x-axis shows the execution time of the application as a percentage, while the y-axis reports the number of occurrences over time.5The traces show that fj-kmeans executes 664 802 fork and join operations in total.
5Figures3and4are obtained by diving the total execution time of the application into
0% 20% 40% 60% 80% 100% Execution Time 0 1000 2000 3000 4000 5000 6000 7000 8000 Oc urr en ce s forks joins
Figure 3: Rate of fork and join operations over time in fj-kmeans. 0% 20% 40% 60% 80% 100% Execution Time 0 50 100 150 200 250 300 350 Nu mb er of Ac tiv e T ask s
Figure 4: Active tasks over time in fj-kmeans.
From the figure, it is possible to the determine that the workload exercises fork/join processing during its whole execution. Despite the presence of some large tasks, most of the tasks execute for short time, causing the two lines in the figure to visually overlap.
Active Tasks over Time. To better understand the level of parallelism achieved by fj-kmeans in terms of the executed tasks, Figure4shows the amount of active tasks over time. The x-axis reports the execution time of the application as a percentage, while the y-axis shows the number of active tasks over time. The green line representing active tasks allows determining that fj-kmeans exposes task-parallelism during its whole execution, reaching a peak of 354 tasks being executed concurrently around the 17% of the execution time. FJProf also reports that the number of workers available to the fork/join pool used by fj-kmeans is a fixed value cor-responding to the total number of available cores (8 in the machine used for the evaluation).
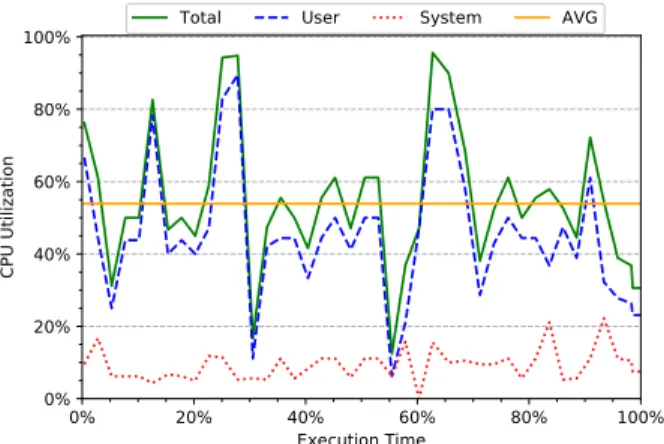
CPU Utilization. Finally, Figure5reports the CPU utilization of fj-kmeans over time. The x-axis reports the execution time of the application as a percentage, whereas the y-axis shows CPU utiliza-tion. The time unit used to produce the figure corresponds to 150ms,
0% 20% 40% 60% 80% 100% Execution Time 0% 20% 40% 60% 80% 100% CPU Ut iliz ati on
Total User System AVG
Figure 5: CPU utilization over time in fj-kmeans when using 8 workers.
which is the minimum sampling time for CPU utilization enabled by top. Measurements sampled during stop-the-world garbage col-lections have been removed. Figure5discriminates CPU-utilization measurements considering the user and system components, also showing the total and average usage. As shown in the figure, most of the time the CPU is not fully utilized, exhibiting an average uti-lization value of 53.90%. This suggests that the workload may better utilize the available computing resources during its execution.
4.4
Optimizing Task Granularity of fj-kmeans
After analyzing the results reported by FJProf, we can determine that fj-kmeans can be optimized. Concretely, the workload exhibits several large tasks that may limit CPU utilization. Based on these findings, we reduce the task granularity of the benchmark. In fj-kmeans, task granularity is inversely proportional to the number of available workers by algorithm design. Hence, to reduce task granularity, we increase the number of workers available to the fork/join pool supporting the execution of fj-kmeans. This number can be easily changed by passing the target number of workers6via the system property java.util.concurrent.ForkJoinPool.common.parallelism. As previously mentioned, the number of workers set in the original configuration of fj-kmeans corresponds to the total number of CPU cores available to the JVM, i.e., the value returned by method Runtime.availableProcessors [28], which is equal to 8 in the machine used for the evaluation.
From the initial value of 8, we iteratively double the number of workers, measuring the speedup obtained by this modification. We continue this approach until no speedup is observed. Our evaluation results show that increasing the number of workers of the fork/join pool used by fj-kmeans leads to a maximum speedup up of 6% when 128 workers are used.
The total number of tasks spawned in this setting is equal to 29 604, the median of the granularities exhibited by the workload is 823 730 references cycles, and the largest granularity observed is
6According to the Java API [28], this number must be a non-negative integer with a
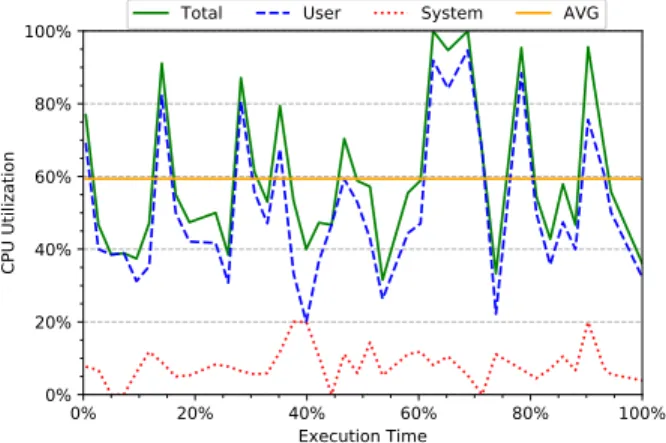
0% 20% 40% 60% 80% 100% Execution Time 0% 20% 40% 60% 80% 100% CPU Ut iliz ati on
Total User System AVG
Figure 6: CPU utilization over time in fj-kmeans when using 128 workers.
95 112 333 reference cycles. Figure6reports the CPU utilization of fj-kmeans when using 128 workers, which show an average CPU utilization of 59.36%, The speedup obtained may be attributed to the lower task granularity, which in turn enables a better load balanc-ing and allows more tasks to be effectively distributed among the available computing resources, as demonstrated by the increased CPU utilization. Further potential optimizations involving code refactoring (aimed at better splitting the work among tasks) are part of our future work. Overall, our evaluation results show that FJProfenables characterizing fork/join parallelism on the JVM, providing developers useful information that they can use to un-derstand the behavior of a modern, complex and realistic fork/join application running on the JVM.
5
RELATED WORK
This section discusses studies related to our approach. We first consider work focused on the analysis of fork/join parallelism on the JVM. Next, we compare FJProf to existing tools for profiling and analyzing multiple characteristics of parallel applications.
Fork/Join Parallelism on the JVM. To the best of our knowl-edge, only a few studies focus on fork/join parallelism on the JVM. In a preliminary position paper by the authors [42], we sketch some of the ideas behind the tool introduced in this paper.
De Wael et al. [9] inspect the code of 120 projects to study the use of the Java fork/join framework, confirming manually the fre-quent use of four best coding practices and three anti-patterns that potentially limit parallel performance. The authors provide prac-tical conclusions that guide language or framework designers in proposing abstractions that steer developers toward using the right patterns while developing a fork/join application.
Pinto et al. [37] focus on studying parallelism problems in fork/join applications running on the JVM, identifying six bot-tlenecks impacting both performance and energy efficiency. They also present FJDETECTOR, a proof-of-concept Eclipse plugin for de-tecting some of the bottlenecks identified by the authors, relying on code inspection to prototype the analysis of applications adhering to three basic fork/join designs.
Overall, the above work provides meaningful insights on identi-fying good and bad coding practices mainly by means of inspecting the source code of a fork/join application. Complementary, our work specifically addresses the profiling of fork/join applications running on the JVM. Unlike the aforementioned work, our tool benefits from the use of dynamic program analysis to accurately collect several key metrics and information, enabling the study of parallel characteristics of a fork/join application that are beyond the scope of techniques resorting to simple code inspection. Fur-thermore, our evaluation results show that FJProf is not limited to the analysis of applications adhering to basic, fixed fork/join designs, but assists developers in conducting performance analysis of complex fork/join applications targeting the JVM nowadays.
Parallelism Profilers. Many tools originated in industry and academia analyze various parallel aspects of an application.
Several parallelism profilers based on the work-span model [17] target parallel applications. Cilkview [13] builds upon this model to predict achievable speedup bounds for a Cilk [11] application when the number of used cores increases. CilkProf [43] extends Cilkview by assessing computations on each call site to determine which of them constitutes a bottleneck towards parallelization. Despite these tools allow detecting bottlenecks and discovering parallelization opportunities, they do not target fork/join parallelism on the JVM. tgp[41] is a profiler for multi-threaded applications running on the JVM, which detects all tasks executed by a parallel application. Unfortunately, the profiling model of tgp is suitable only for Java thread pools [35]. The analyses obtained with tgp are highly specific to thread pools and cannot be generalized to applications using fork/join pools, as the task model implemented by thread pools to perform task-parallelism notably differs from the one used by fork/join pools. tgp lacks knowledge of the internals of the Java fork/join framework, resulting in profiles at a low abstraction level that fall short in recognizing the key characteristics of the fork/join processing executed by a parallel application targeting the JVM. Complementary, FJProf incorporates profiling techniques specifi-cally addressing performance analysis of the fork/join parallelism exposed by an application running on the JVM, providing detailed information and easy-to-interpret graphics that aid developers in the understanding of several key characteristics of fork/join appli-cations.
HPCToolkit [1] is a suite of tools aimed at locating and quantify-ing scalability bottlenecks in parallel programs. The suite instru-ments the binaries of the target application to achieve language-independency, and relies massively on HPCs. THOR [46] helps developers understand the state of a Java thread, i.e., whether the thread is running on a core or is idling. Finally, many tools support the analysis of parallel Java applications through the collection of metrics at the application level. Most notable examples include Vi-sualVM [47], Oracle Developer Studio Performance Analyzer [25], Java Mission Control [30], JProfiler [10] and YourKit [49]. Some tools, such as Intel VTune [16], also support hardware-level profil-ing resortprofil-ing to HPCs. Overall, despite the tools mentioned above focus on several features of parallel applications running on the JVM, none of them specializes on fork/join applications, falling short in analyzing performance attributes that are crucial to un-derstand the behavior of this type of parallel applications. Rather than focusing on the high-level characterization of processes or
threads over time, our tool enables a fine-grained characterization of a fork/join application at the task level, facilitating developers in conducting performance analysis on key attributes specifically describing fork/join processing, including the level of parallelism in terms of the number of tasks spawned over time, the distribution of task granularities, and the occurrences of fork and join operations during the execution of the application.
6
CONCLUSIONS
In this paper, we presented FJProf, a novel profiler for fork/join applications running on the JVM. We are not aware of any other profiler relying on dynamic program analysis to accurately collect information and metrics specifically focused on fork/join applica-tions targeting the JVM. We used FJProf to characterize a realistic, modern and complex fork/join application, analyzing several per-formance attributes specific to fork/join parallelism, including task granularity, the level of parallelism in terms of active tasks over time, and the number of fork and join operations.
As part of our future work, we plan to extend FJProf to support the analysis of other parallel aspects of fork/join applications, such as the analysis of contention among the spawned tasks. We also plan to conduct further performance analyses focused on the scheduling of tasks by the work-stealing algorithm. Finally, we plan to release FJProfas open-source software.
REFERENCES
[1] L. Adhianto, S. Banerjee, M. Fagan, M. Krentel, G. Marin, J. Mellor-Crummey, and N. R. Tallent. 2010. HPCTOOLKIT: Tools for Performance Analysis of Optimized Parallel Programs. Concurr. Comput.: Pract. Exper. 22, 6 (2010), 685–701. [2] Apache Groovy project. 2019. Groovy.http://www.groovy-lang.org/. (2019). [3] Colin Barrett, Christos Kotselidis, and Mikel Luján. 2016. Towards Co-designed
Optimizations in Parallel Frameworks: A MapReduce Case Study. In CF. 172–179. [4] Walter Binder. 2005. A Portable and Customizable Profiling Framework for Java
Based on Bytecode Instruction Counting. In APLAS. 178–194.
[5] Walter Binder, Jarle Hulaas, and Philippe Moret. 2007. Advanced Java Bytecode Instrumentation. In PPPJ. 135–144.
[6] Walter Binder, Jane G. Hulaas, and Alex Villazón. 2001. Portable Resource Control in Java. In OOPSLA. 139–155.
[7] Stephen M. Blackburn, Robin Garner, Chris Hoffmann, Asjad M. Khang, Kathryn S. McKinley, Rotem Bentzur, Amer Diwan, Daniel Feinberg, Daniel Frampton, Samuel Z. Guyer, Martin Hirzel, Antony Hosking, Maria Jump, Han Lee, J. Eliot B. Moss, Aashish Phansalkar, Darko Stefanović, Thomas VanDrunen, Daniel von Dincklage, and Ben Wiedermann. 2006. The DaCapo Benchmarks: Java Bench-marking Development and Analysis. In OOPSLA. 169–190.
[8] Standard Performance Evaluation Corporation. 2019. SPECjvm2008. https: //www.spec.org/jvm2008/. (2019).
[9] Mattias De Wael, Stefan Marr, and Tom Van Cutsem. 2014. Fork/Join Parallelism in the Wild: Documenting Patterns and Anti-patterns in Java Programs Using the Fork/Join Framework. In PPPJ. 39–50.
[10] ej-technologies. 2019. JProfiler. https://www.ej-technologies.com/products/ jprofiler/overview.html. (2019).
[11] Matteo Frigo, Charles E. Leiserson, and Keith H. Randall. 1998. The Implementa-tion of the Cilk-5 Multithreaded Language. In PLDI. 212–223.
[12] Philipp Haller and Martin Odersky. 2009. Scala Actors: Unifying Thread-based and Event-based Programming. Theor. Comput. Sci. 410, 2-3 (2009), 202–220. [13] Yuxiong He, Charles E. Leiserson, and William M. Leiserson. 2010. The Cilkview
Scalability Analyzer. In SPAA. 145–156.
[14] Zhang Hong, Wang Xiao-ming, Cao Jie, Ma Yan-hong, Guo Yi-rong, and Wang Min. 2016. An Optimized Model for MapReduce Based on Hadoop. TELKOMNIKA 14 (12 2016), 1552.
[15] ICL. 2019. PAPI.http://icl.utk.edu/papi/. (2019).
[16] Intel. 2019. Intel VTune Amplifier. https://software.intel.com/en-us/intel-vtune-amplifier-xe. (2019).
[17] Joseph JaJa. 1992. Introduction to Parallel Algorithms. Addison-Wesley Profes-sional.
[18] James C. Warner. 2013. top(1) - Linux man page.https://linux.die.net/man/1/top. (2013).
[19] Stephen Kell, Danilo Ansaloni, Walter Binder, and Lukáš Marek. 2012. The JVM is Not Observable Enough (and What to Do About It). In VMIL. 33–38. [20] Doug Lea. 1999. Concurrent Programming in Java. Second Edition: Design Principles
and Patterns (2nd ed.). Addison-Wesley Professional. [21] Doug Lea. 2000. A Java Fork/Join Framework. In JAVA. 36–43. [22] Lightbend Inc. 2019. Akka.http://akka.io. (2019).
[23] Lukáš Marek, Stephen Kell, Yudi Zheng, Lubomír Bulej, Walter Binder, Petr Tůma, Danilo Ansaloni, Aibek Sarimbekov, and Andreas Sewe. 2013. ShadowVM: Robust and Comprehensive Dynamic Program Analysis for the Java Platform. In GPCE. 105–114.
[24] Lukáš Marek, Alex Villazón, Yudi Zheng, Danilo Ansaloni, Walter Binder, and Zhengwei Qi. 2012. DiSL: A Domain-specific Language for Bytecode Instrumen-tation. In AOSD. 239–250.
[25] Oracle. 2017. Performance Analyzer.https://docs.oracle.com/cd/E77782_01/html/ E77798/index.html. (2017).
[26] Oracle. 2019. Class Arrays.https://docs.oracle.com/javase/8/docs/api/java/util/ Arrays.html. (2019).
[27] Oracle. 2019. Class CompletableFuture<T>.https://docs.oracle.com/javase/8/ docs/api/java/util/concurrent/CompletableFuture.html. (2019).
[28] Oracle. 2019. Class ForkJoinPool.https://docs.oracle.com/javase/9/docs/api/java/ util/concurrent/ForkJoinPool.html. (2019).
[29] Oracle. 2019. Class ForkJoinTask<V>.https://docs.oracle.com/javase/9/docs/api/ java/util/concurrent/ForkJoinTask.html. (2019).
[30] Oracle. 2019. Java Mission Control.http://www.oracle.com/technetwork/java/ javaseproducts/mission-control/java-mission-control-1998576.html. (2019). [31] Oracle. 2019. Java Native Interface. http://docs.oracle.com/javase/8/docs/
technotes/guides/jni/. (2019).
[32] Oracle. 2019. Java Virtual Machine Tool Interface (JVM TI).https://docs.oracle. com/javase/8/docs/technotes/guides/jvmti/. (2019).
[33] Oracle. 2019. Package java.util.stream.https://docs.oracle.com/javase/9/docs/ api/java/util/stream/package-summary.html. (2019).
[34] Oracle. 2019. The Java Tutorials - Fork/Join. https://docs.oracle.com/javase/ tutorial/essential/concurrency/forkjoin.html. (2019).
[35] Oracle. 2019. Thread Pools.https://docs.oracle.com/javase/tutorial/essential/ concurrency/pools.html. (2019).
[36] Achille Peternier, Walter Binder, Akira Yokokawa, and Lydia Chen. 2013. Par-allelism Profiling and Wall-time Prediction for Multi-threaded Applications. In ICPE. 211–216.
[37] Gustavo Pinto, Anthony Canino, Fernando Castor, Guoqing Xu, and Yu David Liu. 2017. Understanding and Overcoming Parallelism Bottlenecks in Fork/Join Applications. In ASE 2017. 765–775.
[38] Aleksandar Prokopec, Andrea Rosà, David Leopoldseder, Gilles Duboscq, Petr Tůma, Martin Studener, Lubomír Bulej, Yudi Zheng, Alex Villazón, Doug Simon, Thomas Würthinger, and Walter Binder. 2019. Renaissance: Benchmarking Suite for Parallel Applications on the JVM. In PLDI. 31–47.
[39] Renaissance Suite. 2019. Documentation Overview.https://renaissance.dev/docs. (2019).
[40] Rich Hickey. 2018. The Clojure Programming Language. https://clojure.org. (2018).
[41] Andrea Rosà, Eduardo Rosales, and Walter Binder. 2018. Analyzing and Optimiz-ing Task Granularity on the JVM. In CGO. 27–37.
[42] Eduardo Rosales, Andrea Rosà, and Walter Binder. 2019. Optimization Coaching for Fork/Join Applications on the Java Virtual Machine. In Programming. 7:1–7:3. [43] Tao B. Schardl, Bradley C. Kuszmaul, I-Ting Angelina Lee, William M. Leiserson,
and Charles E. Leiserson. 2015. The Cilkprof Scalability Profiler. In SPAA. 89–100. [44] Andreas Sewe, Mira Mezini, Aibek Sarimbekov, and Walter Binder. 2011. Da Capo Con Scala: Design and Analysis of a Scala Benchmark Suite for the Java Virtual Machine. In OOPSLA. 657–676.
[45] Robert Stewart and Jeremy Singer. 2018. Comparing Fork/Join and MapReduce. (2018).
[46] Q. M. Teng, H. C. Wang, Z. Xiao, P. F. Sweeney, and E. Duesterwald. 2010. THOR: a Performance Analysis Tool for Java Applications Running on Multicore Systems. IBM Journal of Research and Development 54, 5 (2010), 4:1–4:17.
[47] VisualVM. 2015. VisualVM.https://visualvm.github.io. (2015).
[48] F Warren Burton and Michael Sleep. 1981. Executing Functional Programs on a Virtual Tree of Processors. FPCA (1981), 187–194.