HAL Id: hal-00877132
https://hal-univ-rennes1.archives-ouvertes.fr/hal-00877132
Submitted on 6 Apr 2017
HAL is a multi-disciplinary open access
archive for the deposit and dissemination of
sci-entific research documents, whether they are
pub-lished or not. The documents may come from
teaching and research institutions in France or
abroad, or from public or private research centers.
L’archive ouverte pluridisciplinaire HAL, est
destinée au dépôt et à la diffusion de documents
scientifiques de niveau recherche, publiés ou non,
émanant des établissements d’enseignement et de
recherche français ou étrangers, des laboratoires
publics ou privés.
spindle pole oscillations in Caenorhabditis embryos.
Soizic Riche, Melissa Zouak, Françoise Argoul, Alain Arneodo, Jacques
Pecreaux, Marie Delattre
To cite this version:
Soizic Riche, Melissa Zouak, Françoise Argoul, Alain Arneodo, Jacques Pecreaux, et al.. Evolutionary
comparisons reveal a positional switch for spindle pole oscillations in Caenorhabditis embryos.. Journal
of Cell Biology, Rockefeller University Press, 2013, 201 (5), pp.653-62. �10.1083/jcb.201210110�.
�hal-00877132�
The Rockefeller University Press $30.00
M. Zouak and F. Argoul contributed equally to this paper. Correspondence to Marie Delattre: [email protected]
Abbreviations used in this paper: A/P, anterior/posterior; DIC, differential interference contrast; NCC, nuclei–centrosome complex; NEBD, nuclear en-velope breakdown.
Introduction
The first embryonic asymmetric division of the nematode
Cae-norhabditis elegans
has been essential to reveal the biophysical
and molecular mechanisms controlling nuclei and spindle
posi-tioning (Gönczy, 2008). In C. elegans and in many other
nema-tode species, the mitotic spindle is asymmetrically localized at
the end of the first cell cycle, giving rise to a small posterior cell
and a large anterior cell after cytokinesis (Brauchle et al., 2009).
In a preliminary study, we found that spindle trajectories inside
the cell differed between species and from those observed in
the reference species C. elegans. In this work, we used the
dif-ferences found in one of C. elegans closest known relatives,
Caenorhabditis briggsae
, as variant phenotypes to further explore
the mechanisms of nuclei and spindle positioning.
In C. elegans, pronuclei meet at the posterior end of the
cell after fertilization. During prophase, unbalanced pulling
forces act on the astral microtubules, leading to the
centra-tion and rotacentra-tion of the assembled nuclei–centrosome
com-plex (NCC) along the anterior/posterior (A/P) axis of the cell
(Labbé et al., 2004; Kimura and Onami, 2005). At the onset of
mitosis, cortical-force generators pull on the astral microtubules
with stronger forces toward the posterior pole (Grill et al., 2001;
Labbé et al., 2004; McCarthy Campbell et al., 2009). During
anaphase, therefore, the spindle is posteriorly displaced and
undergoes transverse oscillations, whose amplitude reflects the
strength of these pulling forces (Pecreaux et al., 2006; Redemann
et al., 2011).
Proteins involved in cortical pulling forces form a
com-plex that is functionally conserved from worms to mammals to
control spindle positioning (Werts et al., 2011). In C. elegans,
this complex contains the G protein G subunit, which is anchored
to the cortex. G binds the G protein regulators GPR-1 and
GPR-2 (referred to as GPR-1/2), which bind the NuMA
ho-mologue, LIN-5. LIN-5 interacts with the minus end–directed
motor dynein. The anchoring of dynein to the cortex via this
ternary complex, in conjunction with depolymerizing astral
microtubules, is thought to generate pulling forces (Gönczy,
2008). GPR-1/2 and LIN-5 are found at the cortex and show a
D
uring the first embryonic division in
Caenorhabdi-tis elegans, the mitotic spindle is pulled toward the
posterior pole of the cell and undergoes vigorous
transverse oscillations. We identified variations in spindle
trajectories by analyzing the outwardly similar one-cell
stage embryo of its close relative Caenorhabditis briggsae.
Compared with C. elegans, C. briggsae embryos exhibit
an anterior shifting of nuclei in prophase and reduced
anaphase spindle oscillations. By combining physical
per-turbations and mutant analysis in both species, we show
that differences can be explained by interspecies changes
in the regulation of the cortical G–GPR–LIN-5 complex.
However, we found that in both species (1) a conserved
positional switch controls the onset of spindle oscillations,
(2) GPR posterior localization may set this positional
switch, and (3) the maximum amplitude of spindle
oscil-lations is determined by the time spent in the oscillating
phase. By investigating microevolution of a subcellular
process, we identify new mechanisms that are
instrumen-tal to decipher spindle positioning.
Evolutionary comparisons reveal a positional
switch for spindle pole oscillations in
Caenorhabditis embryos
Soizic Riche,
1Melissa Zouak,
1Françoise Argoul,
2Alain Arneodo,
2Jacques Pecreaux,
3and Marie Delattre
11Laboratory of Molecular Biology of the Cell, UMR5239, and 2Laboratory of Physics, UMR5672, Ecole Normale Supérieure de Lyon, Centre National de la Recherche
Scientifique, 69007 Lyon, France
3Institute of Genetics and Developmental Biology, Centre National de la Recherche Scientifique, UMR6290, University of Rennes 1, 35043 Rennes, France
© 2013 Riche et al. This article is distributed under the terms of an Attribution–Noncommercial– Share Alike–No Mirror Sites license for the first six months after the publication date (see http://www.rupress.org/terms). After six months it is available under a Creative Commons License (Attribution–Noncommercial–Share Alike 3.0 Unported license, as described at http://creativecommons.org/licenses/by-nc-sa/3.0/).
THE
JOURNAL
OF
CELL
BIOLOGY
on January 7, 2014
jcb.rupress.org
Downloaded from
http://jcb.rupress.org/content/suppl/2013/05/16/jcb.201210110.DC1.html Supplemental Material can be found at:on January 7, 2014
jcb.rupress.org
Downloaded from
on January 7, 2014
jcb.rupress.org
Downloaded from
on January 7, 2014
jcb.rupress.org
Downloaded from
on January 7, 2014
jcb.rupress.org
Downloaded from
on January 7, 2014
jcb.rupress.org
Downloaded from
We found two main differences in spindle trajectories
be-tween C. elegans and C. briggsae embryos that may reflect
dif-ferential regulation of intracellular forces. We explored these
phenotypes using a combination of physical perturbation of the
mitotic spindle and analysis of mutant or RNAi phenotypes in
both species.
Results and discussion
NCC and spindle positioning differ between C. elegans and C. briggsae embryos
To analyze nuclei and spindle movements of both C. elegans N2
and C. briggsae JU1018 strains, we tracked the position of both
slight enrichment at the anterior cortex during NCC centration/
rotation and at the posterior cortex during mitosis (Colombo
et al., 2003; Gotta et al., 2003; Park and Rose, 2008). Thus,
the dynamic localization of GPR-1/2/LIN-5 correlates with the
direction of forces throughout the cell cycle and may reflect the
position of active force generators. However, inactivation of G
or GPR-1/2 slows down but does not prevent NCC centration in
C. elegans
(Goulding et al., 2007; Park and Rose, 2008), which
suggests that mechanisms independent of the ternary
com-plex act in parallel to position the NCC in the cell center. Such
mechanisms involve cortical dynein-dependent gliding of
micro-tubules or cytoplasmic dynein pulling along microtubule length
(Gusnowski and Srayko, 2011; Kimura and Kimura, 2011).
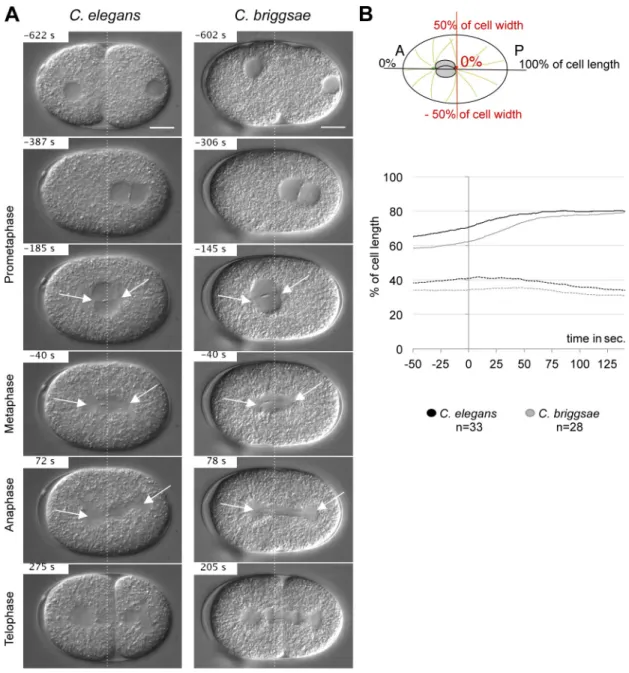
Figure 1. The first asymmetric division in C. elegans and C. briggsae embryos. (A) Snapshots from DIC recordings of C. elegans and C. briggsae wild-type strains. Time is shown relative to anaphase onset (t = 0 s). Anterior is to the left. Broken lines are positioned at 50% of embryo length. Arrows show the asters. Bars, 10 µm. (B) Drawing of a one-cell stage embryo. The horizontal axis corresponds to the A/P axis: 0% defines the anterior pole of the cell. The transverse axis is in red: 0% is the center of the cell. On the bottom panel, the mean position of the centrosome along the A/P axis is shown relative to anaphase onset (t = 0 s) for both species. –50 s corresponds to metaphase and 125 s to cytokinesis onset. Solid and broken lines represent the posterior and anterior centrosomes, respectively.
on January 7, 2014
jcb.rupress.org
in both species, they lasted 30 s less in C. briggsae than those
in C. elegans (Fig. 2 C and Table S1). We also found a
correla-tion between oscillacorrela-tion onset and a specific posicorrela-tion of the
pos-terior centrosome along the A/P axis, corresponding to 70% of
embryo length in both species and in C. elegans embryos with
genetically altered size (Fig. 2 D, Fig. S1 A, and Table S1).
We then repeated the same measurements using two
other C. elegans and C. briggsae strains. We confirmed that the
observed spindle trajectories were not strain-specific but rather
reflected a consistent interspecies divergence (Table S1).
Because C. briggsae is more frequently found in tropical
regions and can grow at higher temperatures than C. elegans
(Dolgin et al., 2008), we grew and recorded C. briggsae animals at
28°C. These embryos still exhibited different spindle trajectories
compared with C. elegans embryos raised at 23°C (Table S1). For
these cellular processes, therefore, differences between species
do not result from thermal adaptations of C. briggsae animals.
asters over time from differential interference contrast (DIC)
recordings. Although the NCC formed at the posterior side of
the cell in both species, it was systematically displaced beyond
the center of the cell in C. briggsae embryos. Because of this
“overcentration,” the metaphase spindle formed more anteriorly
in C. briggsae than in C. elegans. At the end of anaphase, however,
the posterior spindle pole reached the same final position in both
species (as a percentage of total cell length; Fig. 1, A and B;
Videos 1 and 2
; and
Table S1
).
Another important difference between these species
in-volved the spindle oscillations during anaphase. Although the
fre-quency of oscillations was similar between species, we found a
strong diminution in oscillation amplitude for both centrosomes in
C. briggsae
embryos compared with C. elegans (Fig. 2, A and B;
and Table S1). Moreover, the spindle began to oscillate at
ana-phase onset in C. elegans embryos, whereas it started 30 s later
in C. briggsae embryos. As oscillations ended at the same time
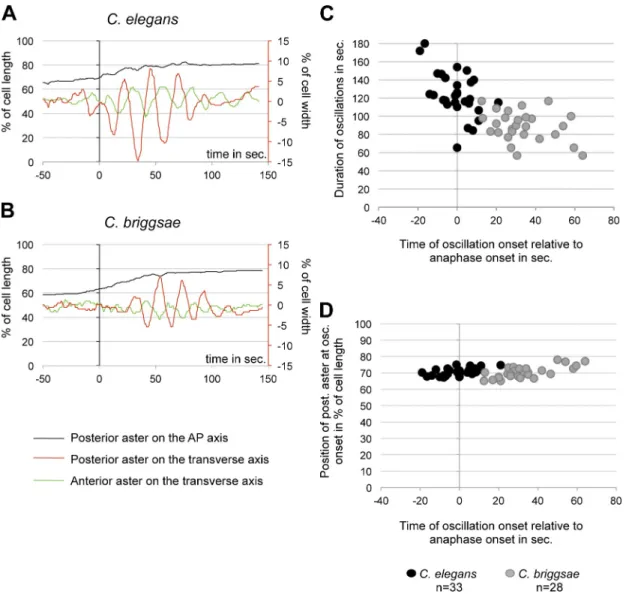
Figure 2. Spindle oscillations differ between C. elegans and C. briggsae embryos. (A and B) Centrosome displacement on the A/P (y axis on the left) and transverse axes (y axis on the right) relative to anaphase onset (t = 0 s) for one representative embryo per species. The position of the posterior centrosome on the A/P axis is represented by a black curve, while its position on the transverse axis is shown in red. Transverse movements of the anterior centrosome are shown in green. (C) The onset and end of posterior centrosome oscillations were measured manually from graphs of transverse oscillations (see A and B). Oscillation duration for each embryo is represented relative to the time at oscillation onset (in seconds from anaphase onset). (D) The position of the poste-rior centrosome in percentage of cell length at the beginning of oscillation is plotted versus the time at oscillation (in seconds from anaphase onset).
on January 7, 2014
jcb.rupress.org
depends on G proteins, as shown for C. elegans embryos
(Fig. S2, B–D). Last, we performed laser microsurgery of the
central spindle during anaphase (Grill et al., 2001) and
re-vealed unbalanced pulling forces acting on astral microtubules
(Fig. S1 F). Thus, in C. briggsae embryos, G–GPR–LIN-5–
dependent asymmetric pulling forces are also involved in
spin-dle positioning and oscillations during anaphase.
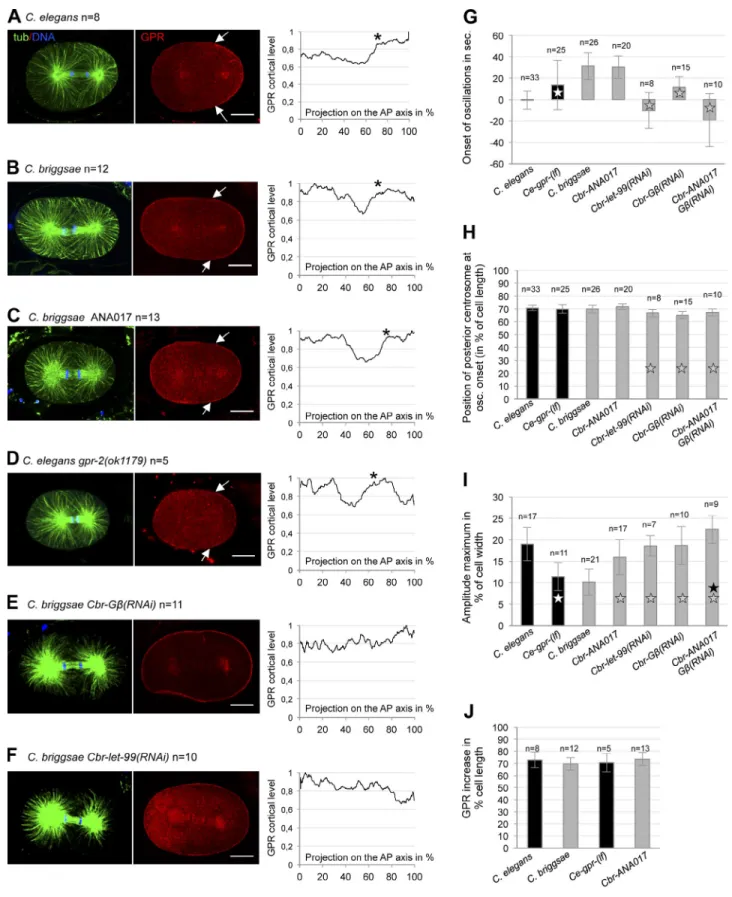
Next, we found that Cbr-GPR-2 localization shows
dy-namic patterns during the first cell cycles (Fig. S2 B). In
ana-phase embryos, similar to C. elegans embryos, levels of cortical
Cbr-GPR-2 were low in the cell center while a steep increase
was detected around 70% of embryo length (Fig. 4, B and J).
In both species, therefore, the enrichment of posterior cortical
GPR coincides with the positional switch for oscillation onset.
GPR localization influences the oscillation onset; GPR levels act on oscillation amplitude
In C. elegans, GPR acts on anaphase spindle oscillations in a
dose-dependent manner (Pecreaux et al., 2006; Redemann et al.,
2011). Interestingly, the C. briggsae genome contains one gpr
gene, whereas C. elegans has two, which is consistent with
hav-ing reduced spindle oscillations in C. briggsae. We first tested
whether the difference in gene copy number is responsible for
the different spindle motion observed between species.
We first analyzed C. briggsae embryos from the ANA017
line expressing an excess of Cbr-GFP-GPR-2. Although these
embryos still exhibited NCC overcentration, anaphase spindle
oscillations were closer to C. elegans oscillations in
ampli-tude. Reciprocally, C. elegans mutants for either gpr-1 or gpr-2
displayed smaller transverse oscillations that were similar to
C. briggsae
oscillations in amplitude (Fig. 4 I, Fig. 5 A, and
Videos 5 and 6
). However, modification of gpr gene copy
num-ber in both species had no impact on the onset of spindle
oscil-lations, both in position and time (Fig. 4, G and H). Moreover,
we did not observe changes in the domain boundary of GPR
in these conditions, reinforcing the correlation between GPR
localization and oscillation onset. (Fig. 4, C, D, and J). Thus,
interspecies changes in GPR levels may only explain the
differ-ences observed in the amplitude of oscillations.
To test a direct role of GPR on oscillation onset, we
at-tempted to affect the size of the GPR domain. Although we
could not identify experimental conditions leading to a change
in position of the GPR transition zone, we analyzed embryos
for which GPR decorates the entire cortex. We reasoned that if
GPR is present above the centrosomes when cortical motors are
turned on, microtubules could be prematurely captured.
Conse-quently, oscillations would be triggered when the spindle is in a
more central position. In C. briggsae embryos, as in C. elegans,
we found that GPR invades the entire cortex after removal of
the G subunit of heterotrimeric G proteins (Thyagarajan et al.,
2011) or the DEP domain protein LET-99 (Tsou et al., 2003;
Fig. 4, E and F). Importantly, the onset of spindle oscillations
was precocious in time and position in both conditions. We also
found increased oscillation amplitude compared with wild-type
C. briggsae
, which is consistent with our previous observation
The position of the posterior centrosome dictates oscillation onset in both species
We first investigated the conserved correlation between
oscil-lation onset and position of the posterior centrosome along the
A/P axis. We tested the existence of a positional control for
os-cillation onset. Because the posterior centrosome was located at
62.9% at anaphase onset in C. briggsae embryos, the oscillation
delay found in this species could result from the time it took the
posterior centrosome to reach 70% (in C. elegans the posterior
centrosome was already located at 70.9% at anaphase onset;
Table S1). Alternatively, the time delay observed in oscillation
onset could reflect a delay in the activation of cortical force
gen-erators between species.
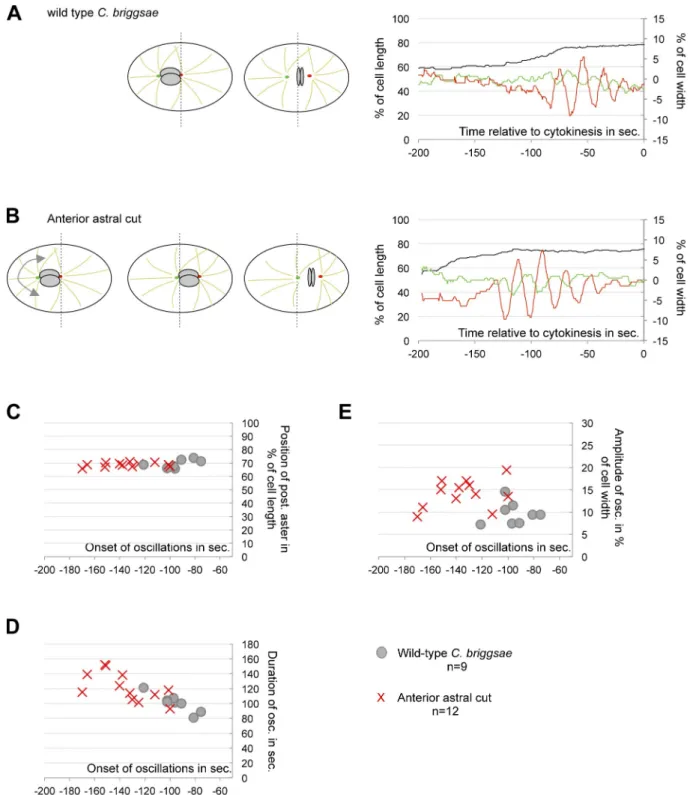
To determine whether spindle oscillations are temporally or
spatially controlled, we forced the mitotic spindle of C. briggsae
embryos to reach 70% of cell length earlier in the cell cycle.
To this end, anterior astral microtubules were severed using a
laser microbeam at the end of prometaphase (Fig. 3, A and B;
and
Video 3
). For experiments performed around nuclear
en-velope breakdown (NEBD), microtubule severing had only
a mild effect on spindle displacement. Cuts performed after
NEBD, however, successfully displaced the mitotic spindle
toward the posterior end of the cell. Thus, unbalanced
micro-tubule pulling forces are initiated after NEBD, as previously
described for C. elegans embryos (Labbé et al., 2004; McCarthy
Campbell et al., 2009). After microtubule severing, oscillations
began when the posterior centrosome reached 68.9 ± 1.8% of
the embryo’s length, regardless of the elapsed time (Fig. 3 C).
Oscillation onset, therefore, depends on the position of the
posterior centrosome. In addition, oscillations within laser-cut
C. briggsae
embryos lasted longer and exhibited larger
am-plitudes than wild-type embryos (Fig. 3, D and E). We
con-clude that: (1) force-generator activity is temporally regulated,
(2) a positional switch controls the onset of spindle oscillations,
(3) delayed spindle oscillations observed in C. briggsae are a
consequence of the overcentration phenotype, and (4) the lower
amplitude oscillations that characterize intact C. briggsae
em-bryos are in part caused by the shorter time spent in the
oscil-lating phase. Precise coordination of oscillation onset and the
start of anaphase in C. elegans prevented the identification of
this positional switch.
GPR posterior localization correlates with the positional switch in both species
In C. elegans, the enrichment of GPR/LIN-5 at the posterior
cortex corresponds to 70% of cell length during anaphase
(Fig. 4, A and J; Park and Rose, 2008), which suggests that
these proteins may set the positional switch for oscillation
onset. We asked if C. briggsae embryos showed the same
pat-tern of GPR localization.
First, we confirmed that the G–GPR–LIN-5 complex
is functionally conserved in C. briggsae embryos. After
in-activation of each member of this complex, we found reduced
spindle elongation, no spindle displacement, and no spindle
os-cillations during anaphase, while embryonic polarity was not
affected (Fig. S1, B–E;
Fig. S2 A
; and
Video 4
). We also showed
that the cortical localization of C. briggsae GPR-2 (Cbr-GPR-2)
on January 7, 2014
jcb.rupress.org
oscillations onset (Fig. 4, E and F). We found, however, a
simi-lar amount of total GPR protein in wild-type and Cbr-G(RNAi)
embryos (Fig. S2 F), which suggests that despite its cortical
accumulation, GPR is still a limiting factor to sustain strong
oscillations in Cbr-G(RNAi) embryos. To test this hypothesis,
that earlier oscillation onset allows larger oscillation amplitudes
(Fig. 4, G–I; and
Videos 7 and 8
).
We expected higher oscillation amplitude in Cbr-G(RNAi)
embryos compared with Cbr-let-99(RNAi), because Cbr-G(RNAi)
embryos combine high levels of cortical GPR and premature
Figure 3. Position-dependent onset of spindle oscillation. (A and B) On the left, drawing of a one-cell stage C. briggsae embryo. Nuclei are shown in gray, microtubules in light green, the anterior centrosome in green, and the posterior centrosome in red. The broken line represents the cell center. On the right, the position of the posterior centrosome along the A/P axis (black curve) and the transverse movements of both centrosomes (green and red curves) are shown relative to cytokinesis onset (t = 0 s). One representative embryo is shown, among the 9 intact embryos (A) and 12 embryos in which the anterior astral microtubules have been severed (B) that were analyzed. (C–E) From cut and intact embryos, measures of the position of the posterior centrosome at oscillation onset (C), oscillation duration in seconds (D), and maximum amplitude of posterior centrosome oscillations (E) are shown relative to the time at oscillation onset (in seconds to cytokinesis onset).
on January 7, 2014
jcb.rupress.org
Figure 4. GPR sets the spatial switch for oscillations. (A–F) Plots represent the mean cortical intensity of GPR (from 0 to 1) from n anaphase embryos stained with GPR (red), tubulin (green), and DNA (blue) and normalized to the maximum intensity. Values have been projected onto the A/P axis, from the anterior pole (0%) to the posterior pole (100%). The asterisks represent the edge of the posterior plateau. One representative embryo is shown on the left. Anterior is to the left. Arrows show the edge of the GPR posterior domain. Bars, 10 µm. (G–I) Histograms from analysis of oscillation curves. Ce-gpr-(lf) corresponds to gpr-1(ok2126) or gpr-2(ok1179) mutant embryos. Statistical differences are shown with white, gray, or black stars for com-parison to wild-type C. elegans, wild-type C. briggsae, or Cbr-G(RNAi), respectively (for P < 0.05). Error bars represent standard deviation. The time at posterior centrosome oscillation onset relative to anaphase onset is shown in G, the position of the posterior centrosome at oscillation onset is shown in H, and the maximum amplitude of oscillations is shown in I. (J) Position of the edge of the GPR plateau on the A/P axis was measured from individual graphs of GPR cortical intensities in A–D. Mean values are shown, error bars indicate standard deviation.
on January 7, 2014
jcb.rupress.org
suggests that mechanisms independent on the ternary complex
might, however, be conserved between species to control nuclei
centering (Gusnowski and Srayko, 2011; Kimura and Kimura,
2011). Because the different forces responsible for nuclei
posi-tioning can be phenotypically uncoupled in C. briggsae
em-bryos, their analysis in this satellite species should lead to
important findings.
Interestingly, we noticed a strong enrichment of Cbr-GPR-2
in the anterior side of C. briggsae embryos during prophase,
which persisted throughout the first cell cycle (Figs. 4 B, 5 B,
and S2 A). We quantified the A/P ratio of GPR in both species
during prophase and found a higher asymmetry toward the
an-terior pole for C. briggsae embryos compared with C. elegans
(Fig. 5 B). Although this observation is only a positive
corre-lation, we propose that C. briggsae embryos are characterized
by a lack of G–GPR–LIN-5 inhibition during prophase, which
leads to an accumulation of GPR at the anterior side of the cell
and to NCC overcentration.
Despite the anterior accumulation of Cbr-GPR-2, the
anterior centrosome undergoes very little oscillation during
ana-phase and remains almost static in C. briggsae embryos (Figs. 1 B
and 2 B). We postulated that this anterior GPR pool does not
contribute to strong pulling forces during anaphase. To address
this question, we inactivated Cbr-PAR-2 protein in C. briggsae
embryos. In C. elegans, par-2 mutant embryos show an
“ante-riorization” of the cortex leading to symmetric and weak GPR
we treated the ANA017 line showing an excess of GPR with
Cbr-G(RNAi)
. We found a further increase in oscillation
am-plitude compared with single Cbr-G(RNAi) or ANA017
em-bryos (Fig. 4, G–I). Thus, the increased oscillations found in
Cbr-G(RNAi)
embryos are not caused by an excess of GPR
but rather by premature oscillations and expanded GPR domain,
as found in Cbr-let-99(RNAi) embryos. We confirm, therefore,
that the amplitude of oscillations is dependent on the time spent
in the oscillating phase as well as the level of available GPR.
Overall, we show that the posterior aster starts to oscillate
pre-maturely when GPR is found all over the cortex, which is
con-sistent with a role of GPR in setting the positional switch.
G–GPR–LIN-5–dependent forces are responsible for NCC overcentration in C. briggsae embryos
We finally explored the mechanisms leading to NCC
overcen-tration in C. briggsae embryos. In C. elegans, down-regulation
of GPR or LIN-5 during prophase is needed to prevent NCC
overcentration (Galli et al., 2011; Panbianco et al., 2008). We
found that inactivation of G, GPR, or LIN-5 by RNAi
abol-ished nuclei overcentration in C. briggsae embryos (Fig. 5 A
and Fig. S1 B), which suggests that a constitutive up-regulation
of the G–GPR–LIN-5 complex is responsible for NCC
over-centration in this species. Importantly, down-regulation of all
three proteins restored nuclei centering in C. briggsae, which
Figure 5. An up-regulation of G–GPR–LIN-5 leads to NCC overcentration in C. briggsae embryos. (A) Position of the center of the NCC at the end of its rotation is repre-sented as a percentage of cell length. Error bars indicate standard deviation. Statistical differences are shown with a star for comparison to wild-type C. briggsae (for P < 0.05). (B) C. elegans and C. briggsae embryos during NCC rota-tion stained with antibodies against GPR (in red). Tubulin is in green and DNA in blue. Rectangles show the region where GPR intensity was measured. The anterior pole is to the left. Bar, 10 µm. The histogram shows the mean ratio of GPR levels between anterior and posterior side of the cell for each species. Error bars indicate standard deviation. The star shows statistical difference between species (P < 0.05).
on January 7, 2014
jcb.rupress.org
Materials and methods
Strains
The Bristol N2 C. elegans strain was used as the standard wild type. The JU1018 strain, an RNAi-sensitive derivative of the wild-type Indian AF16 strain, was used as the reference for C. briggsae (Nuez and Félix, 2012). We found that AF16 and JU1018 have undistinguishable phenotypes con-cerning the two first embryonic divisions. The following additional strains were used: C. elegans VC1670 gpr-1(ok2126), C. elegans RB1150 gpr-2
(ok1179) (two loss-of-function alleles, referred to as Ce-gpr-(lf);
Caenorhab-ditis Genetics Center), and C. briggsae RW20000 Cbr-unc-119(st20000) (Zhao et al., 2010). We analyzed other wild isolates of both species that were both geographically and genetically distinct from the reference strains:
C. elegans CB4856 and LKC34, and C. briggsae ED3092 and HK104. C. briggsae and C. elegans strains were handled similarly on nematode
growth medium (NGM) plates, cultured at 20°C and fed on OP50 bacte-ria. Fluorescent lines and Cbr-unc-119 worms were maintained at 25°C. Embryos were recorded at 23°C unless stated otherwise.
Transgenic C. briggsae strains
We amplified the full-length Cbr-gpr-2, Cbr-par-2, and Cbr-par-6 from AF16 genomic DNA. The genes were then cloned at the C terminus of GFP in the TH303 plasmid (a gift from T. Hyman, Max Planck Institute, Dresden, Germany), under the control of the C. elegans pie-1 promoter and 3 UTR. The vector also contains the C. elegans unc-119 gene and promoter. These plasmids were used at 4 µg/µl for coating on gold beads, and beads were then placed on macrocarriers in a hepta-adapter of a Biolistic PDS-1000 HE system (Bio-Rad Laboratories). Cbr-unc-119 worms (Zhao et al., 2010) were plated and bombarded two times at 1,500 psi. We obtained five in-dependent integrated lines for Cbr-GPR-2, one for Cbr-PAR-6, and one for Cbr-PAR-2. All lines were then backcrossed to the JU1018 strain to obtain worms sensitive to RNAi by ingestion. All lines displayed wild-type pheno-types except one Cbr-GFP::GPR-2 line that exhibited the strongest cortical GFP signal. Embryos from this line ANA017 displayed rocking of the NCC during overcentration and stronger spindle oscillations.
Gene inactivation by RNAi
RNAi experiments were performed by ingestion of transformed HT115 bacteria in both species. Cbr-gpb-1 (G), Cbr-gpr-2, Cbr-lin-5, Cbr-goa-1,
Cbr-gpa-16, Cbr-par-2, and Cbr-let-99 genes were amplified from AF16
genomic DNA and cloned into the L4440 plasmid. 48–64 h of feeding at 20°C was needed to obtain the strongest phenotypes in C. briggsae JU1018 embryos. Cbr-G(RNAi) corresponds to a double inactivation of
Cbr-gpa-16 and Cbr-goa-1 genes. After inactivation of let-99 or G by RNAi
in C. elegans, the uninterrupted rocking of NCC and spindle prevented us from determining the onset of mitotic oscillations. However, NCC and mitotic spindle oscillations were clearly distinguishable after RNAi treat-ment of these genes in C. briggsae embryos, allowing us to measure anaphase oscillation onset. cid-1 and C27D9.1 genes were reported to affect embryo size in C. elegans embryos (from http://www.worm .mpi-cbg.de/phenobank/cgi-bin/MenuPage.py). After inactivation of cid-1, we obtained minute embryos, whereas inactivation of C27D9.1 gave very long embryos. In both cases, embryos were viable and showed no other visible phenotypes.
Recording, tracking, and statistics
Embryos were mounted in M9 onto a 2% agarose pad between a slide and a coverslip and observed on a microscope (Axio Imager A2; Carl Zeiss) equipped with a 100× Plan-Apochromat NA 1.4 lens. We took two images per second from pronuclear appearance to the second cell division using a digital camera (DX4-285FW; Kappa) and the corresponding time-lapse module. We defined t = 0 s as the separation of chromosomes at anaphase onset, which is detectable on DIC recordings. All embryos were recorded at 23°C. We found that cell cycle duration was similar between species at this temperature (Table S1). To track nuclei and centrosome position over time, we used the “Manual Tracking” plugin from ImageJ (National Institutes of Health). During mitosis, cortical contractions are reduced and embryo length is constant. This allowed us to set the anterior side of the cell as the spatial reference point. Positions were expressed in percentage of embryo length, with 0% representing the anterior pole and 100% repre-senting the posterior pole. Graphs of centrosome position on the A/P axis and transverse axis as a function of time were analyzed with MATLAB soft-ware (MathWorks). In a first stage, low-frequency trends of the transverse centrosome displacements were corrected by a third-order fitting with a poly-nomial. In a second stage, a low-pass filter was applied to correct the signal
cortical recruitment and consequently reduced anaphase
pull-ing forces (Grill et al., 2001). In Cbr-par-2(RNAi) embryos, we
found symmetric cell division, reduced spindle elongation, and
an absence of oscillations, which strongly suggests a reduction
of cortical pulling forces (Fig. S1, B–E). However, we found a
uniform and strong signal of Cbr-GPR-2 in Cbr-par-2(RNAi)
embryos at all stages (Fig. S2 D). These results suggest that
the anterior pool of Cbr-GPR-2 has a different activity between
prophase and anaphase in C. briggsae embryos. Cbr-GPR-2
and Ce-GPR-1/2 proteins display only 76% of sequence
simi-larity. Therefore, changes in the protein sequence itself might
be responsible for the differences in localization and
acti-vation found between species. Identifying these evolutionary
changes will be of great interest to decipher the mechanisms of
GPR regulation.
Cryptic changes in spindle trajectories behind a conserved positional switch
Our comparative analysis allowed us to uncover a conserved
positional switch for spindle oscillation onset. We propose that
in both C. elegans and C. briggsae embryos, the GPR posterior
localization sets this positional switch, while the level of GPR
within the posterior domain controls the amplitude of transverse
oscillations. We also revealed two main evolutionary changes:
(1) a differential regulation of GPR during prophase leading
to NCC overcentration and consequently to shorter time in the
oscillation phase for C. briggsae embryos, and (2) a different
availability of GPR during anaphase. The diminished transverse
oscillations that characterize C. briggsae embryos result from
a combination of these two differences. With this study, we
show that the first cell division of nematode embryos is
associ-ated with cryptic changes that can serve to explore essential
cel-lular functions.
How does the positional switch function? It has been
previously proposed that spindle oscillations are caused by a
gradual increase in processivity of force generators over time
(Pecreaux et al., 2006). Our results suggest that although force
generators are activated, they are engaged only when the aster
is close enough to the domain of force generators, which
con-tain GPR. We reasoned that when asters are far from the GPR
domain, few microtubules are long enough to be captured by
motors at a given time point. This would lead to aster
displace-ment but be insufficient to trigger oscillations. As the aster gets
closer to that domain, enough microtubules may reach the
cor-tex before switching to catastrophe and more motors become
progressively engaged.
Although spindle oscillations are instrumental to unravel
the mechanisms of microtubule-based forces, they have no
in-herent function. Why are mechanisms controlling spindle
oscil-lation onset maintained across nematode evolution? A sudden
increase in pulling forces may help to rapidly propel the
poste-rior centrosome (and the entire spindle) toward a most posteposte-rior
position or alternatively to oppose a breaking transversal force
to posterior spindle displacement. In any cases, the positional
switch could ensure final spindle position and thus asymmetric
cell division regardless of initial spindle position and remaining
time to cytokinesis.
on January 7, 2014
jcb.rupress.org
Western blots
Cbr-GFP::GPR-2 lines were synchronized and L3 larvae were then fed for 48 h on NGM plates seeded with bacteria expressing Cbr-G double-stranded RNA (dsRNA), a control RNAi (C. elegans unc-22), or control NGM plates. From these worms, embryonic extracts were prepared and loaded onto SDS-PAGE gels. A mouse anti-tubulin antibody (DM1a; Sigma-Aldrich) was used at 1:2,000 as a loading control. A mouse monoclonal anti-GFP antibody (Roche) was used at 1:1,000 as a readout of GPR over-all levels. Primary antibodies were stained overnight at 4°C. Anti–mouse secondary antibodies were used at 1:5,000 (NA931; GE) for 40 min at room temperature.
Online supplemental material
Fig. S1 shows that G–GPR–LIN-5–dependent unbalanced pulling forces control the first cell division of C. briggsae embryos. Fig. S2 shows Cbr-GPR-2 localization and levels in C. briggsae wild-type and RNAi-treated embryos. Video 1 shows a time-lapse DIC recording of a wild-type C.
ele-gans N2 embryo. Video 2 shows a time-lapse DIC recording of a wild-type C. briggsae JU1018 embryo. Video 3 shows a time-lapse DIC recording
of a wild-type C. briggsae JU1018 embryo after laser severing of anterior astral microtubules using a pulsed N2 laser from a Leica LMD microscope ( = 337 nm). Video 4 shows a time-lapse DIC recording of a C. briggsae embryo treated with Cbr-gpr-2(RNAi). Video 5 shows a time-lapse DIC recording of a C. briggsae embryo from the ANA017 line, in which Cbr-GPR-2 is found in excess. Video 6 shows a time-lapse DIC recording of a
C. briggsae embryo treated with Cbr-G(RNAi). Video 7 shows a time-lapse
DIC recording of a C. briggsae embryo treated with Cbr-let-99(RNAi). Table S1 shows quantification of events in C. elegans and C. briggsae strains. Online supplemental material is available at http://www.jcb.org/ cgi/content/full/jcb.201210110/DC1.
This work has been initiated in the laboratory of M.-A. Félix. We are very grateful to her for help and fruitful discussions. We thank P. Gönczy, M.-A. Félix, and anonymous reviewers for critical reading of the manuscript. We thank A. Khalil and D. Cluet for help with image processing, N. Bozonnet for techni-cal help, and the Plateau Technique Imagerie/Microscopie (PLATIM) imaging facility of the Unité Mixte de Service Biosciences (Lyon, France). We thank the Gönczy laboratory for sharing its laser-equipped microscope. Some nematode strains used in this work were provided by the Caenorhabditis Genetics Center, which is funded by the National Institutes of Health National Center for Research Resources (NCRR).
This project has been funded by grants from the Centre National de la Recherche Scientifique (ATIP) and the ARC foundation to M. Delattre. S. Riche is supported by a PhD fellowship from the Region Rhône-Alpes.
Submitted: 22 October 2012 Accepted: 11 April 2013
References
Brauchle, M., K. Kiontke, P. MacMenamin, D.H. Fitch, and F. Piano. 2009. Evolution of early embryogenesis in rhabditid nematodes. Dev. Biol. 335: 253–262. http://dx.doi.org/10.1016/j.ydbio.2009.07.033
Colombo, K., S.W. Grill, R.J. Kimple, F.S. Willard, D.P. Siderovski, and P. Gönczy. 2003. Translation of polarity cues into asymmetric spindle posi-tioning in Caenorhabditis elegans embryos. Science. 300:1957–1961. http://dx.doi.org/10.1126/science.1084146
Dolgin, E.S., M.A. Félix, and A.D. Cutter. 2008. Hakuna Nematoda: genetic and phenotypic diversity in African isolates of Caenorhabditis elegans and C.
briggsae. Heredity (Edinb). 100:304–315. http://dx.doi.org/10.1038/sj .hdy.6801079
Galli, M., J. Muñoz, V. Portegijs, M. Boxem, S.W. Grill, A.J. Heck, and S. van den Heuvel. 2011. aPKC phosphorylates NuMA-related LIN-5 to posi-tion the mitotic spindle during asymmetric division. Nat. Cell Biol. 13: 1132–1138. http://dx.doi.org/10.1038/ncb2315
Gönczy, P. 2008. Mechanisms of asymmetric cell division: flies and worms pave the way. Nat. Rev. Mol. Cell Biol. 9:355–366. http://dx.doi.org/10 .1038/nrm2388
Gotta, M., Y. Dong, Y.K. Peterson, S.M. Lanier, and J. Ahringer. 2003. Asymmetrically distributed C. elegans homologs of AGS3/PINS control spindle position in the early embryo. Curr. Biol. 13:1029–1037. http:// dx.doi.org/10.1016/S0960-9822(03)00371-3
Goulding, M.B., J.C. Canman, E.N. Senning, A.H. Marcus, and B. Bowerman. 2007. Control of nuclear centration in the C. elegans zygote by receptor-independent G signaling and myosin II. J. Cell Biol. 178:1177–1191. http://dx.doi.org/10.1083/jcb.200703159
for high-frequency noise. The intersections of the oscillation signal (beyond a predefined time) with the horizontal axis (corresponding to zero trans-verse displacement) were first detected by a dichotomic algorithm, and then the local extrema for each oscillation were detected in between the succes-sive pairs of intersection points. From these extrema positions, we com-puted amplitudes and the period of each half-oscillation. The onset and end of oscillations were detected manually from those graphs.
For all measurements, statistical significance was measured using a two-tailed Student’s t test.
Astral microtubule severing experiments
Embryos were visualized by DIC using a laser microdissection microscope (LMD; Leica) equipped with a pulsed N2 laser ( = 337 nm). After comple-tion of nuclei/centrosome rotacomple-tion, a curve was drawn around the centro-some to cut astral microtubules (as depicted in Fig. 4 A). Because astral microtubules grow extremely quickly (Srayko et al., 2005), we expected that the microtubule network and spindle behavior would be restored a few seconds after the cut. For these experiments, the onset of cytokinesis, assessed by the onset of furrowing, was taken as the reference time point because we could not detect anaphase onset on the laser-equipped micro-scope. To make sure that heat from the laser did not perturb the embryos, we measured the time from NEBD to the onset of cytokinesis. In wild-type embryos, this interval was 203.4 ± 31.7 s, which was not statistically different from the cut embryos (217.9 ± 34.8 s, P = 0.37).
Antibody production and stainings
Cbr-GPR-2 shares only 76% similarity with the nearly identical Cel-GPR-1/2 proteins. This prevented us from detecting Cbr-GPR-2 using antibodies directed against C. elegans GPR-1/2 (gifts from P. Gönczy, École Polytech-nique Fédérale de Lausanne, Lausanne, Switzerland; and L. Rose, University of California, Davis, Davis, CA; Colombo et al., 2003; Park and Rose, 2008). We raised a polyclonal antibody against two conserved peptides of GPR-1/2 and Cbr-GPR-2. Eurogentec performed peptide production and rabbit immunization. One rabbit serum yielded a strong GPR signal on fixed C. briggsae embryos (1:50) but not on C. elegans fixed em-bryos, nor on a Western blot. Gravid hermaphrodites were placed on polylysine-coated slides and cut open. A coverslip was then placed on the released embryos and excess liquid was removed to flatten the eggs. Slides were placed on frozen aluminum blocks. Once frozen, the coverslip was cracked and slides were plunged in 20°C methanol for at least 5 min. Slides were then rinsed in PBS and stained at room temperature for 45 min for each primary and secondary antibody. The following pri-mary antibodies were used: rabbit anti–Cel-GPR-1 (1:50; Park and Rose, 2008), rabbit anti-GFP (1:500; A6455; Invitrogen), and mouse anti-tubulin (1:100; DM1a; Sigma-Aldrich). Secondary antibodies were a donkey Dylight488 anti–mouse (Jackson ImmunoResearch Laboratories, Inc.), and a donkey Cy3 anti–rabbit (1:2,000; Jackson ImmunoResearch Labo-ratories, Inc.). DNA was revealed with Hoechst 33342 (Sigma-Aldrich). Stained embryos were imaged using a spectral confocal microscope (SP5; Leica) or a spectral confocal microscope (LSM710; Zeiss), and images were processed with ImageJ. Single confocal planes are shown on the figures. Quantification of GPR levels
For staining on C. briggsae embryos, we used either the anti–Cbr-GPR-2 an-tibody on wild-type embryos, or anti-GFP antibodies on transgenic lines expressing GFP::Cbr-GPR-2. Except in Fig. 4 D, we used a Cbr-GFP::GPR-2 line displaying wild-type phenotypes to assess GPR levels. C. briggsae embryos stained with the antibody against Cbr-GPR-2 are shown on Fig. S2 A. GFP signals from the Cbr-GFP-GPR-2 transgenic line are shown on Fig. 4 (B, C, E, and F), Fig. 5 B, and Fig. S2 (B–D). GPR quantification was performed from mid-plane single confocal images. Only late meta-phase and anameta-phase one-cell embryos were processed for Fig. 4, as the GPR domain is expanding in telophase embryos. First, a 5-pixel line was drawn on the embryo cortex using ImageJ, and pixel intensity was mea-sured using the “Plot profile” function. Using MATLAB, we detected the embryo contour from these images and computed its barycentric coordi-nates, and the symmetric long axis and the transverse axis of the embryo were plotted. This reference frame was used to convert the two-dimensional coordinates of the GPR contour data into cell-length percentages. For each embryo, the half top or bottom cortices were treated separately, as they often displayed different profiles. The number of embryos processed is shown on Fig. 4, corresponding to several cortices varying between n and 2n. To measure the A/P ratio of GPR levels in prophase embryos, we quantified pixel intensity in a large cytoplasmic region in both species, as depicted in Fig. 5 B.
on January 7, 2014
jcb.rupress.org
Grill, S.W., P. Gönczy, E.H. Stelzer, and A.A. Hyman. 2001. Polarity con-trols forces governing asymmetric spindle positioning in the
Caenorhab-ditis elegans embryo. Nature. 409:630–633. http://dx.doi.org/10.1038/ 35054572
Gusnowski, E.M., and M. Srayko. 2011. Visualization of dynein-dependent microtubule gliding at the cell cortex: implications for spindle positioning.
J. Cell Biol. 194:377–386. http://dx.doi.org/10.1083/jcb.201103128 Kimura, K., and A. Kimura. 2011. A novel mechanism of microtubule length-
dependent force to pull centrosomes toward the cell center. Bioarchitecture. 1:74–79. http://dx.doi.org/10.4161/bioa.1.2.15549
Kimura, A., and S. Onami. 2005. Computer simulations and image processing reveal length-dependent pulling force as the primary mechanism for
C. elegans male pronuclear migration. Dev. Cell. 8:765–775. http://dx.doi .org/10.1016/j.devcel.2005.03.007
Labbé, J.C., E.K. McCarthy, and B. Goldstein. 2004. The forces that posi-tion a mitotic spindle asymmetrically are tethered until after the time of spindle assembly. J. Cell Biol. 167:245–256. http://dx.doi.org/10.1083/jcb .200406008
McCarthy Campbell, E.K., A.D. Werts, and B. Goldstein. 2009. A cell cycle timer for asymmetric spindle positioning. PLoS Biol. 7:e1000088. http:// dx.doi.org/10.1371/journal.pbio.1000088
Nuez, I., and M.A. Félix. 2012. Evolution of susceptibility to ingested double-stranded RNAs in Caenorhabditis nematodes. PLoS ONE. 7:e29811. http://dx.doi.org/10.1371/journal.pone.0029811
Panbianco, C., D. Weinkove, E. Zanin, D. Jones, N. Divecha, M. Gotta, and J. Ahringer. 2008. A casein kinase 1 and PAR proteins regulate asymmetry of a PIP(2) synthesis enzyme for asymmetric spindle positioning. Dev.
Cell. 15:198–208. http://dx.doi.org/10.1016/j.devcel.2008.06.002
Park, D.H., and L.S. Rose. 2008. Dynamic localization of LIN-5 and GPR-1/2 to cortical force generation domains during spindle positioning. Dev. Biol. 315:42–54. http://dx.doi.org/10.1016/j.ydbio.2007.11.037
Pecreaux, J., J.C. Röper, K. Kruse, F. Jülicher, A.A. Hyman, S.W. Grill, and J. Howard. 2006. Spindle oscillations during asymmetric cell division re-quire a threshold number of active cortical force generators. Curr. Biol. 16:2111–2122. http://dx.doi.org/10.1016/j.cub.2006.09.030
Redemann, S., S. Schloissnig, S. Ernst, A. Pozniakowsky, S. Ayloo, A.A. Hyman, and H. Bringmann. 2011. Codon adaptation-based control of protein expression in C. elegans. Nat. Methods. 8:250–252. http://dx.doi .org/10.1038/nmeth.1565
Srayko, M., A. Kaya, J. Stamford, and A.A. Hyman. 2005. Identification and characterization of factors required for microtubule growth and nucle-ation in the early C. elegans embryo. Dev. Cell. 9:223–236. http://dx.doi .org/10.1016/j.devcel.2005.07.003
Thyagarajan, K., K. Afshar, and P. Gönczy. 2011. Polarity mediates asymmet-ric trafficking of the Gbeta heterotrimeasymmet-ric G-protein subunit GPB-1 in
C. elegans embryos. Development. 138:2773–2782. http://dx.doi.org/10 .1242/dev.063354
Tsou, M.F., A. Hayashi, and L.S. Rose. 2003. LET-99 opposes Galpha/GPR sig-naling to generate asymmetry for spindle positioning in response to PAR and MES-1/SRC-1 signaling. Development. 130:5717–5730. http://dx.doi .org/10.1242/dev.00790
Werts, A.D., M. Roh-Johnson, and B. Goldstein. 2011. Dynamic localization of
C. elegans TPR-GoLoco proteins mediates mitotic spindle orientation by extrinsic signaling. Development. 138:4411–4422. http://dx.doi.org/10 .1242/dev.070979
Zhao, Z., S. Flibotte, J.I. Murray, D. Blick, T.J. Boyle, B. Gupta, D.G. Moerman, and R.H. Waterston. 2010. New tools for investigating the comparative biology of Caenorhabditis briggsae and C. elegans. Genetics. 184:853– 863. http://dx.doi.org/10.1534/genetics.109.110270
on January 7, 2014
jcb.rupress.org
T
H
E
J
O
U
R
N
A
L
O
F
C
E
L
L
B
IO
L
O
G
Y
Riche et al., http://www.jcb.org/cgi/content/full/jcb.201210110/DC1
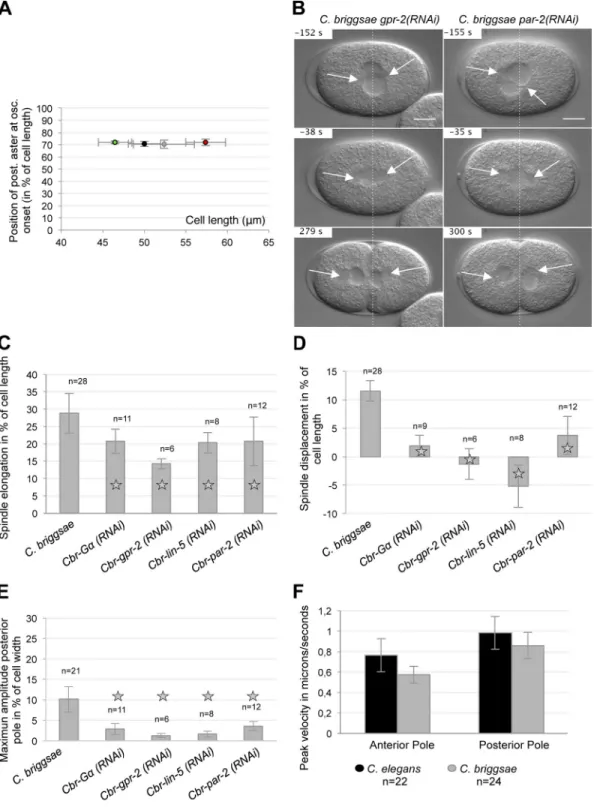
Figure S1. G–GPR–LIN-5–dependent unbalanced pulling forces control the first cell division of C. briggsae embryos. (A) Position of the posterior centro-some (at oscillation onset) is shown relative to absolute embryo length in microns for wild-type C. elegans (n = 33) in black, wild-type C. briggsae (n = 28) in gray, short C. elegans embryos in green (after inactivation of the cid-1 gene; n = 10), and long C. elegans embryos in red (after inactivation of the
C27D9.1 gene; n = 7). Regardless of embryo size, the centrosome starts to oscillate around 70% of embryo length. Error bars indicate standard deviation.
(B) Snapshots from DIC recordings of Cbr-gpr-2(RNAi) and Cbr-par-2(RNAi) embryos. Time is shown relative to anaphase onset (t = 0 s). Anterior is to the left. Broken lines are positioned at 50% of embryo length. Arrows show the asters. Bars, 10 µm. (C–E) Measurements of spindle motion for n embryos of wild-type C. briggsae, Cbr-G(RNAi), Cbr-gpr-2(RNAi), Cbr-lin-5(RNAi), and Cbr-par-2(RNAi). Error bars indicate standard deviation. Statistical differ-ences are shown with a star for comparison to wild-type C. briggsae (P < 0.05). (C) Initial spindle length (at metaphase onset) is subtracted from final spin-dle length (at cytokinesis onset), and is represented in percentage of cell length. (D) Initial position of the center of the spinspin-dle (at metaphase onset) is subtracted from position of the center of the spindle at cytokinesis onset. The distance is shown in percentage of cell length. Negative values correspond to an anterior shift of the spindle during anaphase. (E) Maximum amplitude of transverse oscillation of the posterior centrosome is measured in percentage of
of polarity proteins. (B–E) On all panels, microtubules are shown in green, DNA in blue, and GPR in red. The anterior pole is to the left. (B) C. briggsae wild-type embryos stained with an antibody against Cbr-GPR-2 at different stages. (C) Cbr-gpr-2(RNAi) telophase embryo stained with an antibody against Cbr-GPR-2 showing the specificity of the antibody for cortical and cytoplasmic signals. (D–F) Embryos expressing Cbr-GPR-2 fused to GFP were used, from transgenic lines showing no signs of GPR overexpression. (D) Embryos were subjected to Cbr-G(RNAi) and stained using an antibody against GFP. The cortical signal of GPR is strongly decreased. (E) Embryos were subjected to Cbr-par-2(RNAi) and stained using an antibody against GFP. GPR is found uni-formly around the cortex and in the cytoplasm. (F) Embryos were treated with RNAi against Cbr-G or the C. elegans unc-22 gene as a negative control. Embryos were then prepared for protein extraction. The Western blot reveals GFP levels as a readout of GPR quantity in treated and untreated embryos. Tubulin was used as a loading control. Bars, 10 µm.
Video 2. Time-lapse DIC recording of a wild-type C. briggsae JU1018 embryo. Images were acquired using a microscope (Axio Imager A2; Carl Zeiss). Frames were captured every 0.5 s.
Video 3. Time-lapse DIC recording of a wild-type C. briggsae JU1018 embryo after laser severing of anterior astral microtu-bules using a pulsed N2 laser from a Leica LMD microscope ( = 337 nm). Frames were captured every 0.5 s.
Video 4. Time-lapse DIC recording of a C. briggsae embryo treated with Cbr-gpr-2(RNAi). Images were acquired using a microscope (Axio Imager A2; Carl Zeiss). Frames were captured every 0.5 s.
Video 5. Time-lapse DIC recording of a C. briggsae embryo from the ANA017 line, in which Cbr-GPR-2 is found in excess. Images were acquired using a microscope (Axio Imager A2; Carl Zeiss). Frames were captured every 0.5 s.
Video 6. Time-lapse DIC recording of a C. briggsae embryo treated with Cbr-G(RNAi). Images were acquired using a micro-scope (Axio Imager A2; Carl Zeiss). Frames were captured every 0.5 s.
Video 7. Time-lapse DIC recording of a C. briggsae embryo treated with Cbr-let-99(RNAi). Images were acquired using a microscope (Axio Imager A2; Carl Zeiss). Frames were captured every 0.5 s.
N2 CB4856 LKC34 JU1018 HK104 ED3092 JU1018 at 28°C Embryo length (µm) 50.00 ± 1.95 (n = 33) 50.73 ± 2.01 (n = 23)a 50.92 ± 2.59 (n = 17) 52.37 ± 3.67 (n = 28) 52.56 ± 2.05 (n = 25)b 51.00 ± 2.31 (n = 18) ND Embryo width (µm) 33.70 ± 1.46 (n = 33) 34.59 ± 1.47 (n = 23) 34.15 ± 1.50 (n = 17) 34.21 ± 1.92 (n = 28) 31.62 ± 1.70 (n = 25)b 31.14 ± 1.46 (n = 18)b ND Spindle length at metaphase onset (%) 26.48 ± 2.80 (n = 19)a ND ND 24.48 ± 1.56 (n = 16)b ND ND ND Spindle center at metaphase onset (%) 51.45 ± 1.66 (n = 19)a 50.54 ± 3.56 (n = 10) 49.91 ± 0.87 (n = 6) 46.59 ± 1.56 (n = 16)b 43.98 ± 2.31 (n = 7) 46.00 ± 2.69 (n = 6) ND Spindle length at anaphase onset (%) 29.72 ± 2.33 (n = 19) ND ND 28.30 ± 2.06 (n = 16) ND ND ND Spindle center at anaphase onset (%) 56.02 ± 1.83 (n = 19)a 55.57 ± 3.72 (n = 12) 53.30 ± 1.07 (n = 5) 48.72 ± 1.59 (n = 16)b 47.92 ± 1.20 (n = 8) 50.95 ± 2.37 (n = 6) ND Posterior aster position at anaphase onset (%) 70.85 ± 1.64 (n = 33)a 70.09 ± 2.91 (n = 23)a 69.84 ± 1.91 (n = 15)a 62.89 ± 2.21 (n = 28)b 62.65 ± 1.33 (n = 17)b 66.90 ± 2.49 (n = 18)b ND Posterior aster position at oscillation onset (%) 70.69 ± 2.14 (n = 33) 69.51 ± 3.30 (n = 23) 70.86 ± 2.46 (n = 16) 69.88 ± 3.00 (n = 26) 69.35 ± 2.60 (n = 17) 71.55 ± 3.32 (n = 18) 71.58 ± 2.92 (n = 8) Time at oscillation onset (s) 0.65 ± 8.58 (n = 33)a 4.59 ± 13.87 (n = 23)a 0.44 ± 15.55 (n = 16)a 31.34 ± 12.47 (n = 26)b 25.15 ± 11.55 (n = 17)b 14.17 ± 14.62 (n = 18)b 16.62 ± 15.09 (n = 8)b Posterior aster at cytokinesis onset (%) 80.15 ± 1.34 (n = 15) 80.41 ± 2.30 (n = 12) 79.72 ± 1.06 (n = 10)a 79.18 ± 1.83 (n = 13) 78.72 ± 0.97 (n = 10)b 81.20 ± 1.56 (n = 11) ND Anterior aster at cytokinesis onset (%) 34.06 ± 1.46 (n = 33) 31.83 ± 2.11 (n = 12) 32.19 ± 1.32 (n = 10) 31.03 ± 1.19 (n = 28) 31.11 ± 1.49 (n = 10)b 29.20 ± 1.62 (n = 11)b ND Mean amplitude of posterior aster oscillation (%) 15.06 ± 3.61 (n = 17)a 14.56 ± 2.56 (n = 17)a 16.13 ± 2.69 (n = 9)a 7.53 ± 2.37 (n = 21)b 6.65 ± 2.00 (n = 8)b 9.45 ± 2.65 (n = 11)b 10.1 ± 4.83 (n = 6)b Maximum amplitude of posterior oscillation (%) 18.99 ± 3.87 (n = 17)a 18.60 ± 2.96 (n = 17)a 21.22 ± 2.98 (n = 9)a 10.14 ± 3.10 (n = 21)b 9.20 ± 2.69 (n = 8)b 13.14 ± 3.84 (n = 11)b 12.7 ± 4.95 (n = 6)b Mean frequency of posterior oscillation (mHz) 47.7 ± 12.4 (n = 17) 49.6 ± 9.2 (n = 17) 39.8 ± 4.0 (n = 9)a 46.3 ± 5.6 (n = 21) 45.9 ± 11.2 (n = 8) 52.3 ± 9.5 (n = 11) 62.4 ± 6.6 (n = 6)b Maximum amplitude of anterior oscillation (%) 11.21 ± 3.2 (n = 33)a ND ND 5.36 ± 1.4 (n = 25)b ND ND ND NEBD to cytokinesis (s) 282.6 ± 29.57 (n = 11) ND ND 277.2 ± 45.48 (n = 9) ND ND ND
Three C. elegans and three C. briggsae wild-type strains recorded at 23°C are shown, as well as C. briggsae JU1018 animals raised and recorded at 28°C. Values represent means ± SD. NEBD, nuclear envelope break down. n = the number of embryos per condition. Two-tailed Student’s t test was used.
aStatistical differences (P < 0.05) for comparison with C. briggsae JU1018. bStatistical differences (P < 0.05) for comparison with the C. elegans N2 strain.