CREEP OF OLIVINE DURING HOT-PRESSING
by
Mary Bernadette Schwenn B.S., University of Utah
1972
M.S., San Diego State University 1974
SUBMITTED IN PARTIAL FULFILLMENT OF THE1 REQUIREMENTS FOR THE
DEGREE OF MASTER OF SCIENCE at the MASSACHUSETTS INSTITUTE OF TECHNOLOGY September, 1976 Signature of Author...
Department of Earth and Planetary Sciences September, 1976
Certified by... .. .... . . Thes: Super iso"'r
Accepted by..
ABSTRACT
THE CREEP OF OLIVINE DURING HOT-PRESSING
by
Mary Bernadette Schwenn
Submitted to the Department of Earth and Planetary Sciences on September 30, 1976 in partial fulfillment of the require-ments for the degree of Master of Science.
Olivine powders of grain sizes ranging from 1 to 2000 ym were hot-pressed at temperatures between 10000C and 16500C and at differential stresses between 100 and 400 bars.
In our hot-pressed specimens, all grains, both coarse and fine, deformed plastically. In addition, the coarse grains fractured; the fine grains did not. The coarse-grained speci-mens contained a large proportion of fines; the densification of the coarse-grained powders was aided by the densification of these fine-grain-sized particles.
An average stress exponent, n, of 1.5±0.4 was obtained
from differential tests on the fine-grained aggregates (G<25 pim); while an average n of 3.4±0.8 was found for the
medium-grain-sized aggregates tested (25-250 -n). The activation energy obtained for all the hot-presses powders was 85±29 kcal/mole.
In addition, the strain rate for the fine-grained aggregates varied approximately as the third power of the grain size. However, the grain size dependence of the strain rate for
medium- to coarse-grained aggregates was masked by the presence of fines in these aggregates.
There was an indication in our hot-pressing data that the effect of oxygen fugacity on strain rate was unimportant. How-ever, hydrogen fugacity appeared to 'soften' olivine.
Uncertainities in the formulation of hot-pressing models limits the accuracy with which hot-pressing data can be used to predict uniaxial creep behavior of the corresponding dense aggregate. Creep data predicted in this way results in an expansion of the Coble field in the Stocker and Ashby (1973) map and a corresponding contraction in the power-law creep field as compared with the previous estimates.
Thesis Supervisor: C. Goetze
ii ABSTRACT
THE CREEP OF OLIVINE DURING HOT-PRESSING by
Mary Bernadette Schwenn
Submitted to the Department of Earth and Planetary Sciences on September 30, 1976 in partial fulfillment of the require-ments for the degree of Master of Science.
Olivine powders of grain sizes ranging from 1 to 2000 m were hot-pressed at temperatures between 1000*C and 1650*C and at differential stresses between 100 and 400 bars.
In our hot-pressed specimens, all grains, both coarse and fine, deformed plastically. In addition, the coarse grains
fractured; the fine grains did not. The coarse-grained specimens contained a large proportion of fines; the densification of the coarse-grained powders was aided by the densification of these
fine-grain--sized particles.
An average stress exponent, n, of 1.5±0.4 was obtained from differential tests on the fine-grained aggregates (G<25pm); while an average n of 3.4±0.8 was found for the medium-grain-sized aggregates tested (25-250 pm). The activation energy obtained for all the hot-pressed powders was 85±29 kcal/mole. In addition, the strain rate for the fine-grained aggregates varied approximately as the third power of the grain size. How-ever, the grain size dependence of the strain rate for medium-to coarse-grained aggregates was masked by the presence of fines in these aggregates.
There was an indication in our hot-pressing data that the effect of oxygen fugacity on strain rate was unimportant. How-ever, hydrogen fugacity appeared to 'soften' olivine.
Uncertainties in the formulation of hot-pressing models limits the accuracy with which hot-pressing data can be used to predict uniaxial creep behavior of the corresponding dense aggre-gate. Creep data predicted in this way results in an expansion of the Coble field in the Stocker and Ashby (1973) map and a corresponding contraction in the power-law creep field as com-pared with the previous estimates.
Thesis Supervisor: C. Goetze
111
ACKNOWLEDGEMENTS
I wish to thank C. Goetze for his help in preparing this work. I would also like to thank S. Parker for the unhesitating way in which she gave her time and effort to help me type this
iv TABLE OF CONTENTS ABSTRACT... ACKNOWLEDGEMENTS TABLE OF CONTENTS LIST OF FIGURES.. LIST OF TABLES ... INTRODUCTION... 1 Introduction... 2 Hot-Pressing...
II. EXPERIMENTAL TECHNIQUES ... 2.1 The Experiments ... 2.2 Sample Preparation ...
The starting material... Powder preparation... 2.3 The Apparatus... 2.4 Experimental Procedures ... III. RESULTS...
3.1 The Hot-Pressed Specimens... 3.2 Densification Curves... 3.3 The Effect of Temperature on 3.4 The Effect of Stress on the 3.5 The Effect of Grain Size on 3.6 The Effect
on Creep
the Strain Rate Strain Rate... the Strain Rate...
3 3 3 3 5 5 11 14 14 18 24 29 31 of Atmosphere and Oxygen Fugacity.... Rate Page * ii . iv . Vi .viii Chapter I. 1. 1. ... .. . . . . . ... 0 0 0 0 ... 0 ... 0 . . . .
Chapter
IV. DISCUSSION... 4.1 Adaptation of Theories of High-Temperature
Creep to Hot-Pressing... Derivation of hot-pressing rate equations
from the high-temperature creep equations ....
Theory of pore closure during hot-pressing... The effective stress during hot-pressing...
Comparison of the predicted densification rates using the effective stress models with the experimentally determined
den-sification rates... 4.2 The Transition to Grain-size Insensitive
Creep... 4.3 The Effect of Hydrogen Fugacity...
V. CONCLUSIONS...*...
APPENDIX A, AN ESTIMATE OF THE SURFACE ENERGY AND THE
DRIVING FORCE DUE TO SURFACE ENERGY... A.1 An Estimate of the Surface Energy of Olivine. A.2 The Driving Force Due to Surface Energy... APPENDIX B DATA TABLES... REFERENCES... ADDITIONAL REFERENCES... Page 35 35 36 38 40 44 45 48 50
lt vi
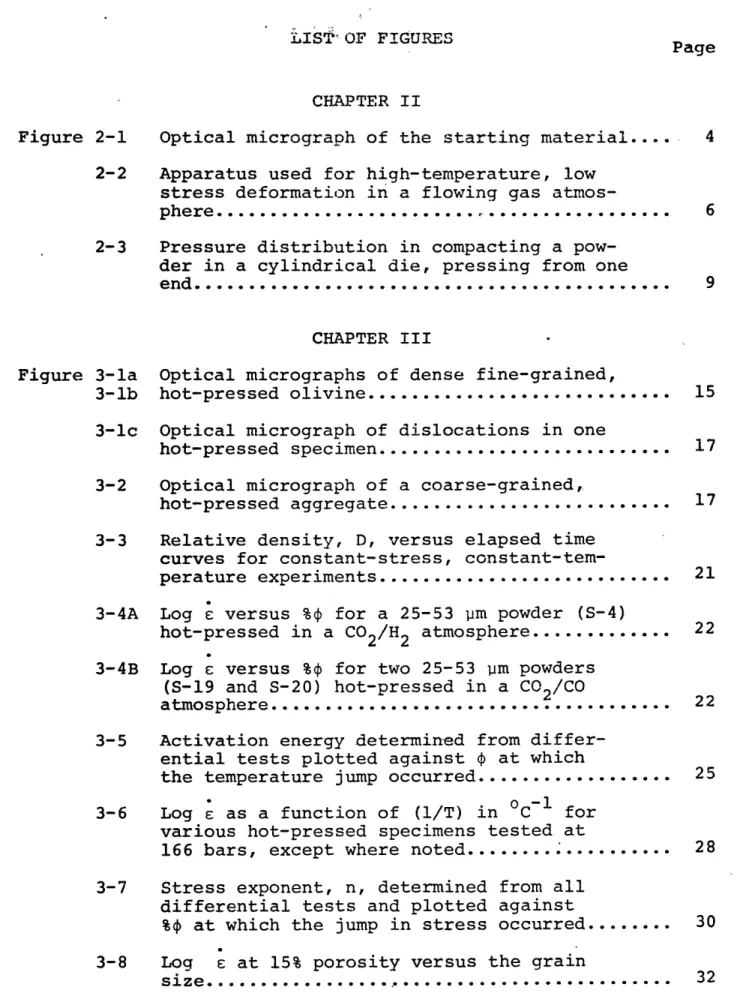
LIS[ OF FIGURES
Page
CHAPTER II
Figure 2-1 Optical micrograph of the starting material.... 4 2-2 Apparatus used for high-temperature, low
stress deformation in a flowing gas
atmos-phere... 6 2-3 Pressure distribution in compacting a
pow-der in a cylindrical die, pressing from one
end... 9
CHAPTER III
Figure 3-la Optical micrographs of dense fine-grained,
3-lb hot-pressed olivine... 15 3-lc Optical micrograph of dislocations in one
hot-pressed specimen... 17 3-2 Optical micrograph of a coarse-grained,
hot-pressed aggregate... 17 3-3 Relative density, D, versus elapsed time
curves for constant-stress,
constant-tem-perature experiments... 21 3-4A Log s versus %$ for a 25-53 pm powder (S-4)
hot-pressed in a CO2/H2 atmosphere... 22 3-4B Log s versus %# for two 25-53 ym powders
(S-19 and S-20) hot-pressed in a CO2/CO
atmosphere... 22 3-5 Activation energy determined from
differ-ential tests plotted against $ at which
the temperature jump occurred... 25 0 -l1
3-6 Log c as a function of (l/T) in C for various hot-pressed specimens tested at
166 bars, except where noted... 28 3-7 Stress exponent, n, determined from all
differential tests and plotted against
%$ at which the jump in stress occurred... 30 3-8 Log s at 15% porosity versus the grain
Figure 3-9 Log P at 15% porosity and 166 bars and 1429 0C versus the normalized oxygen
fu-gacity for three 25-53 ym specimens... CHAPTER IV
Figure 4-1 Variation of the stress intensity factor, a eff/a, with the relative density, D, for
various a ff models... 43 4-2 Ashby deformation map for the upper
mantle... 47 vii Page
viii LIST OF TABLES Table 3-1 Table 3-2 Table 4-1 .Page Experimental data for hot-pressed olivine... 19 N and Q determined from differential test data.... 26 Transition from Coble creep to power-law creep.... 49
CHAPTER I INTRODUCTION 1.1 Introduction
Hot-pressing of refractory materials is a commonly used fabrication process (c.f. Ceramic Fabrication Processes, Kingery
(ed.), 1958). It is of interest to geophysics and rock mechanics from an experimental standpoint since artificial "rocks" of
controlled grain size and purity can be prepared, for the further testing of physical properties, such as creep behavior (Nicholas et al., 1975; Paterson and Weaver, 1970; Crouch, 1972; Warshaw and Norton, 1962; Pass-more et al., 1966), electrical conductivity
(Duba, 1972; Dvorak, 1973; Bradley et al., 1964), and ultrasonic velocities (Anderson and Kanamori, 1968; Ahrens et al., 1969). We report here quantitative data relating the density, grain
size, time, temperature, and compacting stress for olivine pow-ders both to assist others in designing the fabrication of aggre-gates of suitable quality as well as to shed light on the creep properties of very-fine-grain-sized olivine, a subject on which
there is very little data at present (Twiss, 1976). 1.2 Hot-Pressing
Sintering is essentially a process in which.an aggregate of fine particles, in contact with each other, consolidates when
heated to a suitable temperature. Hot-pressing is a pressure-sin-tering technique, i.e., an external pressure is applied to a pow-der at a suitable temperature to increase the rate of
consolida-2 tion as the powder sinters. In hot-pressing, the driving force
for densification is due to both the surface energy and the
applied pressure. Hence this technique results in a decrease in both the porosity and surface area, and, consequently, in a
simultaneous increase in the bulk density without the extensive grain growth and recrystallization that frequently occur if the specimen were sintered to the same final density. Since the time and temperature needed for densification is reduced, mater-ials can be hot-pressed to higher final densities than those that would be obtained from sintering.
CHAPTER II
EXPERIMENTAL TECHNIQUES 2.1 The Experiments
In this study, olivine powders of grain sizes ranging from lym to 2000pm were hot-pressed at temperatures between 9800C
and 16000C and at differential stresses between 100 and 400 bars. All tests performed on these olivine powders were isothermal, constant-load tests. However, in a number of experiments, either the differential stress was cycled between two levels at a con-stant temperature to determine the stress exponent, or the tem-perature was cycled at a constant stress to determine the acti-vation energy, Q.
2.2 Sample Preparation
The starting material. Powders were prepared from crystals of San Carlos peridot of composition Fo9 2. From optical
micro-graphs of the starting material, it was determined that these pow-ders were composed of regular, equiaxed but anhedral grains. The degree of roundness of the individual grains varies with the
grain size range -- the coarser grain size fractions containing a larger proportion of irregular, angular grains than the finer grain size fractions. An optical micrograph of the starting material for one size fraction is shown in Figure 2-1.
Durham (1975) determined that the starting material has a free dislocation density of between 104 and 10 5cm-2 and a total dislocation density, including subgrain walls, of between 105
Figure 2-1
Optical micrograph of the starting material. The specimens were prepared by hand-grinding and ball-milling crystals of
9 San Carlos peridot (Fo9 2) and were separated using standardized
sieves. A 25-53iim grain size fraction is shown in the micro-graph.
5
6 -2
and lQ cM 2 . Using infraed spectroscopy, Caristan (1976)
determined that the H/Si ratio in the starting material is less than 28 ppm. Consequently, the starting material can be
classi-fied as "dry" olivine.
Powder preparation. Powders of varying size fractions were obtained from the starting material by hand-grinding and ball-milling. Bits of iron from the ball were removed from the resulting powders using a magnet. The grain size fractions used in the experiments were separated using standardized sieves. The finest size fractions, i.e., those less than 25pm, were sep-arated by a modified pipette analysis.
2.3 The Apparatus
Pressure-sintering was performed in the one-atmosphere deformation apparatus described by Kohlstedt and Goetze (1974) and shown in Figure 2-2. All runs, except S13 (c.f. Table 3-1), were deformed with a servo-controlled constant-load apparatus in which the load is applied to the die assembly by compressing a spring of known spring constant using a servo-controlled piston. A direct current differential transformer (DCDT) measured the shortening of the spring, and this outpvt is fed back to the servo-controller to maintain a constant spring displacement. This apparatus uses a gas-tight seal around the sliding steel plug; and it was found that the 0-ring around the plug will sup-port up to 0.8 kg at room temperature. The maximum uncertainty in the applied load, aa, arising from frictional losses in the
6
Figure 2-2
Apparatus used for high-temperature low-stress deformation in a flowing gas atmosphere.
THERMOCOUPLE: W-5%RE W-26% RE FIXED PLUG BRASS FURNACE HOLDER DIE ASSEMBLY: CHAMBER PLUNGER B6RON NITRIDE POWDER 0-RING SEAL DCDT FOR STRAIP DCDT FOR LOAD TUNGSTEN-WOUND AL20320 FURNACE SAMPLE MO ROD AS INLET
DING STEEL PLUG
-SPRING
SPRING GUIDE
FIGURE 2-2
0-ring seal has been estimated to be 3% at aa = 100 bars, 1.5% at aa = 200 bars, etc., based on the 0.8 kg load for a 0.25" diameter plunger. Run number S13 was deformed using an appara-tus similar to that described above except that a
dead-weight-loading configuration (Durham, 1975) was employed. Since this configuration does not use a gas-tight seal around the steel plug, the frictional losses in the applied load are negligible.
The load is supported in the furnace by molybdenum rods
1/2" in diameter. Deformation of this column under stress occurs as the sample reaches its final density and the rods deform as
rapidly as the specimen. Measurement of the lengths of each rod before and after a run allowed the deformation of the column to be subtracted from the recorded piston displacement. The
effect of the column deformation is negligible for aa = 800 bars; it amounts to about 0.2% strain if a molybdenum plunger is used in the die assembly and about 0.03% strain at 166 bars if a tungsten plunger is used.
The die assembly (Figure 2-2) consists of a cylindrical chamber composed of molybdenum, 0.25" in interior diameter and 0.50" in exterior diameter; and a 0.25" diameter sliding plunger, composed of molybdenum in runs Sl-S12 and tungsten in all later runs, by which stress is applied to the specimen. In run S13, the interior diameter of the chamber and the diameter of the plunger were reduced to 1/16" diameter to decrease the sample size, but this sample size reduction increased the uncertainties in specimen height. The chamber bore is flat-bottomed to reduce uncertainty in the specimen height; from optical measurements of
the bottom curvature, the uncertainty in the specimen height was determined to be less than 1%. Since the plunger strained
slightly (less than 0.4% for molybdenum and 0.13% for tungsten as 166 bars) during each experiment, a 0.005" diameter differ-ence between the plunger and the chamber was used to prevent the piston from seizing up. The maximum uncertainty in specimen height resulting from the squeezing of powder into the space
be-tween the chamber and the plunger walls has been extimated to be less than ±0.5%.
To reduce pressure variations arising from uneven filling of the die and from wall friction, the length-to-diameter ratio of the specimens was minimized. The initial length-to-diameter ratios of all specimens vary from 0.4 to 0.7. The pressure dis-tribution in compacting a powder in a cylindrical die, pressing from one end, is shown in Figure 2-3 (from Kingery, 1960). Exam-ination of optical micrographs prepared from vertical sections through several specimens, however, showed no apparent variation in either the final density or the grain size throughout the specimen.
The specimen was heated using a tungsten-wound Al203 fur-nace that maintained a " hot-zone. The sample and the thermo-couple were positioned within this hot-zone. At 1200 0C, the temperature within the hot-zone varied by less than 1 0C; so we estimated the temperature gradient along the specimen to be less than 50C at T = 1600 0C. Temperature was measured by posi-tioning a W-5% Re/W-25% Re thermocouple inside the molybdenum
Figure 2-3
Pressure distribution in compacting a powder in a cylindrical die, pressing from one end. Lines of constant pressure are shown. Maximum resistance to compactness comes from wall fric-tion, and the pressure variation increases as the length-diamn-eter ratio of the die cavity is increased (After Kingery, 1960).
a.
40
--j=L~
column at the base of the die assembly, 1/8" from the base of the specimen; so the absolute temperature at the specimen should be known within ±100C at T = 1600 0C. Hence the uncertainty in strain rate at constant stress is less than ±12% using Q = 85 kcal/mole. Temperature is held constant to within about ±40C throughout a run by connecting the output of the thermo-couple directly to a temperature controller.
The sample is maintained within the stability field of Fo92 at high temperature (Muan and Osborne, 1965, p. 50 and p. 26; Nitzan, 1974) by controlling oxygen fugacity. In all experiments except S-19 and S-20, fugacity was controlled by flowing a 70% H2/30% CO2 (by volume) gas mixture through the furnace at the room temperature rate of 1 cm 3/sec; while in experiments S-19 and S-20, the oxygen fugacity was controlled by flowing a CO2/CO gas mixture (Log PCO2 /CO = -1.39 for S-19 and 0.38 for S-20). These gas mixtures maintain the sample near the reducing side of the olivine stability field.
Densification of the specimen was obtained from the summed output of a pair of DCDTs mounted on each side of a sliding
steel plug. The output from these DCDTs was fed to an X-Y strip chart recorder that plotted the movement of the plug as a func-tion of time. The density of a sample at any given time during densification was given by pb = (M/A)h 1, where p is the bulk density of the sample; M, its mass; A, its cross-sectional area;
and h, its height. Since M and A were constant for the hot-pressing die, the sample density was directly related to its height. For each run, the values of M and A were determined MMMIMA11161
initially and the final specimen was measured directly with a micrometer, where possible, or its length obtained from the final
length of the die assembly. Also, where possible, the final den-sity of each specimen was determined using the Archimedes liquid displacement technique, with carbon tetrachloride as the suspend-ing liquid. Ussuspend-ing these values, the percent porosity, %$, at any given time during the run could be determined from the relation:
P4
%$-
= 100 (1 - b (2-1),th
where pth is the theoretical density of the specimen; the instan-taneous strain rate, £, of the sample during any given time in-terval from the relation given in Equation 4-4. We estimated that the uncertainty in the porosity is less than ±1% and in the strain rate, less than ±5%.
2.4 Experimental Procedure
The weight of the sample was determined initially, and the initial lengths of the plunger, unloaded die assembly, and column parts, measured. The sample was then loaded into the die, and the die, 'cold-pressed with an arbor-press to insure that the die was evenly filled. The initial length was then determined from
the difference in lengths between the loaded and unloaded die assemblies.
The loaded die was inserted into the deformation apparatus described in Section 2.3, and a small load (10-20 bars at the
sample) applied to insure physical contact of the column parts. As the displacement and temperature were recorded on the strip
12
chart as functions of time, the temperature was raised to a pre-determined level. When the desired temperature was reached, the
load was applied. A rapid 50 -10 0C cooling of the sample resulted
during the initial application of the load as the column parts made better contact. After this initial cooling, however, the temperature of the column remained constant.
- To eliminate any complications in analysis arising from the variation in pore radii at any particular density (Section 4.1), we used a relatively high applied stress so that the driving
force of the surface energy (Appendix A) would be small compared to that of the applied stress. Consider a 5-10 ym sample at 0.1% porosity. Its median grain size was determined optically to be
7.2 pm; its median pore radii, 0.4 pm; We estimate the driving force due to surface energy in this case to be about 19 bars, or 11% of aa = 166 bars, and 6.5% of aa = 291 bars. See Section A-2.
At the end of the run, the final lengths of the plunger, loaded die assembly, and column parts were measured with a micro-meter. From the difference in lengths of the final loaded die assembly and the unloaded die assembly, the final specimen height could be obtained. Where possible, the sample was removed in-tact, and both its final length and final density, measured. In these cases, the uncertainty in sample height arising from the bore curvature and the squeezing of powder between ,the chamber
and plunger walls could be eliminated. These latter measurements were then used to interpret the strip chart record. The change
in the lengths of the column parts was calculated, and the change in length with time, subtracted from the displacement record to
13
correct for any straining of the column parts or plunger.
To summarize, we believe the uncertainties in stress to be within ±10%; and in strain rate, within ±5%, although for some specimens it may be larger below 5% porosity.
CHAPTER III RESULTS
3.1 The Hot-Pressed Specimens
Where possible, optical micrographs were prepared for dense specimens. What porosity remained in these specimens was almost exclusively concentrated at the grain boundaries as is evident in Figures 3-la and 3-lb. There was no apparent variation in either the grain size or density throughout these specimens, and no evidence of discontinuous grain growth in any of them. In
decorated micrographs (Kohlstedt et al., 1976) prepared from the medium- and fine-grain-sized specimens, dislocations were observed to be uniformly distributed throughout the individual grains.
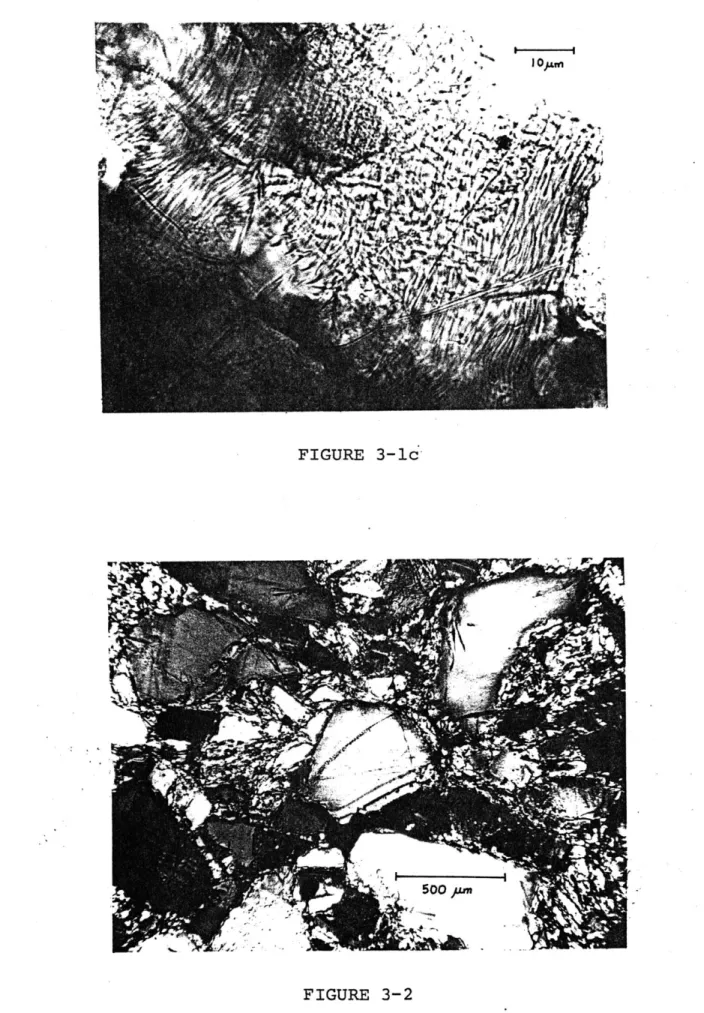
See Figure 3-lc. All, even the coarser grain sizes, showed var-iable extinction typical of plastically deforming olivine (Kirby and Raleigh, 1973); but variable extinction was not observed in the starting material. Evidently every grain in our hot-pressed specimens was stressed and was deforming plastically in response to the applied stress.
The fine-grained specimens (less than about 53ym) were observed to contain only fine-grain sizes with polygonal, equi-axed shapes, as is evident in Figures 3-la and 3-lb. For exam-ple, examination of the micrograph prepared for one 5-10pm spec-imen (S14) showed that the -median grain size of the polygonal, equiaxed grains was 7pm (determined from the mean intercept
length defined by Underwood, pp. 42-43, 1973), and that less than 10% of the specimen contained grain sizes greater than l0pm. Similar
15
Figures 3-la and 3-lb
Optical micrographs of dense hot-pressed specimens. The remain-ing porosity in these specimens is concentrated almost entirely at the grain boundaries. No apparent variation in density or grain size are evident in either micrograph. Also these is no evidence of discontinuous grain growth in either.
(a) Sample S-1: A 25 pm and less (bimodal) starting size 9 fraction deformed at 166 bars and 10000C and 12340C in
a CO2/H2 atmosphere. %$ is4.2%. The porosity appears . to consist mainly of isolated, spherical pores.
(b) Sample S-14: A 5-10 im specimen deformed at tempera-tures between 10190C and 1324 0C and stresses between
110 and 350 bars. %bf is 0.1%, as determined by immer-sion.
.44
44Z
observations were made on two of the 25 ym and less specimens (S-1 and S-2). Specimen S-2 contained a uniform distribution of poly-gonal particles with the median grain size, 22 ym. Less than 6% of this specimen was composed of particle sizes greater than 25
ym. Specimen S-1, though, contained a bimodal distribution of grain sizes -- approximately 50% in the 4-5 ym size range and
50% in the 20-25 pm range. Finally, in one 25-53 pm specimen run in a C02/H2 atmosphere (S-4), about 18% of the specimen was com-posed of grain sizes between 9 and 20 pm (average grain size =
12 pm) with the remainder of the specimen in the 25-53 ym size fraction (average size = 27 ym). The presence of finer-grain sizes in this hot-pressed piece (S-4) was probably the result of clumping of the starting material during sieving.
The coarse-grained specimens, on the other hand, were obser-ved to contain large fractions of equiaxed, fine-grain sizes con-centrated between the coarser-grained particles which more or less retained the shapes of the starting material. This is evi-dent in the micrograph in Figure 3-2. We believe that the fines in these coarser-grained specimens were probably formed by par-ticle fragmentation during arbor-pressing of the specimen and at the onset of loading, and that densification of the
coarser-grained specimens is aided by the densification of the fine-grain-sized particles in these specimens. For example, both the 105-250 ym specimens (S-3 and S-8) contained at least 20% fines in the 40-90 pm range, as compared with a 90-195 im grain size range
(average size = 112 pm) in the remainder of the specimen. Simi-larly, the 500-1000 im specimen (S-12) contained fines mostly in
17
Figure 3-lc
Optical micrograph of dislocations in one grain of specimen S-8 -- a 105-250 ym powder hot-pressed at 166 bars and 15900C. The specimen was decorated at 9000C for about 1 hour. The
dislocations in this specimen appear to be uniformly distributed throughout the grains.
Figure 3-2
Optical micrograph of a hot-pressed specimen, S-12. The start-ing size fraction for the specimen shown was 500-1000 yrm. This powder was tested at 166 bars and 16000C. The coarse-grained particles in this micrograph are mostly between 450 and 900 pm; while the fines are between 40 and 195 pm. We believe that
den-sification of such a coarse-grained specimen is aided by the densification of the fine-grained particles.
FIGURE 3-lc
500p
the 40-195 ym range (averige about 80 pm) and angular, irregular, coarse-grained particles mostly in the 450-1000 ym range.
3.2 Densification Curves
The experimental data are tabulated in Appendix B; and the experimental conditions under which each experiment was run, in Table 3-1. The stress, temperature, and grain size of each spe-cimen are given in Table 3-1, and both the Logl0 E at 15%
poro-sity and the Log1 0 c at 15% porosity, corrected to an arbitrar-ily-chosen common temperature of 1429 0C, are included for each test.
Densification curves for each constant-stress test are shown in Figure 3-3 which records the relative density, D = actual den-sity/single crystal density of 3.373 gm/cm 3, as a function of total elapsed time for each test. From the figure, it is evident that D increases with time. For a particular grain size and tem-perature, an increase in the applied stress (S-3) increases the densification rate for that test. A similar increase in the densification rate is observed when the temperature is increased during a constant-load test. Finally, it is observed that the
finer-grained specimens reach a particular value of D at lower temperatures than the coarser-grained specimens.
Plotting D versus elapsed time averages the length changes, and consequently, the strain rate over time. Therefore, to
obtain values for the stress exponent, n, and the activation energy, Q, it is necessary to plot the instantaneous strain rate as a function of the porosity, $ = l-D, as in Figures 3-4a and 3-4b. Considerable variation in the initial porosity of the
TABLE 3-1
EXPERIMENTAL DATA FOR HOT-PRESSED OLIVINE
Grain Size (prm) Stress (bars)
S-1 S-2 S-3 25 and less (bimodal) 20-25 105-250 25-53 1000-2000 250-500 1000-2000 250-500 500-1000 5-10 5-10 1000-2000 Tenperature (*C) -Iog i at %4=15% 166 166 166 298 200 166 166 166 166 166 166 149 110 177 350 110 210 110 177 110 177 210 291 1000 1234 1565 1469 1465 1430 v1433 1587 %1394 1600 1284 1019 1019 1019 1120 1120 1232 1232 1334 1334 1334 1624 3.64 -Ig 1 4 29at %$=15% 3.09 2.52 3.95 4.62 3.86 4.55 4.29 6.14 5.78 6.28 5.91 6.77 3.93 3.142 4.37 3.61 4.30 4.06 6.13 5.75 5.35 4.95 5.23 3.07 "u6. 72 n6.48 4.81 4.61 3.64 3.42 4.76 I 9 Run # 6.23 2.05 ".4. 30 n4.06 3.38 3.18 2.99 2.77 S-4 s-7 S-9 S-ll S-12 S-13 S-14 S-15
TABLE 3-1 (Cont'd.)
Grain Size (pm) Stress (bars)_
S-16 25-53 (CO2/CO) 25-53 (C02/CO) 20-25 10-15 15-20 Run # 291 110 291 110 110 176 291 176 209 243 273 291 169 292 170 170 246 246 5.12 4.88 4.55 5.52 4.10 5.38 4.84 3.83 2.62 2.82 2.49 5.28 4.82 5.28 4.74 4.53
Temperature (*C) -Log tat %$=15% -log 429at% $=15%
1008 -- --1157 -- --1176 5.19 3.28 1244 5.27 3.94 1305 5.14 4-.28 1305 4.81 3.95 1305 4.41 3.55 1173 4.67 2.74 4.64 2.71 4.61 2.68 4.63 2.70 4.58 2.65 1047 5.63 2.47 1112 1159 1159 1393 1549 1413 1413 1545 S-17 S-18 S-19 S-20
21
Figure 3-3
Plot of relative density, D, versus the elapsed time, where D = (actual density/single crystal density). The curves repre-sent actual data for all hot-pressing runs except the differen-tial tests.. The experimental conditions under which each test was conducted can be obtained by referring to Table 3-1.
S 0 1-0 -- --S-2. I- * - -- 4 0 -9 -ogo 00- d- -. w #U--. - --- ---,w*OV -- -- go - -80 -. o-"S -O-7
-07
Son Corios perId
-
-0 - -s - - -
-I085
10
50
100
Elopse
Time
(in min.)
22
Figure 3-4
Log1 0 of the instantaneous strain rate is plotted versus por-osity for 3 25-53ym hot-pressing tests. It is apparent that all three curves have the same general shape, except at the beginning and end; so the general variation of Log1 0 E with
can be described by a single curve.
(a) Run #S-4: 1465*C; 166 bars; CO2/H2 atmosphere (30% CO2; 70% H2 by volume).
(b) Run #S-19: 1393*C and 15490C; 170 bars; CO2/CO
atmosphere with log PCO2 CO = -1.39.
Run #S-20: 1413*C and 1545*C; 170 and 246 bars; CO2/CO atmosphere with log PC02 /PCO = 0.38.
-2 25-53 pM 1465* C 966 bore 3 -Cot/"a 4y . --- 3 . * ' 0AIR, -rA SS -6-53 se 6? ,. -o D- A 5 .0 70 be 9-1 B 0 5 t0 15 20 25 30 35 % POROSITY FIGURE 3-4 iiimiiiimi I iullkilililililiilll6 v 9 v v
23
specimens is evident in those figures since the degree of packing in a particular specimen depends upon both the grain size and the compaction of the specimen by the arbor-press. Also a large
change in the strain rate without significant densification occurs at the onset of the load as a result of particle fragmentation and rearrangement. This initial rapid densification rate is not evident in Figure 3-3 as it is completed within the first
minute. The final density reached by any specimen is determined by the grain size, temperature, and stress conditions of the
test; as a final density is approached for any given test condi-tions, the densification rate, and consequently, the Log e
decrease. Some runs were terminated by the seizure of the plun-ger in the die, as is evident from the sharp change in the slope of the Log s curves over- the last few percent of attained
poro-sity (Figure 3-4A) and for run S-4 shown in Figure 3-3.
We will assume that the general variation in Log c values with porosity can be described by a single curve, the slope of which has been determined from the trend of the data in Figure
3-4. This general curve shape has been fitted to all tests; and the Log c values both at 15% porosity and at the temperature and stress jumps have been determined from this best-fit curve. For all tests, the largest deviations of the experimental data from the general curve occur immediately after the initial onset of the load and during the last 5% of attained porosity, The typi-cal agreement of these curves with the data is shown in Figure 3-4.
3.3 The Effect of Temperature on the Strain Rate
The effect of temperature on the strain rate for each grain size was studied by cycling the temperature between predetermined values during a constant-load test (differential tests). Since densification during pressure-sintering is often described by an equation of the form:
= Aan exp(-Q/RT) (3-1),
where is the strain rate: A, a constant; a, the applied stress; Q, the activation energy for the deformation process involved in densification; n, the stress exponent related to the specific deformation mechanism; R, the gas constant; and T, the tempera-ture (Coble, 1970; Wilkinson and Ashby, 1975; Urick and Notis, 1973), the values of the activation energy, Q, at a constant stress and grain size could then be determined using the rela-tionship: (In - l n E 2) Q =-R (3-2) (-j -- ) 12
The values of Q determined in this manner are summarized in Table 3-2 and plotted versus porosity in Figure 3-5. Additional data were obtained by plotting the Log i at 15% porosity and constant
stress as a function of 1 for each grain size. This plot yields the temperature dependence of the creep rate during the hot-press-ing of olivine. This second set of data is plot-ted in Figure
3-6. From the slope of the curves in Figure 3-6, the activation energies for each grain size can be determined. There appears to
Figure 3-5
Activation energies, Q, determined from differential tests are plotted against the porosity at which the jump in temperature occurred. Symbols (I, 0, etc.) on plot refer to the grain size of the specimen. There appears to be no systematic variation of Q with either the porosity, stress, or grain size, so far as
tested. Symbols: V 5-10im A 10-15pm * 15-20pm
©20-25ptm
(25pm and less + 25-53ym (CO 2/H,) @ 25-53ym (C02/C8) 0 105-250pm A 250-500pm 1000-2000pm140
, , a , 1 .-120
100
1246
0 cpo-ca
g40
20
-CO
3/CO:
C0
3a/Has
ol others
-
66-9?0 bore
exesst
win
note
0
1020
% Porosity
FIGUR! 3-s
TABLE 3-2
N AND Q DETERMINED FROM DIFFERENTIAL TEST DATA
Grain Size (Pm) Stress (bars) Teuperature (*C)
25 & less (bimodal) 105-250 5-10 20-25 166 S-1 s-3 110 176} 176 2911 291 110 291} 1000 1234 1469 166 298} 200 298 110 177k 177
350}
177 110 110 1771 110 110 177 177 Porosity 25.2 19.4 18.5 12.0 37.3 36.6 32.2 30.0 20.5 4.0 4.0 23.3 21.6 17.4 Q (kcal/nole) 104.7 3.11 3.61 3.66 3.73 4.99 113.0 153.3 102.6 1.21 139.9 2.28 2.15 1019 1019 1019 1234 1120 1232 1232 1232 1333 1333 1232 1333 1305 1305 1305 1l176 1305 16.5 Run # 63.3 S-14 S-16 1.68TABLE 3-2 (Cont'd.)
Grain Size (pm) Stress (bars) Teperature (0C)
10-15 15-20 25-53 (CO2/CO) 25-53 (CO2/CO) Run_# S-17 176} 209 209} 243 243 273~ 273 291 169 169 292 169 169 292~ 169 292~ 170 170 246 246 246 Porosity 21.2 19.0 16.4 15.2 21.6 21.6 20.0 20.0 22.8 22.8 1173 1173 1173 1173 1047 1112 1159 1047 1112 {1159 1159 11.59 1047 1112 1159 1393 1549 1413 1413 {1545 1413 ~1545 Q (kcal/mole) 1.48 1.38 1.49 1.80 79. 8 . 1.14 50.2 50.2 1.18 1.13 46.3 56.9 124.9 3.49 83.8 104.7 9 I 9 22.0 26.0 26.0 18.0 S-18 S-20
28
Figure 3-6
Logl 0 as a function of l/T (C 1) for various grain size hot-pressed specimens tested at 166 bars. All values of LoglO
plotted were picked from the experimental curves at a porosity of 15%. All Log i values, except where noted, are for tests conducted at 166 bars. From the slope of the curves in this
figure, the activation energy can be computed. A curve with the slope Q = 85 kcal/mole has been included for comparison. The symbols used in this figure are the same as those in Fig-ure 3-5.
85
kcal/mole
.14% Porosity 166 bars . a . a p . . . 3 a -I -2 -3LOG
~.4
E
-'5(sec'')
-6
-7
GrminSize(ip) 1-0 FIGURE 3-65-10
10-15 15-20 2 0-25 25-53 (COlt/liz) 105-250 250-500 500-1000 1000-2000 25-53 (CO2t/CO) 25 and ess (b".a'I)0
0
0.9
0-8
0.7
0-6
29
be no systematic variation of the activation energy with either stress, grain size, or porosity so far as tested. The median value of Q determined from both the differential test data for porosities between 10% and 25% (Figure 3-5) and from the curves in Figure 3-6 is 85±29 kcal/mole.
3.4 The Effect of Stress on the Strain Rate
The effect of stress on the strain rate was determined by cycling the specimens at constant temperature between predeter-mined values of the applied stress. Again the formulation of Coble (1973) and Wilkinson and Ashley (1976) given in Equation
3-1 was used but this time for a constant temperature; and the value of the stress exponent, n, could then be determined at a particular porosity from the strain rates, 1 and 2, for each
stress, a1 and a2, respectively, from the expression: ln 1 - ln E
n = -(3-3).
ln a 1 - ln a
2
The variation of n with porosity and grain size is plotted in Figure 3-7. The values of n determined at each porosity and
grain size from the stress jumps are tabulated in Table 3-2. For a given grain size, inaccurate values of n are determined at the beginning and end of the run since the densification rate is changing rapidly for a given change in the porosity. From Fig-ure 3-7, it was observed that the average value of n is about 3.4 ±0.8 for the medium-grain-sized specimens, 25-53ym and 105-250pm, but only 1.5 ±0.4 for fine-grained specimens,
Figure 3-7
The stress exponents, n, determined from all differential tests are plotted against the porosity at which the jump in stress occurred. The symbols in the figure refer to the grain size of the specimen and are the same as those in Figures 3-5 and 3-6. For the range of porosity, 10-25%, there is no systematic var-iation of n with porosity. The varvar-iation of n with grain size is evident -- the fine-grained specimens having an average n
0 of 1.5 ± 0.4; while the medium-grain-sized specimen, average
0 0 - U U . . . 5 4 1 A a a a A a a IN a a a - 2 * a
j
10 20% Porosity
Symbols v 5-10 A I0-15*
15-20
* 20-25 * 15-530
105-250
30 FIGURE 3-7*1~
I
4+
c CL xa.
V/)2
10
.I
31
3.5 The Effect of Grain Size on the Strain Rate
To determine the effect of grain size on strain rate, it is necessary to reduce all data to a common temperature; we have arbitrarily chosen 14290 C. The Log1 0 values for each grain size were determined at 15% porosity and 14290 C from the curves in Figure 3-6. Only the curves for tests conducted at stresses between 166 and 170 bars were used. For those grain sizes where the slope of the curve in Figure 3-6 was not known, the Logl0o1 values were calculated assuming an activation energy of 85 kcal/ mole. The strain rates so determined are plotted as a function of grain size in Figure 3-8. The slope of the curve which 'best-fits' the data in this figure shows the strain rate to be inver-sely proportional to approximately the third power of the
grain size for grain sizes below about 53 um, and indicates that the grain size dependence decreases as the grain size is increa-sed above 53 ym.
3.6 The Effect of Atmosphere and Oxygen Fugacity on Creep Rate Three 25-53 pm specimens were hot-pressed to determine if the oxygen fugacity and the atmosphere have any effect on the creep rate. In order to compare these tests, corrections are needed for temperature and stress. The Log i values for all
25-53 ym specimens at 15% porosity were normalized to a common temperature of 1429 0C using Figure 3-6 and an activation energy equal to 85 kcal/mole. The fugacity values obtained at differ-ent temperatures were also normalized to a common temperature of 14290C using the stability field determined by Nitsan (1974) for
Figure 3-8
Log1 0 e values are shown for each grain size at 15% porosity and a common temperature of 1429 0C. Only Log c values obtained
from tests conducted at stresses between 165 and 170 bars were used. The grain size fraction at each value of Log s are plot-ted are plotplot-ted as vertical bars; the uncertainities in Log e, as horizontal bars. The 'best-fit' curve through the data
suggests that the e for fine-grained powders (G<25pm) varies as the inverse third power of the grain size.
Also included in the figure are Log e versus grain size curves obtained from the rate equations for Coble and power-law creep, c.f. Equations 4-2 and 4-3, respectively. Each curve assumes
a different formulation for the effective stress, a ff* See Section 4-1. The grain size at which the transition from Coble to power-law creep occurs has been determined for each model, and this transition is shown for each a eff model as a horizontal line in the heavily stipled region.
4- 0
Porosity 13%
Temperature z 14290 Crhm
Applied Stress alS6 bars*
1~.
'bee 3.0 vearticai bar* : gro In sizes range
horizontal bars: uncertoinltice..
E
I I
4 C . POWER-LAW CREEP>cubic
2-0 .,* ./.. .ILI
Temperatur4 =- rhm 6490C- i-=W Ap id Stbs16br D R-C-b.b POWER-LAW CREEP- 4 ~ 0 .J i- 0 0-0 R-C: rh.-.-Wilkinson-Ashbyslope -3-OS 9*
<-COBLE
CREEP-O Ic /Co
-C0,/ 1M
0 -1-0 -2-0 -3-0 -4-0 -5-0 -6-0 -70 -8-0 LOG E (SecI )
Fo92 as a function of oxygen fugacity and temperature. That is, the experimentally determined oxygen fugacities were normalized by f =10-10.49, the oxygen fugacity of Fo9 2 at the reducing end
of the stability field for a temperature of 1429 0C. See the insert in Figure 3-9. The resulting values of Log as a func-tion of oxygen fugacity are plotted in Figure 3-9 for a common stress of 166 bars, assuming n=3, a common temperature of 14290C, and 15% porosity. The strain rate determined for the 25-53 ym specimen from the curve that "best-fits" the data' in Figure 3-8 has also been plotted in Figure 3-9 as a solid dot. We observe that there is little variation of strain rate with oxygen fuga-city for the specimens hot-pressed in a CO./CO atmosphere.
Kohlstedt and Goetze (1974) also noted that the effect of oxy-gen fugacity on strain rate was small. Also, there is an indi-cation that the strain rate for the samples deformed in the CO2/H2 atmosphere is faster by a factor of 3 to 5 than the
strain rate of those specimens deformed in a CO2/CO atmosphere.
Figure 3-9 0
Log s values at 15% porosity are plotted versus the oxygen fuga-city for three 25-53 ym specimens. All Log e values were nor-malized to a common temperature of 1429 0C using the curves in Figure 3-6 or an activation energy of 85 kcal/mole. All Log E values were also normalized to a common stress of 166 bars, assuming the stress exponent, n, equaled 3. In addition, the oxygen fugacity values were normalized to a common temperature of 1429 0C using the fugacity for the reducing end of the stab-ility field of F92'i.e., f = 1010.49. See the insert in Figure 3-9 (from Figure 1, Nitsan, 1974).
It is evident in Figure 3-9 that there is little variation of Log e with oxygen fugacity, but there is an indication that the Log e values obtained in a CO 2/H2 atmosphere are faster by a factor of 3 to 5 than those values obtained in a CO2/CO
atmos-phere. For comparison, the Log £ value determined from the curve that 'best-fits' the data in Figure 3-8 was plotted in Figure 3-9 as a solid dot.
I U U U
Log E corrected to 1429* C and
166 bor*
Log f4O corrected to 1429* C
.O
coz/Co
A CSa/ H& Best-fitacurve (Co0/Hg) d-4 0o0
-28 600 12 10 a 610 /T
(*K
)
I p I A p p A p p ~ pLog (f
0/f)
FIGURE 3-9T ('C)
1000
5s00. I 0 mp 0 -J-41-0
-6fa
35
CHAPTER IV DISCUSSION
4.1 Adaptation of Theories of High-Temperature Creep to Hot-Pressin
Adaptation of the high-temperature creep models for Nabarro-Herring creep (Nabarro, 1948; Nabarro-Herring, 1950), Coble creep (Coble,
1963), and power-law creep (Weertman, 1968; Argon, 1968) to hot-pressing appears to be straightforward and has been done by a
number of authors, including Coble (1970) and Wilkinson and Ashby (1975). The rate-equations obtained for hot-pressing are formu-lated in terms of fundamental constants (DB, Q, etc.) and are for Nabarro-Herring creep (Coble, 1970):
b
NH 40D QNH V P (4-1),
3kTG2
where D is the relative density; G, the grain size in cm.; Dv' the lattice diffusion coefficient; Q, the atomic volume; and P, the stress driving densification (discussed below); and for Coble creep (Coble, 1970):
D 47.5 D T6
C 3 b P (4-2),
D kTG
where 6 is the grain-boundary width; and Db, the grain boundary diffusion coefficient; and for power-law creep (Wilkinson and Ashby, 1975):
DPLC
I./kT)
Pn
D [kTyn
I
cwhere A is a material constant;-, the Burger's vector; Qc, the activation energy for creep; and vi, the shear modulus. These rate-equations permit the evaluation of the kinetics with
density when all the fundamental constants are known. Unfortu-nately, these data are not available for most materials. For example, data are available for power-law creep in olivine, but not for Coble creep.
The high-temperature creep equations cannot be rigorously applied to predict the time dependence of densification (Coble, 1970) because the flow equations are assumed to terminate at the grain boundaries rather than at the pores. Because of this, the adaptation of the high-temperature creep equations to hot-pres-sing can only approximate the instantaneous rate of densifica-tion. In addition, the effective stress, discussed below, which motivates material transport, is not precisely known in terms of the applied pressure and the porosity.
Derivation of hot-pressing rate equations from the high-temperature creep equations. Since the mass, M, of a powder com-pact and its cross-sectional area, A, are constant in a hot-pres-sing die, the sample density, p = (M/A)h 1, is directly related to the samole height, h. When this relation is differentiated with respect to time, an expression is obtained relating the
linear strain rate, e, in the high-temperature creep models with the densification rate, D, for hot-pressing:
- .1 h = . h (4-4).
37
4-4 can be obtained directly from measurements of plunger travel in a die.
The applied stress, a, in the high temperature deformation models is replaced by an expression:
=0eff r I
eff - Pi(4-5),+
incorporating the effective stress, aeff' discussed below; the driving force due to surface energy, 2y/r (final-stage densifi-cation); and the internal pore pressure, P..
Assuming the pore radius, r, can be approximated by
r = (1-D)1/3(G/2) (4-6),
where G is the grain size in cm. (Coble, 1970), the driving force resulting from the surface energy (Appendix A) at 1% porosity is negligible compared with the applied stress. For example, for a 7pm powder, the surface energy term is 6% of the applied stress, aa = 166 bars; and for a 150pm powder, 3% of oa. Also, the inter-nal pore pressure, Pi, may be neglected for the hot-pressed speci-mens in this study. If it is assumed that all pores close at 5% porosity (this assumption will be discussed in detail below), the internal pressure in pores of a 7pm powder will only be 8 bars at 1% porosity and 87 bars at 0.1% porosity.
Equation 4-4 relates the densification during hot-pressing, D, to the linear strain rate in the high-temperature creep models. When the linear strain rate, , in these models is replaced by D and the applied stress, a, by the stress driving densification, P, given in Equation 4-5, the hot-pressing rate equations given
38
in Equations 4-1, 4-2, and 4-3 are obtained. These equations are
valid for the intermediate stage, up to 95% theoretical density, ' of hot-pressing, i.e., when the compact has sintered to the point
where the pores between grains are roughly cylindrical in shape. The expressions appropriate for the final stage of densification, when the compact contains only isolated, spherical pores, have
been derived by Coble (1970) and Wilkinson and Ashby (1975) by mod-eling the compact by a thick, isolated spherical shell centered on a spherical pore. However, the densification rates predicted for the final stage of sintering differ only by a small numerical factor from those, for the intermediate-stage of densification.
Theory of pore cZosure during hot-pressing. In a porous
body undergoing sintering, the pores tend to remain at the lowest energy sites, i.e., the grain boundaries. Since the grain-bound-ary energies are usually less than half of the material's surface energy, the dihedral angle of the pore is high and it is thus
reasonable to model the pore shape by a cylinder (Budworth, 1969). This is the pore shape assumed in intermediate-stage hot-pressing. The cylindrical shape becomes unstable with respect to the sur-face energy of the pore when the length of the cylinder becomes equal to its circumference. At this stage during sintering
(final stage), the cylindrical pores pinch off and close. The closed pores are isometric in shape (optical examination confirms
this); so it is generally assumed that during the final stage of densification, the pores are spherical in shape.
39
The critical value ofporosity, where the cylindrical pores start to pinch off and close, has been computed by Budworth
(1969). Assuming that the cylindrical pores can be modeled by truncated octahedra, the critical porosity is 16%; but for a sur-face energy model, the critical porosity is 8%. The later model
is more realistic. The values of critical porosity actually observed are between 5% and 15%.
As Budworth's calculation suggests, the pores in a powder compact remain entirely open until about 85% of theoretical density is reached. At this time, some pores begin to close; the number of pores closing increases slowly at first and then more rapidly until all pores are closed at about 95% of theo-retical density.
Rao and Chaklader (1972) do not distinguish in their model whether the pores are connected or not; while Coble (1970) and Wilkinson and Ashby (1975) need to know both the appropriate pore shape and whether or not the pores are closed. Coble derives the densification equations for diffusional creep by assuming the pores remain open until 95% of theoretical density
is attained. To derive an expression that is valid for the final 5% of densification, the powder compact is modeled by a thick, isolated spherical shell of material of radius, b, centered on a spherical hole of radius, a. This simply introduces a small numerical factor into the densification equation. Wilkinson and Ashby (1975), on the other hand, assume that the powder compact contains only isolated, spherical pores once 80% of theoretical density is reached. Although their model is not precise, the
I I IWIN 11611, 11,, , I
40 densification rates they obtain will only differ by a small nu-merical factor from those obtained by Coble (1970).
The effective stress during hot-pressing. Because of
por-osity, the applied stress producing a given amount of strain in a porous aggregate is greater than the stress producing an equi-valent strain in a single crystal. Although the effective stress varies with both the porosity and the pore shape, it is
gener-ally assumed that the effective stress is a function of porosity alone; and that the pofe shape remains constant over the densifi-cation interval to which a hot-pressing model is applied.
The effective stress motivates material- transport during hot-pressing. During the initial stage of hot-pressing, the con-tact stress, and, consequently, the effective stress must be
large because the contact area is very small. However, as defor-mation of.the points of contact proceeds, the contact stresses and the effective stress will gradually decrease. Finally, as theoretical density is approached, the effective stress decreases to a value equal to the applied stress.
Attempts to characterize the highly variable differential stresses within individual grains of an aggregate during hot-pressing have been the subject of several papers (McClelland,
1964; Spriggs et al., 1964; Farnsworth and Coble, 1966; Rao and Chaklader, 1973; Wilkinson and Ashby, 1975). In order to adopt the rate-equation for hot-pressing (Murray et al., 1958):
dD _P
to flow in crystalline materials, McClelland (1964) introduced an expression for the effective stress:
aeff = P /(-V 2/3) (4-8), where V is the volume fraction porosity. Spriggs et al. (1964) suggested that the effective stress in a crystalline material could be better expressed by
a = P a(1+2V ) (4-9).
This expression is an adaptation from the experimental and theoretical changes in elastic modulus with porosity. Farns-worth and Coble (1966) introduced the relation:
aeff,= Pa/D (4-10).
where D is the relative density, for the evaluation of the strain rate in polycrystalline silicon carbide; while Rao and Chaklader (1972) suggested that the stress effectively causing deformation in a porous polycrystalline solid could be computed from the deformational geometries of the particles in contact. They proposed that under a uniaxial load, the effective stress can be calculated if it is assumed that the particles, being deformed at the points of contact, are monosized spheres with an assumed packing geometry. The resulting expression is
a eff = 1)] (4-11),
where a and S are geometric constants whose values depend on the packing geometry; and R is the particle radius.
42 All the formulations for o eff suggested above are plotted as a function of D in Figure 4-1. The curves labelled "bcc", "ortho", "rhomb", and "cubic" correspond to the packing syrme-tries of the quasi-spherical model proposed by Rao and Chakla-der (1972). Even though the expressions given for the effec-tive stress in Equations 4-8 through 4-10 are different, the values of the effective stress at a particular density are al-most equivalent. The values of the effective stress calculated
from Equation 4-10, on the other hand, differ greatly from those computed from the other expressions.
Coble (1970) considered the formulations for effective 9 stress proposed by McClelland (1964), Spriggs et al. (1964) and
Farnsworth and Coble (1956) -- Equations 4-8 through 4-10
--and concluded that the effective stress in the grain boundary 9 should not include a stress concentration factor, a /a, due
eff
to porosity because both the stress distribution on the grai boundary and the concentration distribution of defects along the grain boundary must satisfy the diffusion equation. Hence he suggested that only the form of the effective stress given by Equation 4-10 is acceptable for intermediate to final stage hot-pressing. Coble however did not consider Equation 4-11. As can be seen in Figure 4-1, the stress concentration factor predicted by Equation 4-11 for each of the packing geometries is much high-er than that predicted by Equation 4-10. In the next section we will compare the densification rates predicted by both of these
formulations with the densification rates obtained from the ex-perimental data to determine which of the formulations gives