HAL Id: hal-01002142
https://hal.archives-ouvertes.fr/hal-01002142
Submitted on 5 Jun 2014HAL is a multi-disciplinary open access archive for the deposit and dissemination of sci-entific research documents, whether they are pub-lished or not. The documents may come from teaching and research institutions in France or abroad, or from public or private research centers.
L’archive ouverte pluridisciplinaire HAL, est destinée au dépôt et à la diffusion de documents scientifiques de niveau recherche, publiés ou non, émanant des établissements d’enseignement et de recherche français ou étrangers, des laboratoires publics ou privés.
Hole doping by pressure on the 1111 pnictides CaFeAsF
and SrFeAsF
Daniele-Cristina Silva-De-Freitas, Gastón Garbarino, Ruben Weht, Amadou
Sow, X. Zhu, F. Han, P. Cheng, J. Ju, H.H. Wen, Manuel Nunez-Regueiro
To cite this version:
Daniele-Cristina Silva-De-Freitas, Gastón Garbarino, Ruben Weht, Amadou Sow, X. Zhu, et al.. Hole doping by pressure on the 1111 pnictides CaFeAsF and SrFeAsF. Journal of Physics: Condensed Matter, IOP Publishing, 2014, 26 (15), pp.155702. �10.1088/0953-8984/26/15/155702�. �hal-01002142�
Hole doping by pressure on the 1111 pnictides CaFeAsF and SrFeAsF
Daniele C. Freitas1, Gastón Garbarino2, Ruben Weht3, 4, Amadou Sow1, Xiyu Zhu5, Fei Han5, Peng Cheng5, Jing Ju5, Hai Hu Wen5, Manuel Núñez-Regueiro1
1. Institut Néel, Centre National de la Recherche Scientifique (CNRS) & Université Joseph Fourier (UJF), 25 Avenue des Martyrs, F-38042 BP166 Grenoble Cedex 9 France
2. European Synchrotron Radiation Facility (ESRF), 6 Rue Jules Horowitz 38043 BP 220 Grenoble 3. Gerencia de Investigación y Aplicaciones, Comisión Nacional de Energía Atómica (CNEA), Avda. General Paz y Constituyentes, 1650 - San Martín, Argentina
4. Instituto Sabato, Universidad Nacional de San Martín - CNEA, 1650 - San Martín, Argentina 5. National Laboratory for Superconductivity, Institute of Physics and Beijing National Laboratory for Condensed Matter Physics, Chinese Academy of Sciences, P. O. Box 603, Beijing 100190, China
We determine the pressure phase diagram of the 1111 compounds CaFeAsF and SrFeAsF, up to 20GPa and down to 4K by electrical resistivity measurements and the change of structure up to 40GPa at room temperature. The antiferromagnetic transition temperature, as determined by the derivative peak, shows a minimum at ~5GPa (10GPa) for the Ca (Sr) compound. For CaFeAsF, superconductivity appears at this minimum, coincident with the development of a previously reported monoclinic phase. For SrFeAsF, where the orthorhombic and the monoclinic phase were reported to coexist, superconductivity exists above P≥1GPa. Both phase diagrams can be scaled by a shift of ~10GPa, pressure at which the volume of SrFeAsF and that of CaFeAsF at ambient pressure coincide. The difference of our phase diagram with that of electron doped 1111 samples is accounted by hole doping under pressure, that we verified through electron band structure calculations.
Short Title: Hole doping by pressure in 1111 pnictides
The first discovered iron superconductors[1] were the so-called 1111 phases that are
composed of stacked LnO layers and FeAs layers ( Ln is a lanthanide) in a tetragonal (
P4 / nmm ) ZrCuSiAs type structure. At temperatures around 150K, depending on the
lanthanide, an orthorhombic ( Cmma) distortion develops, followed by an antiferromagnetic
state several Kelvin degrees below[2]. The antiferromagnetic state is currently attributed to
the development of a spin density wave (SDW), caused by the nesting of the cylindrical hole
and electron sheets of the Fermi surface[3]. Electron doping by, e.g. replacement of oxygen
by fluorine, leads to the disappearance of both the orthorhombic distortion and the SDW[4] ,
and the emergence of superconductivity. The phase diagram of electron doped 1111
compounds have been largely studied and it seems that there is almost no coexistence
between the antiferromagnetic and the superconducting phases, i.e. the transition as a function
of doping is apparently of first order [5,6,7]. It has also been shown that hole doping of 1111
compounds can induce superconductivity [8,9]. However, there is to date no detailed study of
the hole-doped phase diagram of 1111 compounds. Such a study is of central importance, as
in cuprates the phase diagram is different for holes and electrons, posing stringent restrictions
on possible theories[10]. On the high temperature cuprate superconductors it is accepted that
application of pressure is equivalent to hole doping[11]. Simply speaking, the positively
charged reservoir layers pump electrons from the negatively CuO22- layers as pressure reduces
the distance that separates them. In analogy with cuprates, application of pressure has been
shown to induce hole doping in the planes in the iron superconductor
[12]. Thus one way to study the hole-doped phase diagram would be to apply pressure and
follow the different transition temperatures. We report here on coupled transport and
structural studies, combined with electronic band structure calculations, of 1111 CaFeAsF and
SrFeAsF under pressure.
The CaFeAsF (SrFeAsF) samples were prepared using a two-step solid state reaction method,
FeAs Sr
as used for preparing the LaFeAsO samples[13]. In the first step, CaAs ( SrAs) was prepared
by reacting Ca (Sr) flakes (purity 99.9%) and As grains (purity 99.99%) at 500 °C for 8 hours
and then 700 °C for 16 hours. They were sealed in an evacuated quartz tube when reacting.
Then the resultant precursors were thoroughly grounded together with Fe powder (purity
99.95%) and FeF3 powder (purity 99%) in stoichiometry as given by the formula CaFeAsF
(SrFeAsF). All the weighing and mixing procedures were performed in a glove box with a
protective argon atmosphere. Then the mixture was pressed into pellets and sealed in a quartz
tube with an argon atmosphere of 0.2 bar. The materials were heated up to 950 °C with a rate
of 120 °C/hr and maintained for 60 hours. Then a cooling procedure to room temperature was
followed.
The electrical resistance measurements were performed using a Keithley 220 source and a
Keithley 2182 nanovoltmeter. Pressure measurements, 1.4−22GPa(between 4.2K and
300K), were done in a sintered diamond Bridgman anvil apparatus using a pyrophillite gasket
and two steatite disks as the pressure medium[14]. Pressure cannot be cycled and thus
measurements are done only with increasing pressure.
The angle dispersive X-ray diffraction studies on CaFeAsF and SrFeAsF powder samples
were performed at the ID27 high-pressure beamline of the European Synchrotron Radiation
Facility using monochromatic radiation (λ=0.3738Å) and diamond anvil cells. The
transmitting media was nitrogen. The pressure was determined using the shift of the
fluorescence line of the ruby. The diffraction patterns were collected with a CCD camera, and
the intensity vs. 2θ patterns were obtained using the fit2d software[15]. A complete Rietveld
refinement was done with the GSAS-EXPGUI package[16].
The electronic properties for the different structures were analyzed within the Density
Functional Theory (DFT) framework. We used a full-potential linearized augmented plane
positions for the “heavy” elements were taken directly from the experiments while fluorine
coordinates were fixed at their high symmetry positions. We did not do any relaxation or
structural minimization.
On Fig. 1 we show the evolution with pressure of the temperature dependence of the electrical
resistance of one of the two samples of CaFeAsF. The curves flatten and, above 5GPa show
clear signs of appearance of superconductivity, as already reported [19]. The absence of
percolation can be attributed to the powder nature of the sample and its sensibility to exposure
to humid air during mounting, that causes insulating skins on the sample grains. We define
the superconducting onset transition temperature Tc by the peak in the resistance. We also
show the derivative of the resistance, with a peak that habitually signals the appearance of the
antiferromagnetic ordering, TN. While at low pressures the peak shifts to lower temperatures
with pressure, at higher pressures the tendency is clearly reversed. We have also measured
two samples of SrFeAsF with similar results. We plot on Fig. 2 the evolution of both
transitions with pressure for all the samples. Differently to previously reported high pressure
measurements on 1111 materials (LaFeAsO [20], CaFeAsF [19]) we were able to follow the
evolution of the transitions for the whole pressure range, without any drop or discontinuity.
A brief description of the pressure temperature structural phase diagram of both compounds
has been reported in Ref. [21]. At constant low temperature, both compounds present a
transition from orthorhombic to monoclinic (shown on Fig. 2), with a coexistence region
between both structures for SrFeAsF. On the other hand, for CaFeAsF they find a transition
from the high pressure-low temperature monoclinic to the tetragonal phase at P=24GPa,
T=200K, that falls within error at the extrapolation of our TN(P) curve . If we accept that the
peak of the derivative is always associated to TN, we can infer that, at high pressures, the
antiferromagnetic state coexists with a monoclinic, not orthorhombic phase. Concerning the
disappearance of the orthorhombic distortion for CaFeAsF, similar to what occurs in the
electron doped phase diagram. However, it now coexists with a monoclinic distortion, which
has not been observed on electron doping. For the SrFeAsF compound, superconductivity is
already detected for the smallest measured pressure, when the sample presumably is in the
orthorhombic phase. However, according to Ref. [21], there is a large region of coexistence
between the orthorhombic and the monoclinic phase starting at approximately 6GPa. . In high
pressure X-ray measurements, a sizeable portion of the sample (>10-15%) must be in the
monoclinic phase to be detectable, while superconductivity needs only a small percolation
path. It is thus clear that superconductivity will show evidence of a very small portion of the
monoclinic phase much earlier in pressure. Thus, the observed phase diagram for SrFeAsF is
not in contradiction with the assumption that there is necessity of a monoclinic phase for the
observation of superconductivity. In other words, our measurements seem to indicate that the
orthorhombic phase cannot coexist with superconductivity
The structural measurements are shown on the left panel of Fig. 3. At room temperature the
evolution of the lattice parameters is smooth and there are no changes as have been reported
for other pnictides [22,23]. In particular, the FeAs tetrahedron is always irregular and pressure
increases its irregularity. It is interesting to note that the volume of the SrFeAsF compound
coincides with that of the CaFeAsF at room temperature for a pressure of 10GPa. In fact, both
compounds are electronically similar as the alkaline metal do not form bonds present at the
Fermi level. It can be assumed that it is the difference in size between the Sr and Ca ions that
regulates the lattice parameters, the separation between atoms and all the physical properties
that depend on them. A way to test this assumption is to shift the pressure axis corresponding
to the Sr compound by 10GPa. On the right panel of Fig. 3 we show the effect of such a rigid
regions are probably due to the coexistence of the monoclinic and orthorhombic distortions in
SrFeAsF, as discussed above.
Our measurements are not in complete agreement with those of Okada et al. [19]. They
measured only CaFeAsF and their phase diagram shows a brutal disappearance of TN at 4GPa,
which we do not observe. It is followed by the sharp appearance of superconductivity at
5GPa, more similar to what we observe. They claim that they follow TN by the derivative of
the resistance as we do, but they do not show the corresponding curves. Their work [20] on
LaAsFeO shows a similar brutal disappearance of TN at 12GPa, but with superconductivity in
all the pressure range, as we observe in SrFeAsF. The differences may be due to samples,
measurement conditions or analysis. Obviously more work on these 1111 materials is
necessary to clarify the actual phase diagram.
The phase diagrams that we have obtained are different from those reported for electron
doping of 1111 compounds, suggesting that, as is the case for cuprates, pressure is equivalent
to hole doping. We have performed calculations of the electronic band structure and of the
Lindhard susceptibility Xq at low and high pressures from the atomic positions determined
from our structural measurements, Fig. 4. Considering Xq, although its magnitude decreases
with pressure we do not find any change of position of the peak (as proposed in Ref. [24] for
Fe1+xTe) that, within the SDW scenario, should determine the magnetic ordering vector.
However, it does decrease with pressure indicating that the effects of nesting also decrease.
Thus, the reason why a monoclinic phase (reported in Ref. 21 ) appears is not due to a change
of nesting in our case and the question of the origin of the monoclinic phase remains open.
Unfortunately, a determination of the magnetic structure, by e.g. neutron diffraction, would be
very difficult with the state-of-the-art experimental means. In any case, it is clear that as,
above the minimum of TN, as TN increases, Tc decreases, implying that both are based on the
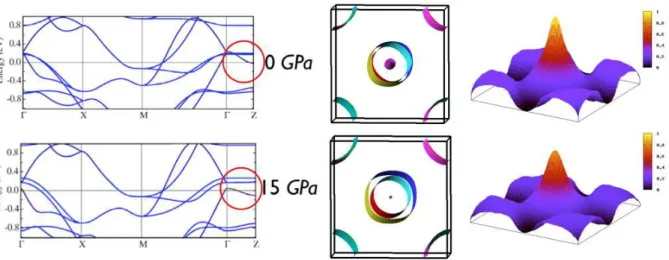
Evidence for hole-doping can be obtained from the evolution of the band structure and charge
density at different pressures. We see in Fig. 4, that there is a band along ΓZ that gradually
dips below the Fermi level as pressure is increased. It bonds the FeAs planes with the CaF
planes. As this band absorbs electrons, the Fe-As bands responsible for antiferromagnetism
and superconductivity are depleted, and the number of holes in them increases. This appears
clearly from the increase in size of the hole cylinders at Γ. A similar type of phenomena, i.e.
non-Fe bands depleting Fe bands under pressure, has been reported [23] in SmFeAsO0.81F0.19.
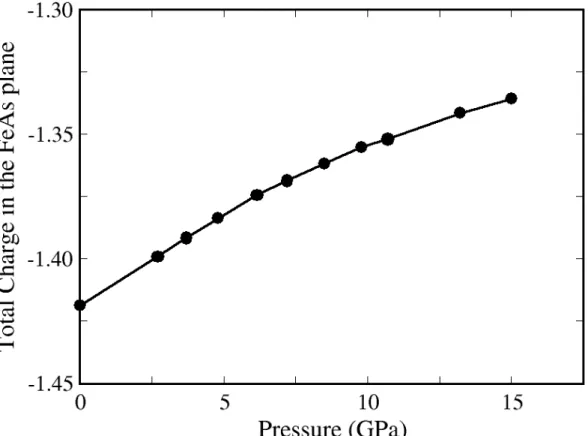
Another way to verify this effect is by doing the analysis of the Bader charges [25]
corresponding to those planes. In Fig. 5 we plot the corresponding total charge of the Fe-As
plane as a function of the applied pressure. As we can see the Fe-As planes become less
negative, i.e. doped with holes, with the application of pressure. The electrons flow to the
Ca-F planes, that become more negative.
We can now compare the existing 1111 electron-doped phase diagrams to the hole-doped
phase diagrams obtained by pressure. The main difference is that there is apparently
coexistence of superconductivity with the antiferromagnetic state, but not with the
orthorhombic distortion. It can be argued that the way in which we determine TN is not the
optimal one, but in the present state of matters it is the only available. As neutron diffraction
is out of question, magnetic susceptibility measurements under pressure are necessary to
confirm our results. The fact that a monoclinic to tetragonal transition has been observed at
high pressures (P=24GPa, Tmono→ tetra = 200K ) and that it apparently coincides with TN as
extrapolated from our results, implies that there is a change of symmetry due to inversion of
the order of appearance of the transition temperatures, as predicted theoretically[26].
However, the relation of orthorhombicity and/or monoclinicity with superconductivity
remains to be studied. Complete chemical hole doping phase diagrams are needed to clear up
D.C.F. gratefully acknowledges support from the Brazilian agencies CAPES and Cnpq. This
work was partially supported by the project TetraFer ANR-09-BLAN-0211 of the Agence
Nationale de la Recherche of France. R.W. is fellow of CONICET-Argentina and gratefully
acknowledges partial support from CONICET (Grant No. PIP 114-201101-00376) and
Figure1: (color online) Left Panel: Example of the evolution with pressure of the
temperature dependence of the electrical resistance of one sample of CaFeAsF. We
observe the gradual appearance of superconductivity above 5 GPa. Right panel: The
temperature derivative of the electrical resistance showing how we determine TN, the
transition temperature to the antiferromagnetic state. The dashed line marks its
evolution with pressure; above 18GPa there is no maximum in the curves for this
Figure2: (color online)
Left panel: Pressure phase diagram for CaFeAsF, different colors squares correspond to two different samples (TNgreen squares; Tc magenta squares). The triangles are taken
from Ref. 21 and correspond to structural measurements that determine the nature of the distortion at the pressure and temperature of each triangle: orthorhombic (triangles) or monoclinic (inverted triangles). Superconductivity apparently only appears when the orthorhombic distortion disappears.
Right panel: Pressure phase diagram for SrFeAsF, different color circles correspond to two different samples (TN green/brown circles; Tc blue circles). The triangles are taken
from Ref. 21 and indicate orthorhombic (triangles) or mixed orthorhombic-monoclinic (inverted triangles). Superconductivity appears at the lowest measured pressure, there is probably coexistence of the orthorhombic and the monoclinic phase at all pressures, enabling the appearance of superconductivity in the regions where the monoclinic phase has developed (see text).
Figure 3: (Color online)
Left panel: Evolution of the lattice parameters of Ca and Sr –FeAsF compounds with
pressure. We see that 10GPa separates both dependences, i.e. the volume of the Ca
compound becomes the same as that of the Sr compound at 10GPa.
Right panel: Scaling of the phase diagram for the Ca compound on the one of the Sr
compound by a rigid shift of 10GPa (upper scale, lower scale for the Sr compound). It is
clear that the evolution then coincides. However, superconductivity appears suddenly
for the Ca compound, which is probably due to no coexistence between the monoclinic
and the orthorhombic distortions, due to a sharper transition to the presumed
Figure 4: (Color online) Effect of pressure on the electronic band structures. Left panel:
Band structure of CaFeAsF at two different pressures. The band in magenta between Γ
and Z has a smaller Fe character (inside red circle). Central panel: As pressure
increases, the hole barrel at Γ , which is due to this band, is emptied at the expense of
the outer hole cylinder of full Fe character, i.e. there is an increase of hole doping of the
Fe bands under pressure. Right panel: real part of the susceptibility showing that the
Figure 5: Total charges corresponding to the FeAs planes in function of the applied
pressure: As pressure increases charges at these layers become less negative, so there is
an effective hole doping of them. Total charges are calculated as the summation of the
nuclear and the electronic Bader charges [25] corresponding to the Fe and As atoms.
For this task we have used the codes aim (that belongs to the Wien2k package) and critic
[27].
[1]Kamihara Y, Watanabe T, Hirano M and Hosono H 2008 J. Amer. Chem. Soc. 130 3296 [2]de la Cruz C, et al. 2008 Nature 453 899
[3]Maand F, and Lu Z-Y 2008 Phys. Rev. B 78 033111 [4 ] Huang Q, et al. 2008 Phys. Rev. B 78 054529 [5]Luetkens H, et al. 2009 Nat. Mat. 8 305
[6]Jun Zhao et al. 2008 Nat. Mat. 7 953
[7] Rotundu CR, et al. 2009 Phys. Rev. B 80 144517
[8] Wen H-H, Mu G, Fang L, Yang H and Zhu X 2008 EPL82 17009 [9]Wen H.H. et al. 2009 Physica C 469 894
[11] Núñez-Regueiro M and Acha C,in Studies of High Temperaure Superconductors, edited by N.V. Narlikar (Nova Science, New York, 1997), Vol. 24, p.203.
[12] Gooch M Lv, Lorenz B, Guloy A M and Chu C-W 2008 Phys. Rev. B 78 180508
[13] Zhu X, Yang H, Fang L, Mu G and Wen H-H 2008 Supercond. Sci. Technol. 21 105001 [14] Sanfilippo S et al. 1998 Phys. Rev. B, 61 R3800
[15]Hammersley AP, Svensson SO, Hanfland M, Fitch A.N. and Hausermann D. 1996 High
Pressure Res., 14 235
[16]Larson A C and Von Freele 1994 Los Alamos National Laboratory Report LUAR p 86-748 (1994); Toby B H 2001 J.Appl.Cryst. 34 210
[17]Blaha P, Schwarz K, Madsen G.K.H., Kvasnicka D and Luitz J 2001 in WIEN2K, An
Augmented Plane Wave and Local Orbitals Program for Calculating Crystal Properties,
edited by Schwarz K (Vienna, University of Technology, Austria, [18]Perdew J P, Burke K and Ernzerhof M 1996 Phys. Rev. Lett. 77 3865 [19]Okada H et al. 2011 Phys. Rev.B81 054507
[20]Okada H, Igawa K, Takahashi H, Kamihara Y, Hirano M, Hosono H, Matsubayashi K and Uwatoko Y 2008 J. Phys. Soc. Jpn 77 113712
[21]Mishra S K et al. 2011 Phys. Rev. B84 224513 [22] Garbarino G et al., 2011 EPL. 96, 57002 [23] Garbarino G et al. 2011 Phys. Rev. B84 024501
[24] Myung Joon Han and Savrasov S. Y. 2009 Phys. Rev. Lett. 103 067001
[25]R. F. W. Bader, 1990, Atoms in Molecules - A Quantum Theory, Oxford University Press, Oxford.
[26] Cano A, Civelli M, Eremin I and Paul I 2010 Phys. Rev. B82 020408
[27]A. Otero-de-la-Roza, M.A. Blanco, A. Martín Pendás and Víctor Luaña, 2009, Comp.Phys.Commun. 180, 157.