HAL Id: hal-02370673
https://hal-amu.archives-ouvertes.fr/hal-02370673
Submitted on 20 Feb 2020HAL is a multi-disciplinary open access archive for the deposit and dissemination of sci-entific research documents, whether they are pub-lished or not. The documents may come from teaching and research institutions in France or abroad, or from public or private research centers.
L’archive ouverte pluridisciplinaire HAL, est destinée au dépôt et à la diffusion de documents scientifiques de niveau recherche, publiés ou non, émanant des établissements d’enseignement et de recherche français ou étrangers, des laboratoires publics ou privés.
Distributed under a Creative Commons Attribution - NonCommercial - NoDerivatives| 4.0 International License
Anterior fissure, central canal, posterior septum and
more: New insights into the cervical spinal cord gray
and white matter regional organization using T1
mapping at 7T
Aurélien Massire, Henitsoa Rasoanandrianina, Maxime Guye, Virginie Callot
To cite this version:
Aurélien Massire, Henitsoa Rasoanandrianina, Maxime Guye, Virginie Callot. Anterior fissure, cen-tral canal, posterior septum and more: New insights into the cervical spinal cord gray and white matter regional organization using T1 mapping at 7T. NeuroImage, Elsevier, 2020, 205, pp.116275. �10.1016/j.neuroimage.2019.116275�. �hal-02370673�
Anterior fissure, central canal, posterior septum and more: new
insights into the cervical spinal cord gray and white matter regional
organization using T
1mapping at 7T
Aurélien Massire1,2,3, Henitsoa Rasoanandrianina1,2,3, Maxime Guye1,2, Virginie Callot1,2,3 1 Aix-Marseille Univ, CNRS, CRMBM, Marseille, France.
2 APHM, Hôpital Universitaire Timone, CEMEREM, Marseille, France.
3 iLab-Spine - Laboratoire international associé - Imagerie et Biomécanique du rachis, France - Canada.
Corresponding author:
Virginie CallotCRMBM-CEMEREM, UMR 7339, CNRS - Aix-Marseille Université, Faculté de Médecine 27, bd Jean Moulin, 13385 Marseille Cedex 5, France.
virginie.callot@univ-amu.fr
Tel: +33491388465. Fax: +33491388461.
Highlights:
300-µm in-plane resolution T1 maps of the human cervical cord at 7T using MP2RAGE. T1-based substructure delineations within WM and anterior / posterior GM.
In vivo MR visualization of anterior fissure, posterior septum and central canal. New regional parcellation within GM/WM and minimal CSF contamination.
Key words:
Spinal cord; Ultra-high field; T1 mapping; WM/GM substructures;Abstract:
T1 mapping lacks specificity toward a single particular biological feature, however it has the potential to discriminate spinal cord regional tissue organization and characterize tissue microstructural impairments occurring in neurodegenerative pathologies. In this exploratory work, T1 mapping of the cervical spinal cord with a 300-µm in-plane resolution was performed on fourteen healthy subjects at 7 Tesla, using the MP2RAGE sequence. Individual images from C1 to C7 vertebral levels provided a clear delineation of spinal cord anatomical details and substructures including motor columns within gray matter (GM) horns, anterior median fissure, central canal, ventral, lateral and dorsal white matter (WM) fasciculi, and posterior median septum. Group studies highlighted regional T1 differences between regions of interest so far hardly visible at lower spatial resolution. Two-dimensional averaged T1 maps and manual parcellation of GM and WM substructures were built based on these data. Benefiting from the very high spatial resolution achievable at ultra-high field for T1 mapping, this work contributes to improve the in vivo characterization of the cervical spinal cord. By allowing investigation within a wider range of functional regions, it also opens new perspectives for pathology diagnosis such as motor neuron disease, neuropathic pain or refined investigation of neurodegeneration.
1. Introduction
Ultra-high field (UHF) MRI (≥7T), which enables trading increased signal-to-noise ratio (SNR) for enhanced spatial resolution, is now capable of providing quality high-resolution images of the healthy and pathological cervical spinal cord (SC) (Barry et al., 2018; Dula et al., 2015; Massire et al., 2016; Sigmund et al., 2012). By reaching spatial resolutions at the scale of hundreds of microns, UHF MRI is also ready to investigate the emerging ‘in vivo histology’ research field of the SC, which aims at non-invasively characterizing tissue microstructure (Cohen-Adad, 2018). In this framework, there is currently a strong momentum on several quantitative MRI (qMRI) techniques applied to the cervical SC at UHF (Barry et al., 2018; Dula et al., 2016; Kogan et al., 2013; Massire et al., 2016, 2018), whose levels of details may allow investigating specific impairments within so-far invisible regions of interest (ROI), such as demonstrated in the brain for multiple sclerosis (Fartaria et al., 2019) or amyotrophic lateral sclerosis (Kwan et al., 2012).
On a special note, UHF MRI acquisitions could also drastically improve analysis tools such as SC templates and atlases, which are a central pillar for analysis standardization and reproducibility (Martin et al., 2017). These tools, so far exclusively built using conventional imaging at 3T (De Leener et al., 2018; Fonov et al., 2014; Taso et al., 2013, 2015) or interpolated from anatomical text-books (Lévy et al., 2015), could indeed further benefit from quantitative and higher spatial resolution MRI. With these elements in mind, using high-resolution longitudinal relaxation time (T1) mapping to probe the cervical SC at 7T would be of great interest, as spin-lattice relaxometry is an in vivo biomarker of tissue microstructure, with the ability to probe disease-related (Nürnberger et al., 2017; Steenwijk et al., 2016) or ageing-related (Knight et al., 2016) brain tissue changes.
Numerous MR techniques have already been used to perform T1 mapping in the cervical SC at clinical fields, including inversion recovery-based measurements (Battiston et al., 2018; Smith et al., 2008) or variable flip angle-based sequences (Lévy et al., 2018; Smith et al., 2008). For the latter however, it has been shown that the accuracy of in vivo measurements largely relies on taking into account existing B1+ inhomogeneities (Stikov et al., 2015), which are further amplified at UHF (Van de Moortele et al., 2005; Massire et al., 2018). In this framework, the Magnetization-Prepared Two Rapid Acquisition Gradient Echoes (MP2RAGE) (Marques et al., 2010; Marques and Gruetter, 2013) was developed as an extension of the MPRAGE (Mugler and Brookeman, 1990), one of the most common MR sequence used for anatomical T1-weighted imaging. MP2RAGE not only provides a so-called “uniform” T1-weighted image suitable for morphological analysis, but is also a fast T1 mapping sequence, recently used to investigate the healthy cervical SC at 3T (Rasoanandrianina et al., 2019) and at 7T (Massire et al., 2016). MP2RAGE appears
particularly well-suited for cervical SC UHF-imaging due to various assets, including: an adiabatic inversion radiofrequency pulse, robust gradient echo (GRE) readouts, an overall low Specific Absorption Rate (SAR), an intrinsic volume co-registration and an overall immunity to B1- bias (Marques et al., 2010). However, the maximal isotropic spatial resolution reported so far(Massire et al., 2016) at 7T for SC imaging was (0.7 mm)3. Although arguably sufficient to globally describe the gray matter (GM) and the white matter (WM) within the cervical SC, this resolution is still unsatisfactory to properly investigate the diverse and relevant tiny ROI within the GM horns and the WM fasciculi.
In this work, MP2RAGE 3D transverse acquisitions with a spatial resolution of 0.3x0.3x5 mm3 were acquired to further investigate SC GM and WM substructures. Multi-level averaged T1 maps were registered among all volunteers using a semi-automated post-processing pipeline to propose a regional parcellation enabling further T1 quantification and statistical analysis within specific ROI at each cervical level.
2. Material and methods
2.1. MR imaging and T1 maps processing
Fourteen healthy volunteers (6 men, 8 women; age 25±7 [18-43] years old, all right-handed) were included in this study. The protocol was approved by the local Ethics Committee and written consents were obtained from all subjects prior to MR examinations.
Experiments were performed using a whole-body actively-shielded research 7T MR system (Siemens Healthineers, Erlangen, Germany) equipped with a body gradient coil (SC72, 70 mT/m, slew rate 200 T/m/s). A customized eight-channel transceiver coil-array (Rapid Biomedical, Rimpar, Germany) was used for radiofrequency field transmission and reception. This coil-array, described in (Massire et al., 2016), consists of eight loops with a diameter of 8-10 cm, spread on a curved saddle surface cradling the subject’s neck. Following frequency adjustment, scout localizer and 2nd-order B0 shimming (into a restricted adjustment volume covering the cervical canal, from lower medulla to upper T1 vertebra, with ~40 mm transverse square-size), a sagittal 2D magnetization-prepared turbo-FLASH (MP-TFL) B1+ mapping sequence (Fautz et al., 2008) was used to set the transmit voltage. A sagittal 2D T2-weighted turbo spin echo (TSE) sequence was then acquired for further placement of the transverse slices perpendicular to the cord axis.
T1 mapping of the whole cervical SC was performed using transverse 3D MP2RAGE acquisitions, placed as perpendicular as possible to the cord to minimize partial volume effect (PVE) contamination in the transverse plane (see Figure 2). For 10 volunteers, two separate MP2RAGE acquisitions aligned to the upper/lower cervical segments respectively
were necessary to adequately sample the cervical cord with minimal PVE contamination; whereas only a single acquisition was necessary for 4 volunteers, with remarkably straight cords. Ultra-high resolution transverse imaging was also performed with a 2D multi-echo T2 *-weighted GRE sequence (7 slices positioned perpendicular to the cord at each level, from C1 to C7, centered mid-vertebra), with the objective to reslice MP2RAGE volumes. Main MR sequence acquisition parameters are provided in Table 1. The total acquisition time, including all system adjustments, was 30 minutes (for 2 MP2RAGE acquisitions).
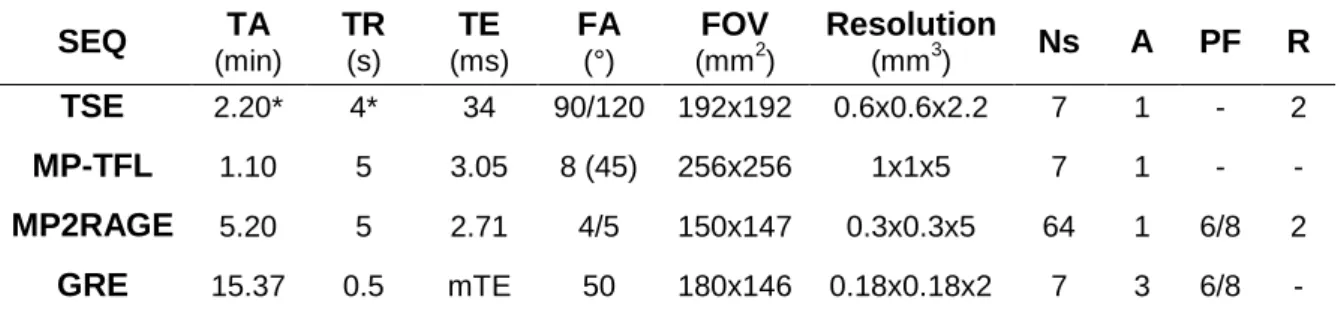
Table 1. Sequence parameters for MRI acquisitions on healthy volunteers used in this study.
SEQ TA (min) TR (s) TE (ms) FA (°) FOV (mm2) Resolution (mm3) Ns A PF R TSE 2.20* 4* 34 90/120 192x192 0.6x0.6x2.2 7 1 - 2 MP-TFL 1.10 5 3.05 8 (45) 256x256 1x1x5 7 1 - - MP2RAGE 5.20 5 2.71 4/5 150x147 0.3x0.3x5 64 1 6/8 2 GRE 15.37 0.5 mTE 50 180x146 0.18x0.18x2 7 3 6/8 - SEQ: sequence; TA: acquisition time; TR: repetition time (*triggered acquisitions); TE: echo time (multiple TE: 5.2/9.4/13.6/17.9 ms); FA: flip angle; FOV: field of view; Ns: number of slices; A: number of averages; PF: partial Fourier factor; R: Parallel imaging acceleration factor. Additional specific parameters for the MP2RAGE sequence were: inversion times 0.7/2.4s and ‘LIN/PAR swap’ option enabled (i.e. phase- and partition-encoding directions were exchanged to speed up the acquisition).
To compensate for imperfect radiofrequency excitation at 7T caused by B1+ variations along the SC (Massire et al., 2018) and avoid subsequent T1 estimation bias (Marques et al., 2010), an offline B1+-inhomogeneity correction implemented in MATLAB (The Mathworks, Natick, MA, USA) and described in (Massire et al., 2016), was first performed using the acquired B1+ maps. T1 maps were subsequently denoised using a block-matching and filtering algorithm (BM4D) (Maggioni et al., 2013) to compensate for inherent noise propagation within the MP2RAGE uniform image ratio (see Appendix 2 of Marques et al., 2010). For further processing, 3D T1 volumes were resliced at each vertebral level (C1-to-C7), using the c3D reslice-identity function (ITK-SNAP, UPENN, PA, USA) and the GRE images as reference, leading to a total of 7 slices per subject. When 2 volumes were acquired (in case of pronounced SC curvature), reslicing was performed using the most adequate slab (usually 1st slab for C1 to C4 and 2nd slab for C5 to C7, see Figure 2).
2.2. Averaged T1 maps post-processing
For each subject and each axial slice, the SC was semi-automatically segmented (Figure 1a, step 1) using the PropSeg function (De Leener et al., 2014) from the Spinal Cord
Toolbox (De Leener et al., 2017). Segmentations of the GM, the WM and the central canal
were performed manually for each individual dataset by the same operator using the viewer module of the FSL package (FSL v4.1.3, FMRIB, Oxford, UK) (Figure 1a, step 2). When visible, anterior fissure and posterior septum were excluded from WM segmentation.
The registered averaged T1 maps were generated using an iterative process. First, an oversampled version (0.18x0.18 mm² in-plane resolution) of the T2*-weighted AMU40 template (Taso et al., 2015) was set as the initial reference target for the first iteration (Figure 1a, step 3). Then, the registration steps for each of the 7 slices of each subject were as follows:
- The barycenters of individual and AMU40 template SC segmentation masks were aligned by minimizing their Euclidian distance, using MATLAB and FSL FLIRT (Jenkinson and Smith, 2001).
- Two-dimensional segmentation masks and corresponding T1 maps were registered to AMU40 with an affine transformation (3 degrees of freedom: 2 translations, 1 rotation) using FSL FLIRT.
- T1 maps were subsequently non-linearly (NL) registered to AMU40 using ANTs SyN (Avants et al., 2008) with the ‘mutual information’ metric and ‘BSplines’ interpolation. - Registered T1 maps derived from the n=14 subjects were then averaged.
Second, these averaged 2D T1 maps were used as a ‘study-specific T1 template’ to be targeted for subsequent iterations of individual data registration. To generate a refined reference target at each iteration, the above-mentioned process was repeated using the ‘sum-of-squares differences’ metric for the NL registration (Figure 1a, step 4). This metric enabled a smooth refinement of the reference ‘study-specific T1 template’ target at each iteration, while preserving butterfly-shaped GM individual variability. A satisfactory registration convergence was obtained after three iterations. The ‘cross-correlation’ metric was then chosen for a fifth iteration (Figure 1a, step 5) to obtain a ‘study-specific T1 template’ with sharper GM/WM delineation.
Finally, all individual images and WM/GM segmentations masks were registered to this last version of the ‘study-specific T1 template’ and averaged to build 2D C1-to-C7 averaged T1 maps (in seconds) and corresponding WM/GM probability maps (probability for each pixel to belong to WM, GM or central canal, ranging from 0 to 100 %) (Figure 1a, step 6).
Figure 1: a: Averaged T1 maps processing, with step numbers indicated in circles. Step1: individual 2D T1 maps segmentation using PropSeg. Step2: manual segmentations of GM (red), WM (blue) and central canal (green). Step3: first iteration of individual T1 maps affine and non-linear registrations to the oversampled AMU40 template, using the ‘mutual information’ metric. Step4: iterative (n=3) affine and non-linear registrations of individual T1 maps to the ‘study-specific T1 template using the ‘sum-of-squares differences’ metric. Step5: affine and non-linear registrations of individual T1 maps using the ‘cross-correlation’ metric (5th iteration). Resulting averaged T1 maps were used as targets for subsequent iterations. Step6: final registrations (‘cross-correlation’ metric) of individual T1 maps and corresponding segmentations to build averaged T1 maps and enable group studies, as well as corresponding GM/WM/CC probability maps (probability for each pixel to belong to WM, GM or central canal). b: Manual parcellation of SC substructures based on histological schematic (figure adapted from Altman and Bayer, 2001) and subsequently adjusted using both probability maps and measured T1 values.
2.3. Cervical spinal cord manual parcellation
Manual parcellation of the SC (Figure 1b) was performed at each cervical level on the C1-to-C7 averaged T1 maps, based on histological schematic (figure adapted from Altman and Bayer, 2001) and subsequently adjusted using both probability maps and measured T1 value distributions. In details, as only C4 cervical level regional organization was reported in (Altman and Bayer, 2001), ROI in other levels were delineated by extrapolating their global spatial distribution, while ensuring compliance with probability maps and maintaining relatively homogeneous T1 value distributions for each ROI. More precisely, at the GM/WM interface, only pixels with a probability of belonging to WM superior to 90% were selected for parcellation (this high threshold could be afforded thanks to high in-plane resolution). At the WM/CSF (cerebrospinal fluid) interface, a 2D erosion of the WM segmentation probability maps was performed to further avoid PVE contamination (90%, 1 pixel removed on average). A more conservative probability of 60% was selected for GM parcellations, as GM is a smaller structure.
The WM was segmented in several fasciculi corresponding to a morphological subdivision (see Figure 1-80 from Altman and Bayer, 2001). Dorsal WM was separated in three regions: the posterior median septum, the gracile fasciculus and the cuneate fasciculus (predominantly composed of ascending sensory fibers from the lower and upper body, respectively). Lateral WM was separated in three fasciculi: the superior lateral fasciculus (containing the descending corticospinal, reticulospinal and rubrospinal tracts), the intermediate lateral fasciculus (containing several heterogeneous tracts including the tegmentospinal tracts) and the inferior lateral fasciculus (containing mainly the ascending spinothalamic tracts). Because of their narrowness, the marginal and circumferential fasciculi were not considered in this parcellation due to probable PVE contamination. Ventral WM was separated in two fasciculi: the ventral fasciculus (containing the ascending spinocephalic tracts and descending vestibulospinal tracts) and the ventromedial fasciculus (containing medial longitudinal, tectospinal and ventral corticospinal tracts).
Gelatinous substance was delineated as the apex of GM dorsal horns. Ventral GM horns were segmented into two (C1 to C3) or three (C4 to C7) panels: medial (adjacent to the central canal), central, and lateral (only for C4 to C7). Each of these three panels contains two sectors having different functional significances (see Figure 1-51 from Altman and Bayer, 2001), which were not considered here. Lastly, the central canal, which was very well depicted in all images due to its very high T1 value, was also delineated.
Left and right substructures were considered as a unique sub-region. As a result, the total number of parceled ROI was 14 per SC level (13 for C1-to-C3 levels).
2.4. T1 regional evaluations and statistical analyses
Mean T1 ± in-ROI standard deviation values were reported at each vertebral level by averaging voxels included in the different ROI of the registered averaged T1 map.
Mean T1 ± inter-subject standard deviation values were also evaluated among all healthy volunteers for each ROI. Statistical analyses were performed with JMP14 (SAS institute, Cary, NC, USA). Multiple comparisons for SC levels and ROI were carried out using a two-way analysis of variance (ANOVA) followed by five independent Steel-Dwass all pairs non-parametric tests. These five tests were respectively aimed to highlight regional organization differences: 1) within lateral and ventral WM, 2) within dorsal WM, 3) around dorsal GM horns, 4) within ventral GM, and 5) between central canal and GM. For all tests, p-values less than 0.05 were considered as statistically significant.
To evaluate the impact of increased resolution, additional comparisons were finally performed between: 1/ the herein proposed 7T-based parcellation and probability maps, and 2/ the WM tracts atlas (Lévy et al., 2015) and the AMU40 GM/WM probability maps (Taso et al., 2015), both built from state-of-the-art 3T-based templates (Fonov et al., 2014; Taso et al., 2013). These atlases were co-registered to the averaged T1 maps and used to evaluate T1 (mean ± in-ROI standard deviation) within comparable ROI (whole GM/WM, ventromedial and gracile WM tracts), with 50% probability threshold and outer erosion using whole cord segmentation mask.
3. Results
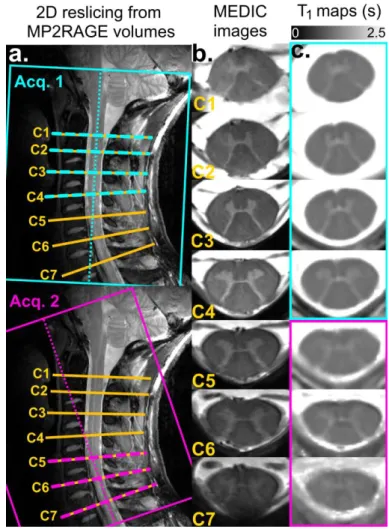
Examples of images acquired at 7T on one healthy volunteer are shown in Figure 2. Transverse GRE slice positions, from C1 to C7 cervical levels, are illustrated on sagittal TSE images (Figure 2a, yellow). MP2RAGE 1st (cyan) and 2nd (purple) volumes, aligned to the upper/lower cervical segments respectively, are indicated as well. High-resolution T2 *-weighted MEDIC images at each level are shown in Figure 2b. B1+-corrected, denoised, resampled T1 maps extracted from the two MP2RAGE volumes are shown in Figure 2c. Due to high T1 value of the CSF, the anterior median fissure and posterior septum, as well as the central canal could be well depicted on these T1 maps, whereas they could hardly be seen on T2*-weighted images. Nerve roots are visible on MEDIC images and not on the presented T1 maps, but only because of the T1 scale bounded here to a maximum of 2.5 s. For this volunteer, the butterfly-shaped GM on the T1 map at the C5 level is slightly blurred due to through-slice PVE contamination, as C5 was at the level of cervical SC maximum curvature. This T1 map could nevertheless be used for further processing. In total, 11/98 slices with
artifacts were discarded (i.e. 11%, spread over 8/14 subjects). Seven of these slices were discarded at C7 level, due to severe PVE contamination and despite MP2RAGE volume tilting. Slice discarding criteria were based either on visual inspection or on cord segmentation critical failure.
Figure 2: MR imaging results on healthy volunteer #8. a: MP2RAGE first (cyan) and second (purple) volume orientations are indicated on sagittal TSE images. b: High-resolution transverse anatomical imaging (MEDIC (Held et al., 2003): sum of squares of GRE) was used to reslice T1 maps, with C1-to-C7 2D slices (yellow) indicated on TSE images. c: T1 maps in seconds, with B1+-correction, denoising and resampling to 0.18x0.18x2 mm3 resolution. To minimize through-slice PVE contamination, 2D T1 maps from C1 to C4 were extracted from the 1st volume, whereas T1 maps from C5 to C7 were extracted from the 2nd volume (see corresponding colors).
Figure 3a presents a set of individual T1 maps, along with the averaged T1 maps (Figure 3b), registered to the common reference for all cervical levels. Anatomical details and regions with specific T1 values visualized on individual maps could also be identified on the
averaged maps. The probabilistic maps of GM (red-yellow), WM (blue-light blue) and central canal (CC, green) obtained when registering all manual GM/WM/CC segmentation masks are shown in Figure 3c. Manually-segmented substructures in the parcellation of the SC are listed in Figure 3d legend in numerical order. The central canal can be clearly delineated, with a measured area of 0.57±0.10 mm2 on average over the 7 levels (corresponding to a mean circular diameter of 0.86 mm).
Figure 3: Colored T1 maps, probability maps and parcellation maps at all cervical levels registered in the reference space (interpolated spatial resolution: 0.18x0.18 mm2). a: Individual registered T1 maps (in seconds) of healthy volunteer #10 (plasma colormap). b: Averaged T1 maps (in seconds, the number of averaged maps is displayed for each level). c: Corresponding probabilistic maps of GM (red-yellow), WM (blue-light blue) and central canal (CC, green), expressed in %. d: Manual parcellation of the SC substructures: 1. ventromedial WM fasciculus, 2. ventral WM fasciculus, 3. inferior, 4. intermediate and 5. superior WM lateral fasciculi, 6. cuneate and 7. gracile WM dorsal fasciculi, 8. central septum, 9. dorsal GM horns, 10. gelatinous substance, 11. lateral (for C4-C7 only), 12. central and 13. medial ventral GM horns, and 14. central canal.
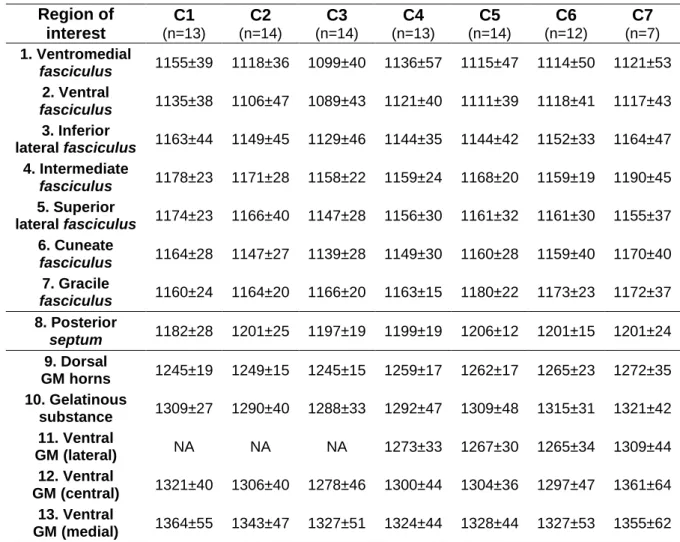
Means and in-ROI standard deviations T1 values (in ms) measured for all ROI within the averaged T1 maps are reported in Table 2. The number of pixels contained in each ROI per level varied between 14 (central canal) and 361 (superior lateral fasciculus).
Table 2: Mean T1 ± in-ROI standard deviation (in ms) measured in manually delineated SC substructures from C1 to C7 levels, in the averaged T1 maps.
Region of interest C1 (n=13) C2 (n=14) C3 (n=14) C4 (n=13) C5 (n=14) C6 (n=12) C7 (n=7) 1. Ventromedial fasciculus 1155±39 1118±36 1099±40 1136±57 1115±47 1114±50 1121±53 2. Ventral fasciculus 1135±38 1106±47 1089±43 1121±40 1111±39 1118±41 1117±43 3. Inferior lateral fasciculus 1163±44 1149±45 1129±46 1144±35 1144±42 1152±33 1164±47 4. Intermediate fasciculus 1178±23 1171±28 1158±22 1159±24 1168±20 1159±19 1190±45 5. Superior lateral fasciculus 1174±23 1166±40 1147±28 1156±30 1161±32 1161±30 1155±37 6. Cuneate fasciculus 1164±28 1147±27 1139±28 1149±30 1160±28 1159±40 1170±40 7. Gracile fasciculus 1160±24 1164±20 1166±20 1163±15 1180±22 1173±23 1172±37 8. Posterior septum 1182±28 1201±25 1197±19 1199±19 1206±12 1201±15 1201±24 9. Dorsal GM horns 1245±19 1249±15 1245±15 1259±17 1262±17 1265±23 1272±35 10. Gelatinous substance 1309±27 1290±40 1288±33 1292±47 1309±48 1315±31 1321±42 11. Ventral GM (lateral) NA NA NA 1273±33 1267±30 1265±34 1309±44 12. Ventral GM (central) 1321±40 1306±40 1278±46 1300±44 1304±36 1297±47 1361±64 13. Ventral GM (medial) 1364±55 1343±47 1327±51 1324±44 1328±44 1327±53 1355±62
14. Central
canal 1477±27 1437±36 1420±41 1465±72 1460±50 1454±51 1503±51
Figure 4 illustrates the results of the five statistical multiple comparison non-parametric tests with regards to T1 regional differences performed at the C3 level (for the sake of clarity, results from other levels are summarized in Table 3). Statistically-significant differences were reported between ventromedial/ventral WM fasciculi and lateral WM
fasciculi (test #1, Figure 4a). However, no significant differences were reported between
lateral tracts. Results showed significant T1 differences between dorsal GM horns (usually heavily impacted by PVE contamination at lower resolution) and surroundings lateral and dorsal WM, as well as gelatinous substance and ventral GM (test #3, Figure 4b). No significant differences between cuneate and gracile dorsal WM tracts were observed (test #2, Figure 4c). Still, the increased T1 value enabled a precise delineation of the central posterior
septum. Significant differences were also found between medial and central/lateral regions of
the ventral GM horns (test #4, Figure 4d). Finally, the central canal exhibits significantly higher T1 values than the medial GM (test #5, Figure 4e).
Figure 4: T1 distributions (n=14 volunteers, with reported minimum, 25%-50%-75% quartiles, maximum values) and T1 regional variations at the C3 level (5 Steel-Dwass non-parametric tests, p-values <0.05 considered significant). a: Regional variations among ventral and lateral WM fasciculi (*: significant difference reported with respect to tract #2, **: significant differences reported with respect to tract #1 and #2, see table 3 for detailed p-values). b: Regional variations between dorsal GM horns and surroundings WM fasciculi. c: Regional
variations among dorsal WM fasciculi and posterior septum. d: Regional variations within ventral GM horns. e: T1 value difference between medial GM and central canal.
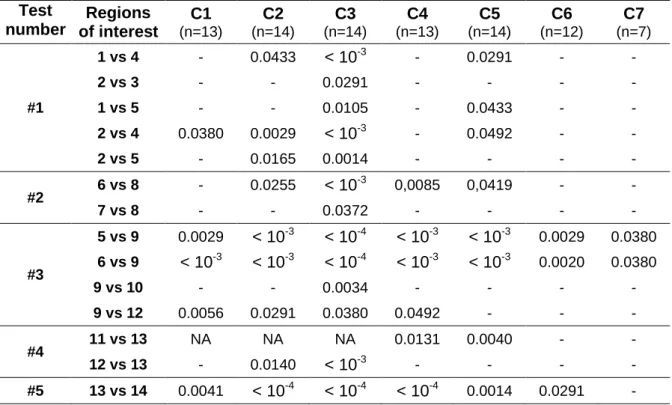
Table 3 summarizes the results of the five Steel-Dwass all pairs non-parametric tests for all cervical levels, with p-values reported only when a regional statistically significant difference was found. Note that GM and WM ROI systematically presented strong statistically significant T1 differences, which were consequently not reported in Table 3 to limit the number of rows (for example: T1 difference between 2. ventral WM fasciculi versus 12. central GM were always significant). Absences of statistical differences between neighboring ROI were not reported either to limit the size of the table (for example differences between 1. ventral and 2. ventromedial WM fasciculus were always insignificant).
Table 3: Regional statistical differences for all cervical levels. P-values are reported when a statistically significant difference between two ROIs was found. See Figures 3 and 4 for ROI labeling. Test number Regions of interest C1 (n=13) C2 (n=14) C3 (n=14) C4 (n=13) C5 (n=14) C6 (n=12) C7 (n=7) #1 1 vs 4 - 0.0433 < 10-3 - 0.0291 - - 2 vs 3 - - 0.0291 - - - - 1 vs 5 - - 0.0105 - 0.0433 - - 2 vs 4 0.0380 0.0029 < 10-3 - 0.0492 - - 2 vs 5 - 0.0165 0.0014 - - - - #2 6 vs 8 - 0.0255 < 10 -3 0,0085 0,0419 - - 7 vs 8 - - 0.0372 - - - - #3 5 vs 9 0.0029 < 10-3 < 10-4 < 10-3 < 10-3 0.0029 0.0380 6 vs 9 < 10-3 < 10-3 < 10-4 < 10-3 < 10-3 0.0020 0.0380 9 vs 10 - - 0.0034 - - - - 9 vs 12 0.0056 0.0291 0.0380 0.0492 - - - #4 11 vs 13 NA NA NA 0.0131 0.0040 - - 12 vs 13 - 0.0140 < 10-3 - - - - #5 13 vs 14 0.0041 < 10-4 < 10-4 < 10-4 0.0014 0.0291 -
Figure 5 illustrates and Table 4 reports the evaluation of T1 values measured within the averaged T1 maps (all volunteers, all levels merged) using either AMU40/WM tracts atlas or the herein proposed 7T-based segmentation. Reported mean T1 values were relatively similar for whole GM (red), whole WM (blue), ventromedial (green) and gracile (yellow) WM tracts, but in-ROI standard deviations were 30% higher for whole GM and WM when using AMU40 probability maps.
Table 4: Mean T1 ± in-ROI standard deviation values (in ms) measured within the averaged T1 maps, for whole GM/WM; ventromedial and gracile WM tracts, using either the 7T-based probability maps/manual parcellation, or the 3T-based AMU40 probability
maps/WM tracts atlas (threshold 50%).
Figure 5: Illustrations of differences between the herein proposed 7T-based segmentation and the 3T-based state-of-the-art AMU40/WM tracts segmentation, overlaid on C2/C4 T1 maps (whole GM: red, whole WM: blue, gracile WM tract: yellow, ventromedial WM tract: green, threshold 50%).
4. Discussion:
Benefiting from a native in-plane resolution of (300-µm)2, the T1 maps obtained at 7T in this study using the MP2RAGE technique enabled a refined visualization of anatomical details and estimation of T1 values within SC substructures so-far hardly visible at 3T. After an oversampling to (180-µm)2 in-plane resolution and iterative registrations to a common target (Figure 1), a preliminary regional parcellation was manually created at each cervical level of the SC.
It is first worth noting that the most common technical challenges of UHF MRI, including amplified static (B0) and radiofrequency (B1+) field inhomogeneities, as well as SAR increase, are present when imaging the cervical SC. High-resolution acquisitions required to explore the cord also imply longer scan times and increased sensitivity to motion. In this context, GRE-based MR sequences, such as the MP2RAGE, with careful B0 shimming and offline B1+ inhomogeneities corrections to improve the sequence overall performance, could become the workhorse of UHF SC structural imaging. The MP2RAGE (Marques et al., 2010) sequence employed in this study indeed allowed fast 3D T1 mapping of the whole cervical
ROI 7T-based 3T-based Whole GM 1306±62 1296±80 Whole WM 1228±163 1264±214 Ventromedial fasciculus 1122±49 1109±47 Gracile fasciculus 1168±24 1178±26
SC, outperforming inversion recovery (Smith et al., 2008) and variable flip angle (Lévy et al., 2018) approaches in terms of acquisition time at a given spatial resolution, while ensuring high-quality images (Figures 2-3). To the best of the authors’ knowledge, MP2RAGE acquisitions are usually run with an isotropic spatial resolution (Hagberg et al., 2017; Marques et al., 2010; Marques and Gruetter, 2013; Massire et al., 2016; Metere et al., 2017; Rasoanandrianina et al., 2019). In this work, spatial coverage was purposely set wider than necessary by adding more encoding steps in the z-direction, so as to ensure a sequence SNR relatively similar to previously reported acquisitions with 0.7 mm3 isotropic resolution (Massire et al., 2016). Since the in-plane acquisition matrix was significantly higher than the number of slices, phase- and partition-encoding directions were swapped in the looping structure of the sequence, allowing a drastic reduction of the total acquisition time to less than 6 minutes per volume. These sequence parameter changes did not hamper T1 estimation (Marques et al., 2010), which mainly depends on: 1/ inversion time values, 2/ flip angle values and 3/ turbo-FLASH train length. In a previous study (Massire et al., 2016), B1+ corrected MP2RAGE-based T1 mapping reproducibility and accuracy were demonstrated satisfactory at 7T (coefficients of variation below 2%, Pearson correlation of 0.99 with inversion-recovery) with an isotropic spatial resolution. The same behavior is expected for the herein presented protocol, but additional dedicated experiments are required to provide a final conclusion. Lastly, due to the MP2RAGE nature (i.e. ratio of images), noise is propagated in T1 maps (Marques et al., 2010). In this study, T1 maps were consequently denoised with the BM4D algorithm (Maggioni et al., 2013). Quantitative comparisons between T1 maps before and after denoising did not reveal any abnormalities, however additional work could be pursued in the future to assess precisely the influence of this denoising method on T1 quantification.
Spinal cord natural curvature was a limitation in this study, since two transverse MP2RAGE slabs were not always sufficient to adequately sample all cervical levels with minimal through-plane PVE. Indeed, most of the discarded slices were rejected because of severe through-slice PVE contamination, mainly at lower cervical levels. To minimize this constraint, subjects should be positioned upright as much as possible without impacting their comfort. A reduction of the slice thickness to 4 mm (or even to 3 mm) was technically possible to further reduce PVE contamination, but at the expense of decreased SNR. In this exploratory study, 2D transverse slices were always extracted at mid-vertebra to ensure a consistency of slice positioning across volunteers. A more rational way would have consisted in selecting true spinal levels (Cadotte et al., 2015), more related to microstructural organization of the SC than vertebral levels. However, this would have required knowledge of these level positions for each volunteer, using nerve roots insertions as a visual guidance. While feasible, this approach was not endeavored in this study. Future work could also focus
on using the whole 3D data, which was not fully exploited in this work. To do so, straightening of SC data (De Leener et al., 2017; Fonov et al., 2014) and stitching of MP2RAGE volumes are both required, with specific caution where the cord curvature causes significant through-slice PVE contamination.
In this exploratory work, the description of a single cervical level (C4) based on histology (Altman and Bayer, 2001) was used to guide the entire manual parcellation from C1 to C7 levels, assuming a global conservation of the WM topology. This approximation however appears consistent with the current anatomical knowledge of the SC internal organization, as spinal pathways keep the same somato-topographical organization in the axial plane from C1 to C8 SC levels (Pritchard and Alloway, 1999). Moreover, this parcellation was empirically guided by measured T1 values (obtained in-ROI standard deviations were around 5% of mean T1 values, whereas inter-subjects were around 10% of mean T1 values). Yet as only one rater performed this parcellation, additional work could be endeavored in the future to assess consistency and reproducibility between independent raters. Here, WM was purposely parceled according to a morphological classification (Altman and Bayer, 2001), as separating ascending and descending tracts (functional subdivision) in the ventromedial, ventral, intermediate and circumferential regions would have been still very challenging at this spatial resolution. Nevertheless, morphological/functional classifications in (Altman and Bayer, 2001) were fairly comparable for several tracts of interest (e.g. gracile and cuneate fasciculi / lower and upper spinolemniscal tracts; superior lateral fasciculi / lateral corticospinal and rubrospinal tracts). Then, depending on the cervical level, ventral GM was separated into two or three panels (medial, central and lateral), with each panel roughly corresponding to different motor columns innervating specific muscle groups (Altman and Bayer, 2001). This latter segmentation, which has not been presented so far, could open up new perspectives to refine the characterization of specific impairments in motor neuron diseases, such as in amyotrophic lateral sclerosis (Rasoanandrianina et al., 2017). In the future, T1 mapping could be combined with additional MR contrasts, such T2* mapping (Massire et al., 2016), diffusion tensor imaging (Massire et al., 2018) or Chemical Exchange Saturation Transfer (Dula et al., 2016), and processed with clustering algorithms (Hudedagaddi and Tripathy, 2017; Taso et al., 2017) to provide richer, and presumably more accurate, SC cyto- and myelo-architecture probabilistic atlases from C1 to C7. Lastly, comparisons with histology would be required to 1) further assess the accuracy of the herein presented parcellation, with a specific attention in postmortem samples preparation to keep intact the cerebrospinal fluid environment and 2) confirm its usefulness and ability to detect pathological changes.
Measured mean T1 values (Figure 3, Table 2) were slightly inferior (about -2%) to previously reported values using the same sequence (Massire et al., 2016). T1 variations for
whole WM/GM between levels were not found significant, with a slight decrease observed, consistent with previous findings (Battiston et al., 2018; Massire et al., 2016; Rasoanandrianina et al., 2019). As for regional differences at a given cervical level (Figure 4, Table 3), high resolution T1 mapping enabled investigating the ventromedial/ventral WM
fasciculi, with lower T1 values compared to lateral WM. Yet no significant differences were found between lateral WM fasciculi, nor between dorsal WM tracts, despite different axon sizes and myelination previously reported by the literature (Duval et al., 2015, 2017; Taso et al., 2016). Therefore, T1 alone does not looks specific enough to discriminate these WM tracts based on their microstructural differences. Interestingly, the increased in-plane resolution allowed identifying statistical T1 differences between GM areas (medial and lateral, as well as ventral/dorsal), which should now be applied to pathological cases to further evaluate their clinical relevancy with regards to specific muscular deficits.
The gain of in-plane resolution of the 7T MP2RAGE acquisitions was also beneficial for the delineation of different ROI filled with CSF so far not considered on conventional analysis. On a special note, the increased T1 value of the central canal allowed a clear visualization of this anatomical structure, which was not visible on T2*-weighted images (Figure 2), even with ultra-high resolution (180-µm)2. The improved delineation of this structure could be relevant when studying syringomyelia formation (Tanghe, 1995) or central canal occlusion (Zhang et al., 2012) for instance. In addition, high-resolution T1 maps showed how the SC consists of two hemispheres by localizing the posterior central septum and the anterior median fissure, showing an original benefit of SC T1 mapping at UHF. The ability to exclude the voxels from these two regions would likely decrease PVE contamination in multiparametric quantitative analyses within anterior and posterior WM. Here, our comparisons on T1 evaluation within the gracile and ventromedial WM tracts, affected by the posterior septum and the anterior fissure respectively (Figure 5), showed that reported T1 values were comparable between 3T- and 7T-based segmentations (Table 4) when using 50%-threshold. Similar T1 mean values were also found for whole GM. While surprising at first, this is explained by two adversarial contamination effects occurring for the 3T-based segmentation, caused by voxels belonging either to the central canal or to the GM/WM interface, and illustrated by a 30% increase of the in-ROI standard deviation. As a result, the gain of in-plane resolution at 7T indeed appeared beneficial for whole GM segmentation and quantification. As for whole WM, mean T1 value difference was 3% (+36 ms) between segmentations, with 30% higher standard deviation for AMU40. While inconsequential at first glance, this should be put into perspective with the absolute difference in T1 at 7T between GM and WM, of about 100 ms. These higher mean and standard deviation could both be attributed to residual PVE contamination from the CSF at the outer border of the cord and from the anterior fissure (see level C4, Figure 5).
To conclude, the proposed parcellation could complement state-of-the-art SC segmentation to improve the delineation of substructures of interest within WM and GM, by avoiding partial volume effect contamination from so far unseen regions filled with cerebrospinal fluid (e.g. anterior fissure, posterior septum and central canal). This exploratory work constitutes proof of concept that need to be further improved to be considered as a full template-based segmentation approach. In the future, it is very likely that the integration of 7T-based segmentations and atlases into SC post-processing toolboxes will enhance the accuracy and reproducibility of studies reporting quantitative changes within GM/WM ROI of the SC in pathological context (Dula et al., 2016).
5. Conclusion
T1 mapping of the human cervical spinal cord reaching a native (300-µm)2 in-plane resolution was performed at 7T using the MP2RAGE sequence. The obtained T1 maps provided exquisite anatomical details and clear delineation of SC substructures. A semi-automated post-processing pipeline enabled a manual parcellation using in vivo 7T data, as well as group studies with T1 evaluation within specific ROI from C1 to C7. Overall, this study provides an unprecedented in vivo characterization of the human healthy spinal cord, at the level of clinically-relevant sub-regions, such as the anterior/posterior GM horns and the ventromedial WM tracts, while minimizing PVE contamination from CSF within the cord, such as in the anterior median fissure, posterior median septum and central canal.
6. Acknowledgments:
None of the authors have potential conflicts of interest to disclose. This work was supported by the following funding sources: 7T-AMI ANR-11-EQPX-0001, A*MIDEX-EI-13-07-130115-08.38-7T-AMISTART, Fondation ARSEP (Fondation pour l’Aide à la recherche sur la Sclérose en Plaques), and CNRS (Centre National de la Recherche Scientifique). The authors would like to thank Manuel Taso for valuable discussions related to MP2RAGE acquisitions and post-processing; Tobias Kober for MR sequence support (Siemens Healthcare, MP2RAGE sequence); and Véronique Gimenez, Claire Costes and Lauriane Pini for study logistics. This work was performed within a laboratory member of France Life Imaging network (grant ANR-11-INBS-0006).
7. References:
Altman, J., Bayer, S.A., 2001. Development of the human spinal cord, Oxford University Press. ed. Avants, B.B., Epstein, C.L., Grossman, M., Gee, J.C., 2008. Symmetric diffeomorphic image
registration with cross-correlation: Evaluating automated labeling of elderly and neurodegenerative brain. Med. Image Anal., Special Issue on The Third International Workshop on Biomedical Image Registration – WBIR 2006 12, 26–41. https://doi.org/10.1016/j.media.2007.06.004
Barry, R.L., Vannesjo, S.J., By, S., Gore, J.C., Smith, S.A., 2018. Spinal cord MRI at 7T. NeuroImage 168, 437–451. https://doi.org/10.1016/j.neuroimage.2017.07.003
Battiston, M., Schneider, T., Prados, F., Grussu, F., Yiannakas, M.C., Ourselin, S., Gandini Wheeler-Kingshott, C.A.M., Samson, R.S., 2018. Fast and reproducible in vivo T1 mapping of the
human cervical spinal cord. Magn. Reson. Med. 79, 2142–2148. https://doi.org/10.1002/mrm.26852
Cadotte, D.W., Cadotte, A., Cohen-Adad, J., Fleet, D., Livne, M., Wilson, J.R., Mikulis, D., Nugaeva, N., Fehlings, M.G., 2015. Characterizing the Location of Spinal and Vertebral Levels in the Human Cervical Spinal Cord. Am. J. Neuroradiol. 36, 803–810. https://doi.org/10.3174/ajnr.A4192
Cohen-Adad, J., 2018. Microstructural imaging in the spinal cord and validation strategies. NeuroImage 182, 169-183. https://doi.org/10.1016/j.neuroimage.2018.04.009
De Leener, B., Fonov, V.S., Collins, D.L., Callot, V., Stikov, N., Cohen-Adad, J., 2018. PAM50: Unbiased multimodal template of the brainstem and spinal cord aligned with the ICBM152 space. NeuroImage 165, 170–179. https://doi.org/10.1016/j.neuroimage.2017.10.041
De Leener, B., Kadoury, S., Cohen-Adad, J., 2014. Robust, accurate and fast automatic segmentation of the spinal cord. NeuroImage 98, 528–536. https://doi.org/10.1016/j.neuroimage.2014.04.051
De Leener, B., Lévy, S., Dupont, S.M., Fonov, V.S., Stikov, N., Louis Collins, D., Callot, V., Cohen-Adad, J., 2017. SCT: Spinal Cord Toolbox, an open-source software for processing spinal cord MRI data. NeuroImage 145, 24–43. https://doi.org/10.1016/j.neuroimage.2016.10.009 Dula, A.N., Pawate, S., Dethrage, L.M., Conrad, B.N., Dewey, B.E., Barry, R.L., Smith, S.A., 2016.
Chemical exchange saturation transfer of the cervical spinal cord at 7 T. NMR Biomed. 29, 1249–1257. https://doi.org/10.1002/nbm.3581
Dula, A.N., Pawate, S., Dortch, R.D., Barry, R.L., George-Durrett, K.M., Lyttle, B.D., Dethrage, L.M., Gore, J.C., Smith, S.A., 2015. Magnetic resonance imaging of the cervical spinal cord in multiple sclerosis at 7T. Mult. Scler.22, 320-328. https://doi.org/10.1177/1352458515591070 Duval, T., Le Vy, S., Stikov, N., Campbell, J., Mezer, A., Witzel, T., Keil, B., Smith, V., Wald, L.L.,
Klawiter, E., Cohen-Adad, J., 2017. g-Ratio weighted imaging of the human spinal cord in vivo. NeuroImage 145, 11–23. https://doi.org/10.1016/j.neuroimage.2016.09.018
Duval, T., McNab, J.A., Setsompop, K., Witzel, T., Schneider, T., Huang, S.Y., Keil, B., Klawiter, E.C., Wald, L.L., Cohen-Adad, J., 2015. In vivo mapping of human spinal cord microstructure at 300 mT/m. NeuroImage 118, 494–507. https://doi.org/10.1016/j.neuroimage.2015.06.038
Fartaria, M.J., Sati, P., Todea, A., Radue, E.-W., Rahmanzadeh, R., OʼBrien, K., Reich, D.S., Bach Cuadra, M., Kober, T., Granziera, C., 2019. Automated Detection and Segmentation of Multiple Sclerosis Lesions Using Ultra-High-Field MP2RAGE. Invest. Radiol. https://doi.org/10.1097/RLI.0000000000000551
Fautz, H.-P., Vogel, M.W., Gross, P., Kerr, A.B., Zhu, Y., 2008. B1 mapping of coil arrays for parallel transmission. Presented at the Proceedings of the 16th Annual Meeting of ISMRM, Toronto, Ontario, Canada, p. 1247.
Fonov, V.S., Le Troter, A., Taso, M., De Leener, B., Lévêque, G., Benhamou, M., Sdika, M., Benali, H., Pradat, P.-F., Collins, D.L., Callot, V., Cohen-Adad, J., 2014. Framework for integrated MRI average of the spinal cord white and gray matter: The MNI–Poly–AMU template. NeuroImage 102, Part 2, 817–827. https://doi.org/10.1016/j.neuroimage.2014.08.057
Hagberg, G., Bause, J., Ethofer, T., Ehses, P., Dresler, T., Herbert, C., Pohmann, R., Shajan, G., Fallgatter, A., Pavlova, M., Scheffler, K., 2017. Whole brain MP2RAGE-based mapping of the longitudinal relaxation time at 9.4T. NeuroImage 144, 203–216. https://doi.org/10.1016/j.neuroimage.2016.09.047
Held, P., Dorenbeck, U., Seitz, J., Fründ, R., Albrich, H., 2003. MRI of the abnormal cervical spinal cord using 2D spoiled gradient echo multiecho sequence (MEDIC) with magnetization transfer saturation pulse. A T2* weighted feasibility study. J. Neuroradiol. 30, 83–90.
Hudedagaddi, D.P., Tripathy, B.K., 2017. Uncertainty-Based Clustering Algorithms for Medical Image Analysis, in: Hybrid Intelligence for Image Analysis and Understanding. John Wiley & Sons, Ltd, pp. 283–295. https://doi.org/10.1002/9781119242963.ch12
Jenkinson, M., Smith, S., 2001. A global optimisation method for robust affine registration of brain images. Med. Image Anal. 5, 143–156.
Knight, M.J., McCann, B., Tsivos, D., Couthard, E., Kauppinen, R.A., 2016. Quantitative T1 and T2 MRI signal characteristics in the human brain: different patterns of MR contrasts in normal ageing. Magma 29, 833–842. https://doi.org/10.1007/s10334-016-0573-0
Kogan, F., Singh, A., Debrosse, C., Haris, M., Cai, K., Nanga, R.P., Elliott, M., Hariharan, H., Reddy, R., 2013. Imaging of glutamate in the spinal cord using GluCEST. NeuroImage 77, 262–267. https://doi.org/10.1016/j.neuroimage.2013.03.072
Kwan, J.Y., Jeong, S.Y., Van Gelderen, P., Deng, H.-X., Quezado, M.M., Danielian, L.E., Butman, J.A., Chen, L., Bayat, E., Russell, J., Siddique, T., Duyn, J.H., Rouault, T.A., Floeter, M.K., 2012. Iron accumulation in deep cortical layers accounts for MRI signal abnormalities in ALS: correlating 7 tesla MRI and pathology. PloS One 7, e35241. https://doi.org/10.1371/journal.pone.0035241
Lévy, S., Benhamou, M., Naaman, C., Rainville, P., Callot, V., Cohen-Adad, J., 2015. White matter atlas of the human spinal cord with estimation of partial volume effect. NeuroImage 119, 262– 271. https://doi.org/10.1016/j.neuroimage.2015.06.040
Lévy, S., Guertin, M.-C., Khatibi, A., Mezer, A., Martinu, K., Chen, J.-I., Stikov, N., Rainville, P., Cohen-Adad, J., 2018. Test-retest reliability of myelin imaging in the human spinal cord: Measurement errors versus region- and aging-induced variations. PloS One 13, e0189944. https://doi.org/10.1371/journal.pone.0189944
Maggioni, M., Katkovnik, V., Egiazarian, K., Foi, A., 2013. Nonlocal transform-domain filter for volumetric data denoising and reconstruction. IEEE Trans. Image Process. 119–133. https://doi.org/10.1109/TIP.2012.2210725
Marques, J.P., Gruetter, R., 2013. New Developments and Applications of the MP2RAGE Sequence - Focusing the Contrast and High Spatial Resolution R1 Mapping. PLoS ONE 8, e69294. https://doi.org/10.1371/journal.pone.0069294
Marques, J.P., Kober, T., Krueger, G., van der Zwaag, W., Van de Moortele, P.-F., Gruetter, R., 2010. MP2RAGE, a self bias-field corrected sequence for improved segmentation and T1-mapping at high field. NeuroImage 49, 1271–1281. https://doi.org/10.1016/j.neuroimage.2009.10.002 Martin, A.R., Leener, B.D., Cohen-Adad, J., Cadotte, D.W., Kalsi-Ryan, S., Lange, S.F., Tetreault, L.,
Nouri, A., Crawley, A., Mikulis, D.J., Ginsberg, H., Fehlings, M.G., 2017. Clinically Feasible Microstructural MRI to Quantify Cervical Spinal Cord Tissue Injury Using DTI, MT, and T2*-Weighted Imaging: Assessment of Normative Data and Reliability. Am. J. Neuroradiol. 38, 1257–1265. https://doi.org/10.3174/ajnr.A5163
Massire, A., Rasoanandrianina, H., Taso, M., Guye, M., Ranjeva, J.-P., Feiweier, T., Callot, V., 2018. Feasibility of single-shot multi-level multi-angle diffusion tensor imaging of the human cervical spinal cord at 7T. Magn. Reson. Med.80:947-957. https://doi.org/10.1002/mrm.27087
Massire, A., Taso, M., Besson, P., Guye, M., Ranjeva, J.-P., Callot, V., 2016. High-resolution multi-parametric quantitative magnetic resonance imaging of the human cervical spinal cord at 7T. NeuroImage 143, 58–69. https://doi.org/10.1016/j.neuroimage.2016.08.055
Metere, R., Kober, T., Möller, H.E., Schäfer, A., 2017. Simultaneous Quantitative MRI Mapping of T1,
T2* and Magnetic Susceptibility with Multi-Echo MP2RAGE. PLoS ONE 12.
https://doi.org/10.1371/journal.pone.0169265
Mugler, J.P., 3rd, Brookeman, J.R., 1990. Three-dimensional magnetization-prepared rapid gradient-echo imaging (3D MP RAGE). Magn. Reson. Med. 15, 152–157.
Nürnberger, L., Gracien, R.-M., Hok, P., Hof, S.-M., Rüb, U., Steinmetz, H., Hilker, R., Klein, J.C., Deichmann, R., Baudrexel, S., 2017. Longitudinal changes of cortical microstructure in Parkinson’s disease assessed with T1 relaxometry. NeuroImage Clin. 13, 405–414.
https://doi.org/10.1016/j.nicl.2016.12.025
Pritchard, T.C., Alloway, K.D., 1999. Spinal cord and peripheral nerves. Medical Neuroscience. ed. Hayes Barton Press.
Rasoanandrianina, H., Grapperon, A.-M., Taso, M., Girard, O.M., Duhamel, G., Guye, M., Ranjeva, J.-P., Attarian, S., Verschueren, A., Callot, V., 2017. Region-specific impairment of the cervical spinal cord (SC) in amyotrophic lateral sclerosis: A preliminary study using SC templates and quantitative MRI (diffusion tensor imaging/inhomogeneous magnetization transfer). NMR Biomed. 30. https://doi.org/10.1002/nbm.3801
Rasoanandrianina, H., Massire, A., Taso, M., Guye, M., Ranjeva, J.-P., Kober, T., Callot, V., 2019. Regional T1 mapping of the whole cervical spinal cord using an optimized MP2RAGE sequence. NMR Biomed. Accepted - in press. doi: 10.1002/nbm.4142
Sigmund, E.E., Suero, G.A., Hu, C., McGorty, K., Sodickson, D.K., Wiggins, G.C., Helpern, J.A., 2012. High-resolution human cervical spinal cord imaging at 7 T. NMR Biomed. 25, 891–899. https://doi.org/10.1002/nbm.1809
Smith, S.A., Edden, R.A.E., Farrell, J.A.D., Barker, P.B., Van Zijl, P.C.M., 2008. Measurement of T1 and T2 in the Cervical Spinal Cord at 3 Tesla. Magn. Reson. Med. 60, 213–219. https://doi.org/10.1002/mrm.21596
Steenwijk, M.D., Vrenken, H., Jonkman, L.E., Daams, M., Geurts, J.J., Barkhof, F., Pouwels, P.J., 2016. High-resolution T1-relaxation time mapping displays subtle, clinically relevant, gray matter damage in long-standing multiple sclerosis. Mult. Scler. 22, 1279–1288. https://doi.org/10.1177/1352458515615953
Stikov, N., Boudreau, M., Levesque, I.R., Tardif, C.L., Barral, J.K., Pike, G.B., 2015. On the accuracy of T1 mapping: Searching for common ground. Magn. Reson. Med. 73, 514–522.
https://doi.org/10.1002/mrm.25135
Tanghe, H.L.J., 1995. Magnetic resonance imaging (MRI) in syringomyelia. Acta Neurochir. 134, 93– 99. https://doi.org/10.1007/BF01428512
Taso, M., Le Troter, A., Sdika, M., Cohen-Adad, J., Arnoux, P.-J., Guye, M., Ranjeva, J.-P., Callot, V., 2015. A reliable spatially normalized template of the human spinal cord — Applications to automated white matter/gray matter segmentation and tensor-based morphometry (TBM) mapping of gray matter alterations occurring with age. NeuroImage 117, 20–28. https://doi.org/10.1016/j.neuroimage.2015.05.034
Taso, M., Massire, A., Besson, P., Le Troter, A., Guye, M., Ranjeva, J.-P., Callot, V., 2017. Towards in vivo spinal cord cyto- and myelo-architecture deciphering using multi-modal MRI parcellation at 7T. Presented at the Proceedings of the 25th annual meeting of the ISMRM, Honolulu, Hawaii, USA, p. 18.
Taso, M., Troter, A.L., Sdika, M., Ranjeva, J.-P., Guye, M., Bernard, M., Callot, V., 2013. Construction of an in vivo human spinal cord atlas based on high-resolution MR images at cervical and thoracic levels: preliminary results. Magn. Reson. Mater. Phys. Biol. Med. 27, 257–267. https://doi.org/10.1007/s10334-013-0403-6
Van de Moortele, P.-F., Akgun, C., Adriany, G., Moeller, S., Ritter, J., Collins, C.M., Smith, M.B., Vaughan, J.T., Uğurbil, K., 2005. B1 destructive interferences and spatial phase patterns at 7
T with a head transceiver array coil. Magn. Reson. Med. 54, 1503–1518. https://doi.org/10.1002/mrm.20708
Zhang, Y., Zhang, Y.P., Shields, L.B.E., Zheng, Y., Xu, X.-M., Whittemore, S.R., Shields, C.B., 2012. Cervical central canal occlusion induces noncommunicating syringomyelia. Neurosurgery 71, 126–137. https://doi.org/10.1227/NEU.0b013e31824d18ae