Copper Metallization with an Electron Cyclotron Resonance
Plasma Source
by
Khashayar Shadman
B.S. Nuclear and Electrical Engineering (1994) University of California Berkeley
Submitted to the Department of Nuclear Engineering in Partial Fulfillment of the Requirements for the Degree of Master of Science in Nuclear Engineering
at the
Massachusetts Institute of Technology June 1998
@1998
Massachusetts Institute of Technology All rights reservedSignature of Author...
Department of Nuclear Engineering March 26, 1998 Certified by/ Dr. Kevin Wenzel Thesis Reader Certified by...
Accepted by
....
C' ototY/ Jeffrey Philip Freidberg
Professor of Nuclear Engineering Thesis Supervisor ...
/ awrence Mark Lidsky Professor of Nuclear Engineering Chairman Department Committee on Graduate Students
i ,s
Copper Metallization with an Electron Cyclotron Resonance
Plasma Source
by
Khashayar Shadman
B.S. Nuclear and Electrical Engineering (1994) University of California Berkeley
Submitted to the Department of Nuclear Engineering in Partial Fulfillment of the Requirements for the Degree of Master of Science in Nuclear Engineering
ABSTRACT
An "electron cyclotron resonance" plasma source, used for physical vapor deposition of copper into sub-micron features, was studied to determine whether parameters, such as gas atom density, electron density and temperature, surface bias, and copper ionization fraction at the deposition surface, influenced fill quality of the features. The results
indicated that the fill quality was insensitive to all parameters except for the surface biasing conditions; however, with the use of an argon plasma, the bias was limited to less than
S- 40V due to the sputtering of the dielectric features by the argon ions (a phenomenon know as faceting). Switching to a copper evaporative system allowed for a pure copper plasma, enabling the use of greater (in magnitude) surface bias, ; I- 200V , before faceting by copper ions was observed. The fill quality of the features degraded with moderate bias (< I- 100VI) but improved with bias > 1- 150V . These results suggest that one formula for successful metallization is the use of an etch-resistant dielectric material in conjunction with large negative surface bias.
Thesis Supervisor: Jeffrey Philip Feidberg Title: Professor of Nuclear Engineering
ACKNOWLEDGMENTS
The research was conducted at Applied Science and Technology (Astex). I thank the company president, Dr. Richard Post, and the 'project 7' group (Dr. Xing Chen, Dr. John Urban, Dr. Bill Holber, Dr. Xinyu Xang, Mr. Larry Bourget, and Mr. Wayne Brooks) for the friendship and the supervision. In addition, I thank Dr. Kevin W. Wenzel and Professor Jeffrey Philip Freidberg for their continuing support of my education at MIT.
TABLE OF CONTENTS
CHAPTER 1:
1.0 - INTRODUCTION ... ... p. 5-25 1.1 -PHYSICS OF METALLIZATION ... p. 26-37 1.2 - THE INFLUENCE OF THE ELECTRON AND ION
TEMPERATURES ... ... p. 3 8-43 1.3 -THE INFLUENCE OF THE ARGON GAS ATOM
DENSITY ... ... p. 44-56
1.4 -THE INFLUENCE OF THE MAGNETIC GEOMETRY....p. 57-106 CHAPTER 2:
2.0 - EXPERIMENTS ... ... p. 107-108 2.1 -MEASUREMENT OF THE ELECTRON TEMPERATURE AND
DENSITY ... ... ... ... p. 109-138 2.2 -MEASUREMENT OF THE COPPER-TO-ARGON ION INCIDENT FLUX ... ... p. 139-160
2.3 -MEASUREMENT OF THE COPPER ION-TO-NEUTRAL INCIDENT FLUX ... ... ... p. 161-175 CHAPTER 3:
3.0 -THE EFFECT OF SUBSTRATE BIAS AND DISCUSSION OF THE RESULTS. ... . ... p. 176-190
CHAPTER 1 1.0: INTRODUCTION
As chip sizes decrease (because of the demand for compact, light-weight devices), and the demand for more memory and specialized functions increase, the number of
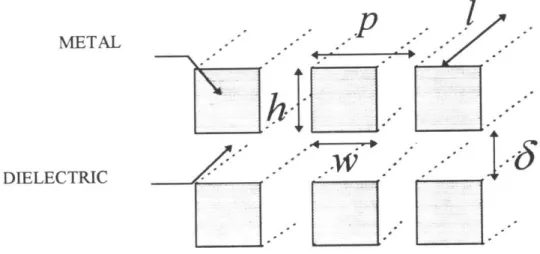
transistors per chip increases. This increase results in increased metal interconnection density, which enhances the contribution of the RC-delay from the metal interconnects, thereby limiting the speed of the chip (which is inversely proportional to the RC time constant). To understand the limitation imposed on the chip speed by the increased interconnect density, a simple model' for the line resistance and capacitance (per unit length) of the interconnect will be used. Figure 1.0-1 illustrates the simplified model of the interconnection layers.
FIGURE 1.0-1: A CROSS-SECTION OF THE METAL/DIELECTRIC INTERCONNECTION LAYERS
P .
-METAL
.p
i
A k DIELECTRIC -1-The line resistance and the line capacitance are given by the following formulas:
R P (ohms/m [1.O- 1] wh
Ciateral 2er h (farads/m [ 1.0 - 2] p-W
Cvertical 26 er (farads/m
I
1.0- 3] wherep is the metal resistivity in ohm - m
w is the width of the metal
h is the metal height
p is the average pitch ( the width of one metal-dielectric line) and
p - w is the intra-level dielectric thickness
8 is the inter-level dielectric thickness
6r,, o are the relative permitivity of the dielectric and the permitivity of free
space respectively
If the width of the metal is taken to be a fraction ' f ' of the pitch, then the formula for the 'RC' delay becomes:
RC = 2p6ro 2 + Pf :[1.0- 4]
where
I is the total line length
By inserting the optimum value for f and defining the aspect ratio of the trench
A = -h, and noting that the inter-level dielectric thickness is of the order of the trench w
height (S ; h) , the formula for the RC delay becomes:
RCz
8perO
2
+ 1
:[1.0- 5]
The formula for the RC time constant demonstrates the (1p2) dependence of the time constant on the pitch . As the interconnect density increases, the pitch decreases, drastically increasing theinterconnect 'RC' time constant. Inserting typical values for the variables:
PAl 1.7 10-8 - - m
rst0 2 = 4
1 1cm p .5pn
we find an 'RC' value of 2.4n sec, corresponding to a frequency of 400MAHz. Hence, we can see that the interconnection 'RC' delay will become a hindering factor as the industry pushes for a smaller chip size (> p <.5pun) and greater chip 'speeds' ( 'speeds' of
1GHz).
To compensate for this increase in the RC-delay, the industry is investigating a few options:
1) the use of a metal with lower resistivity: at the present aluminum
(3 pohm .cm) is the standard choice, but copper (1.7 ,ohm -cm) will be the
2) the use of a dielectric with lower relative permitivity : at the present SiO2
(relative permitivity of 4) is the prevalent choice, but the use of some type of polymers with relative permitivity of 2 is being investigated. There are issues
of structural integrity and material compatibility.
3) increasing the number of metal interconnect layers: structural integrity and the increase in the process time limit the number of layers to less than 10. 4) increasing the vertical distance between the metal lines: the increase in the
vertical distance between the metal lines will decrease the vertical capacitance, but the gain from this is limited by the lateral capacitance; in addition,
depositing more dielectric between the metal lines increases the process time. 5) increasing the aspect ratio of the metal trench to compensate for the
decrease in the current carrying area due to the decrease in the pitch( line resistance is inversely proportional to the area) : there is not much gain in
increasing the aspect ratio beyond a value of 3 because of the increase in the lateral capacitance; currently the industry is implementing metal trenches with aspect ratios of- 1. The need for increasing the metal trench aspect ratio has motivated the research for this thesis.
THE PROCESS OF METALLIZATION
Understanding the deposition of metal in high aspect ratio (_ 3/1) features requires a description of the metallization process (the process by which the metal interconnection layers are created). The process is illustrated in figure 1.0-2:
FIGURE 1.0-2: ILLUSTRATION OF THE METALIZATION PROCESS 1: Deposition of the dielectric j substrate Photo-resist 2,3: Deposition and UV exposure of the resist 4: Etching of the photo-resist with a reactive gas /4 5: Plasma etching of the exposed dielectric 6: Removal of the remaining resist 7: Plasma deposition of the metal interconnections I I
1) a layer of metal (such as aluminum )or dielectric (such as SiO2 ) is deposited
and chemically polished.
2) a layer of photo-resist is deposited on the metal or dielectric; a photo- resist is a material with chemical bonds that are sensitive to ultra-violet ray exposure. 3) once the layer of resist has been applied, UV rays are directed onto the resist through a patterned mask.
4) with the pattern imprinted into the resist, the resist is exposed to a plasma with a reactive gas (such as fluorine or chlorine); the plasma dissociates the gas
molecules into atoms; these atoms subsequently etch the part of the resist that was exposed to the UV and leave the underlying metal or dielectric exposed.
5) the exposed metal or dielectric is then directionally etched (plasma enhanced etching) with halogens to produce the metal or dielectric trenches.
6) once the metal or dielectric trenches are formed, the remaining resist is exposed to UV and removed.
7) the dielectric or metal is then deposited via (chemical vapor deposition) ;the overburden is removed, and the surface polished .
8) the process is repeated for the next layer.
As the industry is pushing for the use of lower resistive metals, copper will replace aluminum. Unfortunately, there is no practical method for chemically etching copper (because of the difficulty in the removal of the reaction by-products resulting from their low vapor pressure); therefore, the process must begin with the deposition of a layer of dielectric, and the metal must be deposited into the trenches formed by etching the
dielectric; hence, the need for the metalization of large aspect ratio features.
There are a few methods for the deposition of metal into large aspect ratio sub-micron trenches of which I will mention two:
1) CVD (chemical vapor deposition): The idea is to expose the metal source to a reactive gas; the gas then reacts with the metal to form a metal vapor compound, which is then transported to the wafer where it is deposited once the compound dissociates either upon contact with the dielectric or with the aid of another gas.
There are inherent disadvantages with CVD. It requires the use of highly reactive chemical compounds (toxic to humans and damaging to the environment), which require care to implement and dispose, rendering the process very
expensive. Even for the less reactive compounds such as the metal-organic compounds, there are concerns about trapped impurities within the metal fill resulting from the compound's large affinity for attachment to the metal atom.
These disadvantages have rendered a second method more attractive for metallization: PVD.
2) PVD (physical vapor deposition): This method relies on physical sputtering of the metal source; sputtering is the removal of atoms from their lattice through bombardment by other energetic atoms (or more likely, ions). Therefore, there is no need for reactive compounds.
Both CVD and PVD either benefit or rely on the use of a plasma source; to understand the need for a plasma for CVD and PVD applications, the basic properties of plasmas must be explained. Plasmas are created by the input of energy into the few free electrons in a gas (these electrons are created from the ionizing collisions between photons
and the background gas atoms); this energy input can be from a voltage source, an inductive drive mechanism, or from a microwave source coupled with the use of
electromagnets. The energetic electrons subsequently collide with the bound electrons in the gas atoms. The collisions result in the excitation and in the eventual ionization of the
gas atoms. The ejected electrons are then accelerated in the same manner as the original free electrons via the mechanisms discussed and ionize more atoms. The result is a sea of atoms, ions, and electrons referred to as a plasma. The electrons are much less massive than the ions in the plasma (for an argon plasma, the electron to ion mass ratio is
-1/70,000); therefore, the electrons are much more mobile. This difference in mobility results initially in the dominance of the electron flux contribution to the boundary of the plasma source. The charge separation resulting from the excess electron flux to the plasma boundaries creates an electric field, which enhances the ion mobility to the
the electric field created by the charge separation reaches the strength to correct for the initial disparity in the ion and electron flux to the boundaries. The large mobility of the electrons yields a very conductive plasma; therefore, the electric field created by the charge separation can not penetrate far into the plasma. The distance of penetration, denoted as the sheath thickness is related to the Debye length (-1 O's of microns):
SVTe [ 1.0- 6] ,
C 2 e ne
where
VT is
V-
times the electron thermal speed,cope is the electron plasma radian frequency,
Te is the electron temperature,
ne is the electron density,
e is the electron charge,
and
e0 is the permitivity of free space.
The Debye length is proportional to the ratio of the velocity with which the electric field can penetrate the plasma (the electron thermal speed) to the electron response frequency. At greater distances from the boundary, the plasma is quasi-neutral and free of any
significant electric fields (there is a region between the sheath and the quasi-neutral region denoted as the pre-sheath where there is a small potential drop of about e).
sharp drop to the boundary within the sheath. Sheath formation is the essential property of the plasma that renders it attractive for directional etching and deposition in
metallization for ULSI technology. Another attractive property of the plasma is its ability to sustain a very high electron temperature (--1-10eV), allowing for the disassociation of gas molecules into reactive atoms; these reactive atoms are a necessity in the applications
of chamber cleaning and environmental waste disposal.
As mentioned before, there are different methods for igniting a plasma. The method of choice depends on the application. For metallization, the important criterion (besides actually filling the trenches with metal) are spatial uniformity and process rates. The uniformity is a function of spatial power absorption and particle energy transport. The process rate is a function of the plasma (ion) current density to the wafer, which is
proportional to the electron density and to the square root of the electron temperature (a deposition rate of 0.1 on/min requires a current density of 2.3 mA/cm2 , which implies that
f
sub e (T )1/2 z 2.3*1011(eV)1/2 cm3 ; for a typical copper-to-argon ion flux Cu+lAr+fraction at the substrate of
fC
IA. 10% this product may be realized with ne = 1012/cm3 and Te ; 5eV).Therefore, high process rates require the use of a plasma source that can sustain a 'high' electron density and temperature. One such source is an electron cyclotron
:FIGURE 1.0-3:A SIMPLE SCHEMATIC OF THE ECR SOURCE AND :THE ASSOCIATED HARDWARE
DC POWER WAVEGUIDE
SUPPLY FOR THE
ARGET TWO METAL ELECTROMAGNETS TARGET MICROWAVE GENERATOR GAS LINE SUBSTRATE DIVERGING MAGNETIC FIELD LINES CREATED BY THE ELECTROMAGNETS WATER FEEDTHROUGHS
FOR COOLING AND ELECTRICAL CONNECTIONS FOR BIASING THE SUBSTRATE
As illustrated in figure 1.0-3, an ECR source consists of a microwave generator and wave-guide, plus electromagnets. The electromagnets create an axial magnetic field, which is
essential for the provision of
a) the radial confinement for the plasma charged particles ( ions and electrons) b) the cyclotron motion of the electrons to which the right hand circularly
polarized component of the launched microwaves oouple.
To understand the ECR source's ability to sustain high electron densities and temperatures, a zero dimensional energy conservation model (which was adopted by
Liebermann et al.2) will be employed.
Assuming an optically thin plasma and negligible radiation energy loss from:
2 Liebermann and Lichtenberg, Principles of Plasma Discharges and Materials Processing, 1994, Chp. 10 I I I , I I II I '' 1 i II I I i r
a) ion-ion collisions b) ion-electron collisions c) electron-electron collisions d) the electron cyclotron motion and also assuming
a) a single ion species
nAr2+
b) only singly ionized ions > << 1 ; this is a good approximation because nAr+
the energy (29eV) required to doubly ionize argon(Ar + => Ar2+)is much greater
than the energy (a 16eV) required to singly ionize(Ar0 => Ar +), and the
cross-section for double ionization is much less, and
c) negligible ion energy loss to the neutrals from charge exchange and elastic collisions
the radiation energy lost (Ec) per electron-ion pair created from ionization collisions can be derived from the following argument:
In a time "dt ", the number of electron-ion pairs created per unit volume from ionizing collisions is given by
(nengKizo + ningKiz )dt:1.0- 7]
During that time, the total radiation energy loss in the bulk of the plasma from the various reactions is given by :
where
ne is the electron density;
ni is the ion density (singly ionized);
ng is the gas atom density;
Kizo is the reaction rate coefficient for electron-neutral ionization;
KizI is the reaction rate coefficient for ion-neutral ionization;
K, is the reaction rate coefficient for excitation collisions with neutrals;
Ket is the reaction rate coefficient for elastic collisions;
rec is the reaction rate coefficient for electron-ion recombination;
Eiz is the average radiation energy loss in the electron-neutral ionizing collisions;
EjI is the average radiation energy loss in the ion-neutral ionizing collisions; ex is the average radiation energy loss in electron excitation collisions with neutrals;
Eet is the average energy loss to the neutrals in the electron-neutral elastic collisions;
Erec is the average radiation energy loss in the electron-ion recombination reactions;
and
1
3 3cKE -2 d3vd3 vV2 vr (f() 2dA d AE2j (vr, ,);
n ,n2 are the densities of the reacting species;
fi,
f2 are the velocity distribution functions of the reacting species; Vr -l - V2 is the relative speed of the two species;AEj is (with the exception of the electron-neutral elastic collisions) the
radiation energy loss for the reaction due to the change in states of the reacting species;
daj
d is tlhe differential cross section for the specific reaction; and
the last integral represents the average energy loss for a given initial state (vr) , where the average is taken over all the possible final states for the particular reaction.
The radiation energy loss per electron-ion pair created ( E, ) is then given by the ratio of equations 1.0-8 and 1.0-7:
KizoEizo + (ni /ne) Kizl Eiz + KlEi + Kel [me /mg) Te + (i /ng )K Eree Kizo + (ni /ne)Kizl
In equation 1.0-9, the average energy loss for elastic collisions is calculated to be3
Eel ; 3* m * Te
assuming
a) a Maxwellian electron velocity distribution function and a stationary 'cold' neutral background, and
b) a cross section for the reaction derived from a model that accounts for the polarization of the atom by the electron's electric field.
We note that with the exception ofKi1 ,which is a function of the ion and neutral temperatures, the remaining reaction rates (which involve the electron distribution
function), to a good approximation, are only a function of the electron temperature. The reason for this simplification is that the average electron speed is much greater than both the ion and the neutral speeds; hence, for the reaction rates that involve the electron, the ion and the neutral distribution functions can be treated as a delta function centered at their drift speed.
Besides the energy loss channels within the bulk of the plasma, there are energy losses at the plasma surface boundaries due to particle losses. The average energy loss per unit area of the plasma boundary is just the particle kinetic energy averaged over the particle flux normal to the surface. For this calculation, the ions are treated as a cold fluid
( the distribution function is approximated as a delta function with a directed energy of
"Esheath " normal to the boundary, where Esheath is the energy gained through the sheath).
The ion average energy loss is then Esheath :
Esheath
,V -Vf)
+V
- Vub)V, = the plasma potential relative to the system ground
Vf = the floating potential relative to the system ground Vsub = the substrate voltage relative to the system ground
Vpf Vp -7Yf -(3.34 + 0.5* In(m/mH)) * T; (for a Maxwellian electron velocity distribution function)
mi
/mH
= the ratio of the ion mass to the proton massTe= electron temperature in e V
for an argon plasma (mi 40mH) Vpf 5.2Te
The electron distribution function is assumed to be Maxwellian, yielding an average energy loss to the boundaries of 2Te.To obtain the energy loss to the plasma boundary per electron-ion pair created, quasi-neutrality (n, ; ni) and particle conservation is invoked: at equilibrium, the electron and ion creation rates must balance their loss rates. Assuming that the dominant species comprise only neutrals and singly charged particles, the ion and electron creation and loss rates are equal:
ZJibA
b = rebAb = (nengKizo +ingKiz -neniKrec) -Vo:[1.O0 = 10]b b
rib, eb are the electron and ion fluxes at the boundary
rib = nsbUb
1
]eb 4 nsbVeb
Veb [8Teb /'ne ]1/2
Ab is the area of the particular boundary
Teb is the electron temperature at the boundary
nsb is the electron (=ion) density at the sheath
Together, the particle and energy conservation equations yield:
(Krzo /Ub 1+(K 1
K -
(e /g Krec /K ) = HTeb HnbAb
Ngabs
ne -:[1.0- 12]
KzoNg[(Eb + EcX+ Kl
/K:o)
- Eb(neKecngKo] °a) Eb 2eb Feb
Ab
+Eseathbib Ab
FibAb
b) Ng - ngVol; Vol is the plasma volume, and Ng is the total number of gas atoms
c) HTeb - Teb /Te ; the ratio of the electron temperature at the boundary to that in the bulk plasma
d) Hnb - nb Ine ; the ratio of the electron density at the boundary to that
in the bulk plasma
e) the sum is over all the boundaries
f) Pabs is the absorbed power ( Microwave heating, DC bias, inductive
drive...)
g) ni +ng = ngo (3*1013/cm3)*(Pr/(mtorr)); typically n 1%;
ng
therefore, to a good approximation ng = ngo
If recombination is neglected, then the particle conservation equation 1.0-11, will determine the bulk electron temperature directly provided that
a) the ion-neutral ionization rate is negligible (otherwise the ion and the neutral temperatures must be determined)
b) the ion and neutral drift speeds are negligible when compared to the average electron speed
Once the electron temperature is known, the electron density will be determined from equation 12. If recombination can not be ignored, then equations 11 and 1.0-12 will have to be solved simultaneously. If a second ion species is added (from
sputtering copper into the plasma for example), then there will be some modifications to the above equations:
a) the added effect of (ionization, excitation, and recombination of copper atoms and ions and the copper ion flux to the boundaries) to the particle and energy conservation equations
b) the gas density will comprise both copper and argon c) quasi-neutrality => ne nAr+ + ncu+
This simple global model readily demonstrates the benefits of an ECR source as compared to a typical DC discharge. A DC discharge consists of a pair of parallel plates with one plate biased to a large voltage(-_ kV) relative to the other. The large voltage,
which accelerates the electrons, is the plasma's only power source. Now because the electron temperature is a very strong function of the source geometry, there is no intrinsic advantage in an ECR source as compared to a DC discharge source for obtaining large electron temperatures. However, the electron density is dependent on the ratio of the power absorbed to the energy of the ions leaving the source. For a DC discharge, the energy of the departing ions is dependent on the DC bias, which happens to be the source
of power for the plasma. Therefore as the absorbed power increases so does the ion energy at the plasma boundary, which prevents the increase of the electron density. An ECR source has the microwave power as its principle power source, which allows for independent control of the ion energy at the boundaries and the electron density. This independent control is crucial for applications that simultaneously require precise ion
energies and high process rates such as the deposition and etching of metal and dielectric in the metallization process.
The ECR source's ability to create a high temperature, high density plasma does not necessarily render it useful for metallization. High process rates are important but useless if the process itself can not be achieved. The metallization application explored in this work is the filling of sub-micron, high aspect-ratio features with metal. Therefore, the main criterion for an ECR source is its ability to provide the conditions that will result in the filling of these features. Before the ECR source's capabilities can be assessed, the
physics that will lead to a successful fill must be understood and the following questions answered:
1) What is meant by a successful fill?
2) Do the conditions that lead to a successful fill exist in an ECR sputter source? 3) If the conditions do exist, then what are the properties required of a plasma source that will enable it to operate within a process window that will yield these conditions?
The first question can be answered by the illustration in figure 1.0-4: FIGURE 1.0-4: CROSS-SECTION OF A METAL TRENCH UNSUCCESSFUL FILL VOID METAL FILL
0.5 m
A successful fill has no visible voids; voids degrade the metal line's conductivity as well as enhance electro-migration (the diffusion of atoms resulting from the presence of electric fields), which redistributes the atoms in the metal lines creating more voids. A successful fill also requires that there be no damage to the dielectric surrounding the metal trench from the sputtering that can result from the incident energetic ions.
The answer to the second question was not known at the time for copper
metallization of trenches with widths of less than 0.5mn and aspect ratios greater than 2. It was hypothesized that multiple particle reflections within the trench are necessary for filling geometrically complicated structures. In fact, there are a few other criteria that were believed to be fundamental to the evolution of a successful fill, and they will be discussed in the later sections.
The surface conditions influencing the evolution of the fill were believed to be functions of a few plasma parameters at the surface such as
a) the ratio of the copper neutrals to the copper ions incident on the trench b) the ratio of the copper ions to the argon ions incident on the trench c) the energy and angular distribution of the incident flux for each species:
1) metal ions 2) metal neutrals 3) gas ions
4) gas neutrals : gas neutrals would play a role in the fill evolution a) if the gas neutrals possess enough energy to sputter the
deposited copper (possible if there is a significant energy exchange between the ions and the neutrals) ; for our plasma, the neutral gas energy is sub - eV , well below the sputtering threshold of - 30eV
b) if the mean-free path for collisions is of the order of the trench size (n ), which is not the case for our plasma
(Prgas 1mtorr :> A
t 5cm)
These plasma surface parameters are themselves determined by the source geometry, the substrate bias, the method for igniting the plasma (ECR, DC discharge, Inductively coupled plasmas (ICP), helicons,....), and the plasma bulk properties (such as electron temperature and density profiles), which are also partly a function of the source geometry and the method of ignition. Once the method of ignition and the geometry of the source have been established, the remaining variables that can alter the plasma
properties are the process parameters such as gas pressure and microwave power, and the magnetic flux profile (which is controlled by the electromagnet currents) . A thorough understanding of the metallization process requires coupling together
A) a model that describes the particle-surface interactions, and particle diffusion at the surface
B) a model that relates the plasma surface parameters to the plasma bulk parameters
C) a model that describes the influence of the process parameters, the source geometry, and the method of power absorption on the plasma bulk parameters.
1.1: PHYSICS OF METALLIZATION:
Before an attempt is made to understand in detail the plasma physics and its relation to the fill evolution, an understanding of the plasma surface interactions is needed.
PROCESS 1: FIGURE 1.1-1:
POSSIBLE INTERACITONS OF THE
INCIDENT PARTICLES WITH THE
Uu
PROCESS 2:METAL SURFACE
1. REFLECIION OF THE
INCIDENT COPPER Aro
ATOMS AND IONS.
Ar
+2. SPUTTERING OF THE . o
DEPOSITED COPPER BY Cuo
COPPER AND ARGON IONS
As shown in figure 1.1-1, the incident particles can have a few possible interactions with the surface:
A) the particle can be reflected (either upon impact or after diffusion along the surface)
B) the particle can "stick" to the surface via physio-sorption (physical
incorporation of the atom into the surface lattice) or via chemi-sorption (chemical interaction with the surface atoms)
C) the particle can sputter other surface atoms ( the ejection of the surface atoms via the energy gained from the incident particle)
The physics of sputtering, reflection, and surface diffusion is quite complicated and not completely understood, and although the understanding is crucial for obtaining the preferential interactions that will lead to a successful fill, it is not needed for a discussion about the reasons for the preferences. So exactly what are the preferred interactions?
Clearly, to fill a trench, the pathway to the bottom of the trench can not be obstructed; therefore, accumulation on the trench corners, which will eventually close the trench
entrance (shown in figurel. 1-2), leaving a void inside (the phenomenon known as pinch-off), must be avoided.
FIGURE1.1-2: A SCHEMATIC OF THE EVOLUTION OF A
'PINCH-OFF',RESULTING FROM CORNER DEPOSITION
T1<T2<T3
TIME=T3
.... TIME =T2
1 ' TIME = T1
To avoid deposition on the corners,
A) the impinging metal flux must be directed normal to the surface
[non-directionality will lead to an impending metal flux at the top of the side-walls (the corners).
B) if there is an impinging metal flux at the corners, the interaction of the metal atoms with the surface must lead to a large probability of reflection ( a large reflection coefficient is equivalent to a small sticking coefficient ); if the oncoming metal particles have a small probability of sticking at the corners, the accumulation at the corners will be little.
C) if the metal flux does arrive to the corners and sticks upon impact, then it must be removed via sputtering by subsequent particles.
To obtain these preferred interactions through control of the process parameters requires knowledge of the plasma surface parameters as well as the physics of the surface interactions (which as mentioned before is not well understood). Because the theories are not adequately established , the route to understanding the surface interactions has become purely experimental with some aid from numerical simulations ( note that the simulations
are as accurate as the physics on which they are based; the physics of the surface interactions are controlled by a few microscopic parameters such as the differential
sputtering coefficient, coefficients that must be determined experimentally ).
The experimental approach at the beginning had been based on trial and error: the ECR sputter source (figure 1.0-3) would be run at various process conditions:
a) microwave power: 2 to 5 kW b) argon pressure : 0.5 to 3 mtorr c) target: aluminum, copper d) target voltage : 500V to 1200V
e) electromagnet currents (top/bottom): 150A/150A to 230A/180A,
f) substrate bias : no bias> 'floating'" ; DC (direct current) bias; RF (radio-frequency) > AC (alternating current) bias; pulsed-DC - RF-bias with 'shaping' and the fill profiles for the different run conditions would be examined. The experiments that employed the different substrate biasing techniques and the biasing techniques themselves will be discussed later; for now, the discussion will concentrate on the experiments that employed no substrate bias (substrate floating). We will also limit
our discussion to the deposition of copper (copper target) only. The results for the aluminum and copper deposition were quite similar; however, there are differences in the properties of copper and aluminum films that influence the success of filling sub-micron features (through their control of surface diffusion, surface tension, and relative etch rates from the side and the bottom of the trench) such as sputtering yields (greater for copper) and melting temperature (greater for aluminum). The fill profiles were examined both qualitatively and quantitatively. The quantitative observations were made as follows: the fill of features with a height of (h = 2lon) and varying aspect ratios
[A (h/w)], 1/2 A <4, was characterized by two parameters, illustrated in figure 1.1-3: FIGURE 1.1-3:
CHARACTERIZATION OF THE TRENCH
's' IS TAKEN TO BE THE 'MEAN' WIDTH OF THE VOID
'b' IS THE DISTANCE FROM THE BOTTOM OF THE
h
TRENCH TO THEBOTTOM OF THE VOID
a) percent fill (also known as bottom coverage) B 100%()
b) side-wall coverage S 1 00%(
-(a successful fill requires that both of the quantities S and B = 100% ). Unfortunately, the results of measuring these two parameters for the different process conditions were quite discouraging.
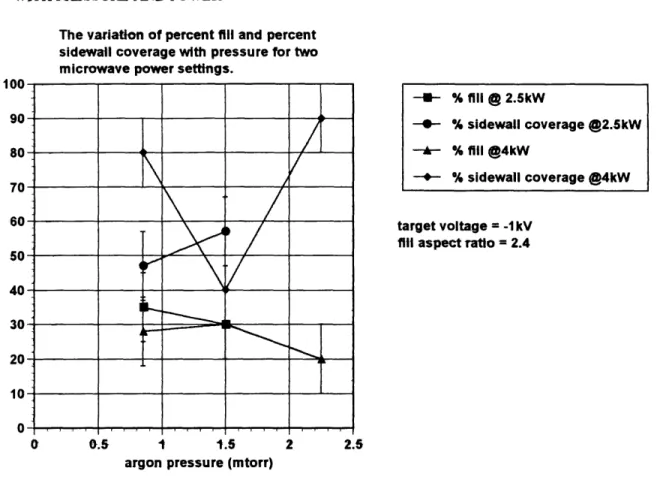
FIGURE 1.1-4: VARIATION OF THE FILL QUALITY WITH PRESSURE AND POWER
The variation of percent fill and percent sidewall coverage with pressure for two microwave power settings.
100 90- 80-70 60-50 40 30 20-10 n-target voltage = -1kV fill aspect ratio = 2.4
0 0.5 1 1.5 2 2.5
argon pressure (mtorr)
As illustrated in figure 1.1-4, no successful fills were observed for an aspect ratio (A = 2.4), in fact, no successful fills were observed for (A 2 2.4) . Furthermore, no correlation of the fill quality with the process parameters (power, pressure, and magnet current) was found.
This discouraging result served as motivation to understand the influence of the process parameters on the plasma bulk parameters such as:
a)
T
e : the electron temperatureb) Tcu: the copper ion temperature
c) ncuo ,ncu. ,nAr ,'nAro : the copper and the argon ,(neutral and ion), bulk
densities
-U+- % fill @ 2.5kW
--- % sidewall coverage @2.5kW
A % fill @4kW
d) ircu+, lcuo ; the transport efficiency of the copper ions and neutrals from the
FCuj
target to the substrate, defined as c = tr , where
1) 'j' corresponds to neutral or ion
2) Fcu, denotes the neutral or ion copper flux at the substrate
target = cucuf target S (ftarget Cu + IAr
3)
taget +Ar CuAr+ eAtarge
Cu Ar
'target = (1 + s )Icu +( 7se )IAr
is the copper flux leaving the target, where I. It arget is the target current
II. Atarget is the target area III. e is the electron charge
IV. Scu/cu, SCu/Ar denotes the sputtering coefficient of copper by
copper and of copper by argon at normal incidence
V. t arg/r is the fraction of the ion flux to the target that is copper
VI. yV c,y, are the secondary electron emission coefficients for the incident copper and argon ions respectively
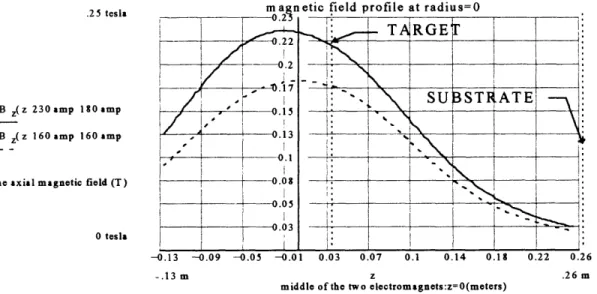
e) magnetic flux geometry and magnetic field strength
and their effect on the plasma surface parameters because , after all, these are the parameters that ultimately influence the fill. These plasma surface parameters are:
a) (69'c): the average angle of incidence of the copper flux
b) (EAc), (E nu ): the average incident energy of the argon and copper ions
c) fsub/Ar : (the copper-to-argon ion flux fraction at the substrate):
- ++ FCu+
rCu+ fAr+
d) f sub : (the copper ion-to-neutral flux fraction at the substrate):
Cu+ /Cu
FCu++ Fcuo
There are a few other plasma surface parameters ,which are equally influential in influencing the fill evolution: they are
d) fE (E) :the energy distribution function (EDF) of the copper ions, argon ions, and copper neutrals
e) (dS/dEdQ)Ar/Cu (dSdEI)Cu/CU: (the double differential sputtering
cross-sections for argon on copper and for copper on copper) defined such that
(d dFlEd is equal to the ratio of
1) the number of particles leaving the surface with energy between E and
E + dE and with angle between (0, 0) and (0 + dO, 0 + do) with respect to the surface normal
2) to the number of particles incident with energy E,,, and angle
f) T e,,f: the metal surface temperature.
Obtaining information about the latter plasma surface parameters (d,e,f) is essential in the detailed understanding of the fill evolution; but as can be expected, these parameters are extremely difficult to diagnose.
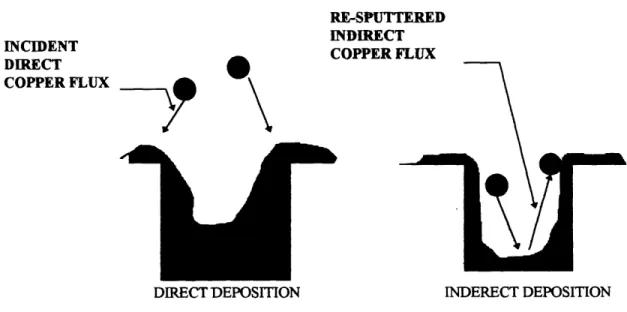
The motivation for obtaining measurements of the first three above mentioned plasma surface parameters requires an understanding of the influence of these parameters on the fill evolution. As previously mentioned, deposition on the corners must be avoided to fil a trench. As illustrated in figure 1.1-5, deposition on the corners can occur via
a) direct deposition by incident metal flux
b) indirect deposition from sputtered metal from the bottom and the side of the trench
FIGURE 1.1-5: AN ILLUSTRATION OF THE DIFFERENT DEPOSITION MECHANISMS.
RE-SPUTTERED
INCIDENT INDIRECT
COPPER FLUX
DIRECT DEPOSITION INDERECT DEPOSITION
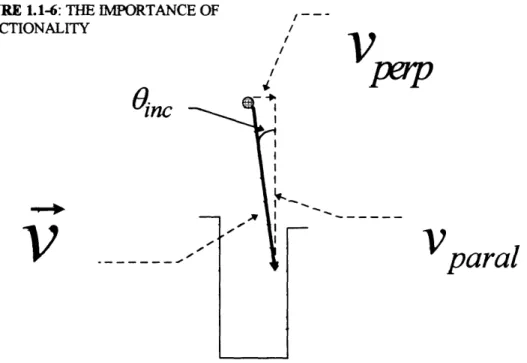
How do the first four plasma surface parameters influence corner deposition? 1) ( ) : directionality of the copper metal flux
FIGURE 1.1-6: THE IMPORTANCE OF - -DIRECTIONALITY /
V
nc
',
I
--,
Vparai
The directionality of the copper metal flux determines direct corner deposition. As illustrated in figurel. 1-6, a highly directional flux is required to avoid corner deposition.
2) : (E ,(E~C )te average incident energy of the copper and argon
particles (ions and neutrals)
The incident energy of the particles influences the indirect corner deposition via the sputtering of the deposited copper from the trench bottom (or from reflection off-the trench bottom). The sputtered (or reflected) copper particle can subsequently redeposit on the trench corner. The incident energy of the particle also influences the direct removal of any deposition at the trench corners.
3)
f
/uAr+ (the tcopper-to-argon ion fraction at the substrate):]Cu+
The copper-to argon ion fraction becomes an influential parameter once surface biasing techniques are employed. If the substrate is floating, the maximum energy of the ions striking the surface, which will be
demonstrated in a following calculation, is about 30e V. The sputtering threshold for argon and copper ions striking a copper surface is also about
30eV; therefore, for the experiments performed with a floating substrate,
neither the argon nor the copper ions contribute significantly to indirect deposition at the corners via the sputtering of the deposited copper from the trench bottom (or to direct removal of the deposited copper at the corners via sputtering). Furthermore, the mean-free path for the argon-copper elastic collisions is, as stated previously, about 5cm, which is much greater than the trench size of 1omn; hence, the expected number of
scattering collisions of the directed copper flux (to the trench bottom) near the trench, which could lead to an increase in the direct copper deposition at the corners, is negligible. However, once the surface is biased to
increase the directionality of the impinging ion flux, the incident ion energy increases above the sputtering threshold, thereby increasing the
contribution to the indirect corner deposition from the re-sputtered copper flux from the trench bottom as well as direct removal via sputtering at the corners; (note from figurel. 1-6, that the angle of incidence
(
Vparal.nc = - a vperp , and by biasing the surface negative with
V, - Vsuce,) = (V, - V) + (V, - V nd) + (Vground - Vsurface)]
and as will be shown in the discussion about the influence of the electron temperature:
vparl 3OeV +eVgs
Vperp 5eV
where V - Vground - V,f, > 0, Vf - Vgnd ", 0, and the
30e V essentially comes from VP - V- 3 T (see section 1.2). Therefore,
Vparal
the result of the bias is an increase in - => an increase in the
Vperp
directionality of the incident flux). Hence, there is a compromise between increasing the copper ion energy to increase the directionality of the incident flux (to avoid direct corner deposition) and decreasing the argon and copper ion incident energy at the trench bottom (to avoid indirect corner deposition from the re-sputtered copper flux from the trench bottom). Of course there is also, as previously stated, direct sputtering at the corners as well, which aids in the removal of corner deposition; however, the flux of atoms sputtered from the corners is preferentially
directed towards the opposite side, thereby reducing the benefit of corner sputtering. To minimize the indirect corner deposition while attempting to increase the incident copper ion directionality via substrate biasing,
fu + / Ar+ must be maximized. Of course, even if fCu+ Ar+ = 1,
indirect corner deposition from the re-sputtered copper flux from the trench bottom, sputtered by the energetic incident copper ion flux. 4) fcu /Cuo : (the copper ion-to-neutral fraction): - FCu
1Cu+ + CuO
So far, we have been talking about the directionality of the copper ion flux and have said nothing about the infltence of the impinging copper neutral flux. In fact, if most of the copper flux is neutral, the voltage drop across the sheath will be ineffective in enhancing the directionality or
controlling the energy of the incoming copper particles. Hence, to reap the benefit of using a plasma, (the natural potential drop that is created across the sheath), fcu+ /Cuo must be maximized.
Before proceeding with our discussion, it is worth noting the logic behind it. Remember that we only have control over what we have called the process parameters (gas pressure, microwave power,...); and to understand the influence of these parameters on the fill quality, we need to understand the hierarchy of influence:
process parameters > plasma bulk parameters z' plasma surface parameters
Now that we have some understanding of the influence of the four plasma surface
parameters on the fill quality, wewill investigate thebulk plasma parameters influence on these surface parameters.
1.2: THIE INFLUENCE OF THE ELECTRON AND ION TEMPERATURES Te, T+ : the electron and ion temperatures
The global model presented demonstrates that Te is virtually independent of the
input power and very sensitive to the process gas, the gas pressure, and the source geometry. For our source with a plasma volume of 0.03m3 and argon gas pressure of
lmtorr , a typical electron temperature is of order 5e V. As previously described, the
electron temperature and the electron energy distribution function indirectly control the ion energy gained (normal to the surface) through the sheath by determining (V, - Vf), the potential difference between the plasma and the floating surface. Of course if the surface is electrically biased the contribution of the bias to the ion energy will have to be considered.
Before discussing the ramification of the electron temperature's influence on the incident ion energy, one peculiarity of the V, - Vf in our plasma should be noted: As previously stated, for a Maxwellian electron energy distribution in an argon plasma,
V, - Vf is approximately 5T,; however, for our plasma the observed Vp - Vf is about 3T,.
The discrepancy is the result of the assumption of a Maxwellian electron energy distribution. For weakly ionized plasmas, (ni ne <<ng; for our plasma e = 10%),
ng
the high-energy tail of the electron distribution function is depleted because the electrons in this energy range have a larger probability of having excitation and ionization collisions (because these interactions have energy thresholds ) with the background gas atoms; these excitation and ionization collisions are the dominant energy loss channels for the electron
population as compared to electron-neutral elastic collisions, which have a reduced efficiency for energy exchange of order the mass ratio of the electron to the gas atom
me
- << 1. Because of the depletion of the more energetic electrons, the requirement on mg
the retarding potential hill for the electrons (Vp - Vf ), which is created to balance the
electron and ion flux to the plasma boundaries, is less; hence, Vp - Vf is less than the predicted value assuming a Maxwellian distribution (which has electrons in the high-energy tail).
This potential difference between the plasma and the surface accelerates the incident ions normal to the surface. To estimate the average angle (with respect to the
surface normal) with which the ions impinge on the surface, we need an estimate of the ion energy (parallel and perpendicular to the surface normal) prior to its acceleration through the sheath. The metal ions originate at the metal target from which they are sputtered as neutrals that subsequently ionize. The sputtered metal distribution' is shown in figure
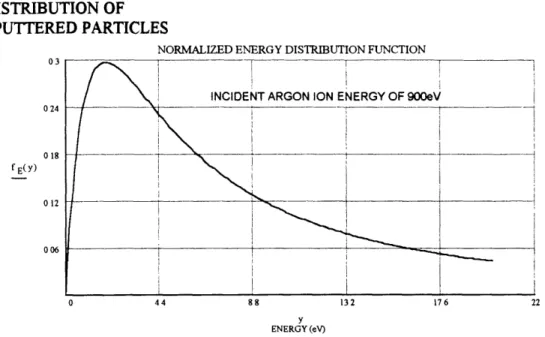
FIGURE 1.2-1: THE ENERGY DISTRIBUTION OF
SPUTTERED PARTICLES
NORMALIZED ENERGY DISTRIBUTION FUNCTION
03
-INCIDENT ARGON ION ENERGY OF 900eV
024 - ... ... .tf 0 18 012 006 0 44 88 132 176 22 y ENERGY (eV)
This distribution has a high-energy tail and an average energy of x 3.7eV. The dominant energy loss channel for the sputtered metal atoms is the collision energy loss
with the gas atoms mmeta a mga, > AE/collision 2 E . The mean free path for
2 -/~-- ' --- ~--
-collisions with the background neutral gas ( gas pressure of mtorr ) is of order 5cm and the target to substrate distance is approximately 10" z 25cm ; therefore, the sputtered metal atoms will experience about five elastic collisions before they reach the substrate, which reduces their initial average energy of 3.7e V to sub- eV levels, characteristic of the ion temperature in our plasma Ton < le V . Now, once the metal atom is ionized on its
path to the substrate, (EmetaI 3eV;ne 1012 cm-3 Te 5eV onizaon 2cm), the
metal ion can gain energy from established electric fields within the plasma and also
of the coulomb interactions render the energy loss from the coulomb collisions with the gas ions comparable to the energy loss from the collisions with the gas atoms , even
Vi/n
though the gas atom density is ten times the gas ion density : 1 ,where v is the Vi/i
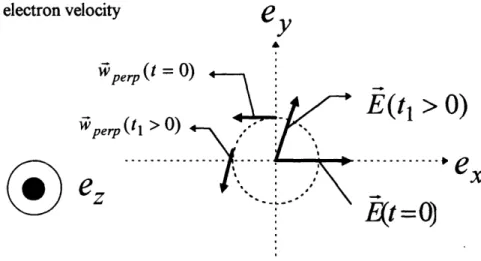
collision frequency for energy loss- the collision frequency for momentum loss). Such energy gain from established electric fields in the plasma occurs within the pre-sheath. The pre-sheath will accelerate the ion's parallel velocity to the speed at the sheath,
U ((T +(1/ 2)To)/m,) 1/2, the ion sound speed. Now, the pre-sheath thickness can be
of order or greater than a collision length; therefore, a fraction of the ion's parallel energy gain through the pre-sheath can be transferred to its perpendicular energy via collisions
with the background gas atoms. Hence, the ion perpendicular energy at the sheath can be Te + (1 / 2)T
of the same order as its parallel energy: 2 n , which is considerably greater 2
than the initial ion energy Ton . For a collision-less sheath, ( which is typical of the
sheaths in our plasma: the sheath thickness for Te - 5eV and n, ; 10'2/cm3 is of order
20/,n and with bias it could grow to - 1001n, which is still much less than the collision
mean-free-path of 5cm), the perpendicular energy of the ions traversing the sheath will remain the same, and the parallel energy will increase approximately by
e(Vsheat - Vf) 25T 25eV, where
Vhth
=V,
- (1/2)T,:[
1.2
- 1]
Therefore, the ratio of the parallel to the perpendicular energy of the metal ion at
1 Eparal 3 Te + - Tion
the surface is Epr- 6 and the corresponding velocity ratio is
E 1 1
2 4 Ton
Vpara = 2.5. Looking at figure 1.1-6, we can see that the average angle of
Vperp
incidence of the metal ions with respect to the surface normal is small
Oinc= - a tan p .38rad = 22' , which is equivalent to stating that we have
, 2 Vperp
some directionality with room for improvement.
There are also electric fields perpendicular to the surface at the trench created by the side-walls, (which we have not included in our calculation of the directionality), but
most of the energy gain occurs far from the trench where the electric field is essentially parallel to the surface (the trench height h , 1.2,un whereas the sheath thickness as previously noted is of the order 20- 100pm ).
In summary, for the case of no substrate bias, the increase in the electron temperature increases the directionality of the ion flux, which decreases corner
deposition.
From the above analysis, one might conclude that increasing T, will improve the fill; not necessarily. To obtain a complete picture of T, 's influence on the fill quality, we need to account for T, 's influence on the remaining plasma surface parameters. How does T affect fcu+ /CuO and fc'u /Ar+ ? An increase in T, leads to a preferential ionization of the argon neutrals (the ionization energy for argon is about 16e V as
compared to 8eV for copper). To demonstrate this, we will analyze the reaction rate for ionization:
(--oionTi
2
exp(-
)cm3/sec, where
Eizis the ionization energy of the particular atom: (E u -8eV,E r 16eV)3
Now, the ratio of the ionization reactivities for copper and argon is
(ovLc E - E 8eV
('Cu eAr e exp TV)oc[1.2 - 21;
(0- Ar Te
therefore, an increase in the electron temperature will result in a greater increase in the ionization of argon relative to the ionization of copper. This preferential ionization of the argon atoms results in the increase of nAr+ (the argon ion bulk density) relative to nCu+
(the copper ion bulk density), thereby, decreasing fCu+ IA r+ at the substrate, which as
discussed results in enhanced corner deposition. Hence, even though an increase in T, can enhance the fill quality via the increase in the metal ion flux directionality
and the increase in the copper ionization (which will enhance fcu /Cuo at the
substrate), it can also degrade the fill quality via the resulting decrease in fCu /Ar.
2 NRL Plasma Formulary, p. 54 (1994)
1.3: THE INFLUENCE OF THE ARGON GAS ATOM DENSITY
no,: the gas (argon) atom density
The discussion about the electron temperature has hopefully illustrated the indirect influence (via changes in other bulk parameters) as well as the direct influence a plasma bulk parameter can have on the fill quality. This indirect influence will also manifest in our discussion of the gas atom density, but first we will discuss its lack of direct influence. There are three reasons for the gas atoms' benign nature with regard to direct influence on the fill evolution:
1. (no direct contribution to deposition):argon is an inert gas; therefore, it does not react chemically with the deposited copper
2. (no direct contribution to sputtering):the gas atoms gain their energy from the elastic collisions with the ions (they can't be accelerated by electric fields because they are neutral); the ions have energies of at most an eV; therefore,
the gas atoms can't gain enough energy to sputter the deposited copper (the energy threshold for sputtering is about 30eV ).
3. (no direct contribution to the directionality of the incoming copper flux):our process pressure is of order a mtorr , yielding a mean-free-path for copper-argon elastic collisions of order 5cm, which is much greater than the characteristic dimensions of the sheath (50gm) ; therefore, scattering of the incoming copper flux within the sheath is negligible.
Does the argon atom density have an indirect influence on the fill quality? Eq. 1.0-11 from the energy and particle conservation model shows that the electron temperature is
essentially inversely proportional to the atom density. Of course, the atom density has to include the contribution from the copper atoms as well as the argon gas atoms, but as mentioned before, the copper atom density is about 10% of the argon gas atom density, and the energy loss per electron-copper ion pair created (Ec) is comparable to the Ec for electron-argon ion pair production; therefore, the dominant influence will be from the argon atoms. Hence, a decrease in the argon atom density will result in an increase in the electron temperature (nAr l > electron-neutral ionization rate will decrease with respect to the rate of loss of electrons to the boundary for a given input power=> T to increase the ionization rate constant). We have already discussed the effect of an increase in Te on
the other plasma bulk parameters and their subsequent influence on the plasma surface parameters: an increase in the copper ion density and an even greater increase in the argon
bulk bulk ow,
ion density, resulting in the increase of f+/CuO and in the decrease of Ar Now, in our discussion about the electron temperature, we assumed that the modifications in the bulk parameters result in the same modifications in the surface
bup asub cubulk > /ArSU 1 . However, a
parameters: Cu/Cu U+/Cu u/Ar Cu/Ar
modification in these plasma surface parameters comprises two events:
bulk bulk
1. a modification in fc +/c u and fu+ Ar+
2. the subsequent transport of the copper particles to the substrate (argon is distributed everywhere in the chamber; whereas, the copper is sputtered from the target and needs to be transported to the substrate).
In our discussion about the electron temperature, we did not mention Te's influence on the transport of the copper particles to the substrate; however, Te has a
subtle influence on the transport as well. The increase in ()oni,,,at,,on for copper, resulting from the increase in the electron temperature, decreases the mean-free-path of ionization:
Cu
z (di udtiCun is the drift speed of the copper atoms. The decrease in
fP m nf e (Or)ionization
z not only increases Cu+/Cu , it also increases the number of copper atoms that are ionized near the target; once ionized, the copper ions are radially confined by the axial
magnetic field created by the electromagnets. This 'early' confinement increases the copper ion transport efficiency, q u ; therefore, we not only have a greater copper
ionized fraction within the bulk, but we trap a greater number of the copper atoms (via ionization) leaving the target. The enhanced transport efficiency increases fcu+cuo by complementing the increase in cu , but it reduces the decrease in fCublAr ' resuleting the decrease in buk
resulting from theAr . Therefore, the increase in the electron resulting from the decrease in gCu+/Ar+
temperature forces ru and fCu/Ar to compete in determining the outcome of
sub
u'Cu/Ar+
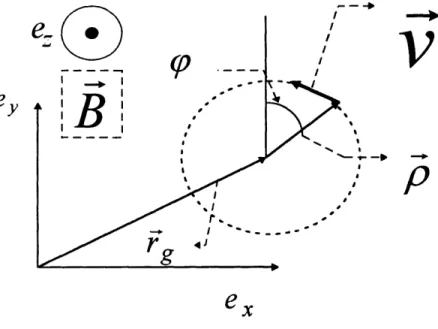
To demonstrate the copper ion confinement by the magnetic field, we will compare the radial diffusion of the copper neutrals to the diffusion of the copper ions. The
diffusion coefficient is generally defined as the product of the collision frequency with the square of the average step size between collisions: D =- vcotii~ (stepsize)2 , where
collision - nbackground (re la tive )collision is the product of the background atom density with
the collision cross-section averaged with the relative velocity of the colliding species over the velocity distribution function of the background species. The copper ions are forced to gyrate in the plane perpendicular to the field lines with a gyro-radius (Larmor radius) equal to the ratio of their perpendicular speed to the gyro-radian-frequency:
vp 2E cu ZellBlI
rvarmo-- armr per = , = , where IBI is the magnitude of the
mcu mcu
magnetic field, Epp is the copper energy perpendicular to the magnetic field direction, and Z = 1 for singly ionized copper. If the ions are 'magnetized'(which is equivalent to
VCision << 1 ; for argon pressure of 1 mtorr ,
IIBII
800Gauss near the target ,Cu + 7d2 -15c? Vcolhszon VperpfArO
E , eV and 9*10 2 cii pepAr 0.4), then their average step size is this Larmor radius. For the copper neutrals, the average step size is
1 the mean-free-path for collisions with the background argon gas atoms ,0 = nAr'T The collision frequency is essentially the same for both the copper neutral and ion. Hence, the ratio of the diffusion coefficients for the copper neutral and ion yields
D2 + Cu+ o2y 2EeperpCU
D c(ramor2 larmor sion 2
Dc
2 - (AP2 ".17:[1.3 2 -1]thereby demonstrating the better confpinement of the copper ions.
We have illustrated that a decrease in the argon atom density will increase the electron temperature, and that the increase in T will result in an increase in cu., , but we have not addressed the direct influence that the argon density will have on 77cu+ and Cu0, the copper ion and neutral transport efficiency. The direct influence of the argon density is
manifest in its control of the collision frequency (c nAr ) and the mean-free-path of collision (oc ~ ). As stated above, the radial diffusion of the copper particles is
nAr
dependent on the collision frequency and the step size between collisions; the decrease in the argon density will have two ramifications:
1. the decrease in the ion diffusion coefficient (oc vcolio,, ) accommodated by a
decrease in the neutral diffusion coefficient (oc A.0, ) 2. the increase in the magnetization of the ions (magnetized
ions >> : for the ions to be considered 'magnetized', the ratio of
the ion cyclotron frequency to the collision frequency needs to be much greater than one; the ion can not be considered magnetized if it can not complete at least one gyro-orbit without experiencing a collision).
Now, remember that ascribing the step size of the ion to be its Larmor radius is only valid if the ion can be considered magnetized; a significant reduction in the ion magnetization ( on 1) will drive the ion step size towards the neutral step size