WATER USE IN LCA
Review of methods addressing freshwater use in life cycle
inventory and impact assessment
Anna Kounina&Manuele Margni&Jean-Baptiste Bayart&Anne-Marie Boulay& Markus Berger&Cecile Bulle&Rolf Frischknecht&Annette Koehler&
Llorenç Milà i Canals&Masaharu Motoshita&Montserrat Núñez& Gregory Peters&Stephan Pfister&Brad Ridoutt&Rosalie van Zelm& Francesca Verones&Sebastien Humbert
Received: 5 January 2012 / Accepted: 10 October 2012 / Published online: 27 October 2012 # The Author(s) 2012. This article is published with open access at Springerlink.com
Abstract
Purpose In recent years, several methods have been devel-oped which propose different freshwater use inventory schemes and impact assessment characterization models considering various cause–effect chain relationships. This work reviewed a multitude of methods and indicators for
freshwater use potentially applicable in life cycle assess-ment (LCA). This review is used as a basis to identify the key elements to build a scientific consensus for operational characterization methods for LCA.
Methods This evaluation builds on the criteria and proce-dure developed within the International Reference Life
Responsible editor: Matthias Finkbeiner
Electronic supplementary material The online version of this article (doi:10.1007/s11367-012-0519-3) contains supplementary material, which is available to authorized users.
A. Kounina
Ecole Polytechnique Fédérale de Lausanne, Route Cantonale,
1015 Lausanne, Switzerland
A. Kounina (*)
:
M. Margni:
S. Humbert Quantis, Lausanne, Switzerland e-mail: [email protected] J.-B. Bayart Quantis, Paris, FranceM. Margni
:
A.-M. Boulay:
C. Bulle CIRAIG, École Polytechnique of Montréal, 2900 Edouard-Monpetit 6079,Montréal, QC H3C 3A7, Canada J.-B. Bayart
Veolia,
20-22 rue de Clichy, 75009 Paris, France M. Berger
Department of Environmental Technology, Technical University of Berlin,
10623 Berlin, Germany
R. Frischknecht ESU Service Ltd, Kanzleistrasse 4, 8610 Uster, Switzerland
A. Koehler
:
S. Pfister:
F. VeronesETH Zurich, Institute of Environmental Engineering, 8093 Zurich, Switzerland A. Koehler PE International, Jaegerstrasse 20, 8406 Winterthur, Switzerland L. Milà i Canals
Safety and Environmental Assurance Centre, Unilever R&D, Colworth Science Park, Sharnbrook,
Bedford MK44 1LQ, UK M. Motoshita
National Institute of Advanced Industrial Science and Technology, Tsukuba, Japan
M. Núñez LBE-INRA, Avenue des Etangs, 11100 Narbonne, France
Cycle Data System Handbook and has been adapted for the purpose of this project. It therefore includes (1) description of relevant cause–effect chains, (2) definition of criteria to evaluate the existing methods, (3) development of sub-criteria specific to freshwater use, and (4) description and review of existing methods addressing freshwater in LCA. Results and discussion No single method is available which comprehensively describes all potential impacts derived from freshwater use. However, this review highlights several key findings to design a characterization method encompassing all the impact pathways of the assessment of freshwater use and consumption in life cycle assessment framework as the fol-lowing: (1) in most of databases and methods, consistent freshwater balances are not reported either because output is not considered or because polluted freshwater is recalculated based on a critical dilution approach; (2) at the midpoint level, most methods are related to water scarcity index and corre-spond to the methodological choice of an indicator simplified in terms of the number of parameters (scarcity) and freshwater uses (freshwater consumption or freshwater withdrawal) con-sidered. More comprehensive scarcity indices distinguish dif-ferent freshwater types and functionalities. (3) At the endpoint level, several methods already exist which report results in units compatible with traditional human health and ecosystem quality damage and cover various cause–effect chains, e.g., the decrease of terrestrial biodiversity due to freshwater con-sumption. (4) Midpoint and endpoint indicators have various levels of spatial differentiation, i.e., generic factors with no differentiation at all, or country, watershed, and grid cell differentiation.
Conclusions Existing databases should be (1) completed with input and output freshwater flow differentiated according to
water types based on its origin (surface water, groundwater, and precipitation water stored as soil moisture), (2) regional-ized, and (3) if possible, characterized with a set of quality parameters. The assessment of impacts related to freshwater use is possible by assembling methods in a comprehensive methodology to characterize each use adequately.
Keywords Ecosystem quality . Freshwater use . Human health . Life cycle assessment . Method review . Resources
1 Introduction
Water is a vital natural resource for all ecosystems, human well-being, and many economic activities. Because of the combina-tion of populacombina-tion growth and economic development leading to increasing human freshwater use (Vörösmarty et al.2000) and enhanced climate change effects on the global water cycle, water scarcity is becoming an increasing environmental con-cern. Although freshwater is a local resource, water scarcity is leading to the threat of a global water crisis, with a large share of global population being affected (World Water Assessment Programme UN 2009). Given the actual estimates of global freshwater consumption around 2,600 km3/year and a proposed planetary boundary of 4,000 km3/year consumptive surface and groundwater use (Rockström et al.2009), it appears that the humanity’s freshwater use is currently within the safe operating limit (Shen et al.2008; Alcamo et al.2007). Other sources estimate the actual water withdrawal as less than 10 % of the maximum available renewable freshwater resource (Oki and Kanae 2006). However, when considering the regional nature of freshwater scarcity, the majority of global freshwater withdrawals currently takes place in watersheds already expe-riencing high water scarcity (Ridoutt and Pfister 2010a). According to Ridoutt and Pfister (2010a), the humanity’s water footprint (referred as the sum of withdrawals multiplied by local water stress indices) must be globally reduced by approx-imately 50 % to achieve a sustainable water use. The strong bond between water use and other global environmental and societal systems at various spatial scales such as land use, climate change, and demographic developments justifies both global and regional perspectives for water management to tackle water-related problems (Hoff2009; Hoekstra2011).
To tackle this major environmental concern, various initia-tives were recently launched in order to develop and standard-ize analytical tools to measure and assess freshwater use at regional and global scale and to improve the overall manage-ment of freshwater resources as well as the overall environ-mental performance of products and operations. Among these initiatives are the Water Footprint Network (WFN) (Hoekstra et al.2011), the International Organization for Standardization (ISO) water footprint working group (ISO/TC207/SC5/WG8, ISO 14046 draft), and the World Business Council for
G. Peters
Department of Chemical and Biological Engineering, Chalmers University of Technology,
412 96 Gothenburg, Sweden S. Pfister Aveny GmbH, Schwandenholzstrasse 212, 8046 Zurich, Switzerland S. Pfister
Bren School of Environmental Science and Management, University of California,
Santa Barbara, CA 93106, USA B. Ridoutt
Department of Sustainable Agriculture National Research Flagship, Commonwealth Scientific and Industrial Research Organisation (CSIRO),
Clayton South, VIC 3169, Australia R. van Zelm
Department of Environmental Science, Radboud University, 6500 GL Nijmegen, Netherlands
Sustainable Development (WBCSD2010) who launched the Global Water Tool and the United Nations Environment Programme (UNEP)/Society of Environmental Toxicology and Chemistry (SETAC) Life Cycle Initiative’s working group on the assessment of freshwater use and consumption in life cycle assessment (LCA) called“WULCA” (Koehler and Aoustin2008). These initiatives also aim to set up public– private partnerships to assist companies in the implementation of water sustainability policies (CEO Water Mandate2007) and to develop certification programs (AWS2009).
The authors of this article are part of the UNEP/SETAC Life Cycle Initiative’s WULCA working group (Koehler and Aoustin2008), which involves academic and industrial part-ners from around the globe who cooperate on the development of methodologies related to freshwater use from a life cycle perspective, including both appropriate freshwater accounting schemes and impact assessment methods. Guidance is provid-ed as scientific consensus regarding the consideration of freshwater in life cycle inventory (LCI) and the choice of life cycle impact assessment (LCIA) methods. Quantitative com-parison of LCIA methods will be provided as next step of this work. The working group’s deliverables are also used as methodological input to the ISO 14046 water footprint stan-dardization process. A prominent achievement of WULCA was a general framework for the consideration of freshwater resources within LCA (Bayart et al.2010). This work provid-ed recommendations on freshwater use modeling and relevant impact categories building on the achievements of phase 1 of the UNEP/SETAC Life Cycle Initiative (Bauer et al.2007) and the conceptual framework including first indicators intro-duced by Owens (2001).
In the past, most LCA studies did not consider freshwater use, and LCI databases reported freshwater use inventory by determining the total freshwater input from nature or respec-tive technical systems (e.g., drinking water networks) while generally neglecting the water outputs from the LCA system under study (Koehler 2008). LCIA methods applied the amount of freshwater used without characterization factor to address the impacts. Recently, new methodologies were de-veloped which propose freshwater use inventory schemes (Boulay et al.2011a; Peters et al.2010; WBCSD2010) and assess the potential environmental impacts of freshwater use considering various cause–effect relationships (Milà i Canals et al.2009; Motoshita et al.2010b; Pfister et al.2009).
A selection of scientific methods for freshwater use assess-ment in LCA was evaluated by Berger and Finkbeiner (2010) regarding the methods’ scope, input data requirements, and the ISO compliance summarizing the methodological differ-ences. Considering the latter study, the WULCA working group has performed an extensive analysis of a broader variety of freshwater use assessment schemes and metrics applied both in the field of life cycle assessment and water manage-ment. In contrast to Berger and Finkbeiner (2010), this work
employs a detailed and systematic analysis to understand differences and similarities in modeling choices using a com-prehensive set of evaluation criteria including scientific ro-bustness, transparency and reproducibility, applicability, the level of documentation, and stakeholder acceptance. It is based on the International Reference Life Cycle Data System (ILCD) (JRC-IES2011).
The goal of the current method review is to provide (1) a comprehensive overview of existing and applicable inven-tory and impact assessment methods that address freshwater use in a life cycle perspective, (2) an analysis of each method with a set of predefined criteria in order to highlight and understand similarities and differences, (3) an analysis of key parameters to be considered in a consensus-based operational characterization method encompassing the WULCA framework (Bayart et al.2010), and (4) prelimi-nary application recommendations for practitioners given current state of the art. This study comprises methods for inventorying the use of different freshwater resources as well as for assessing the associated impacts. Methods assessing specific impact of pollutants, i.e., aquatic ecotox-icity, human toxecotox-icity, aquatic eutrophication, and aquatic acidification, as well as the recent method dealing with impacts of changed freshwater temperatures due to cooling freshwater discharges (Verones et al.2010) are not included in this work as they are generally assessed in conventional impact categories of LCA or oriented towards quality-related impact.
2 Methods
The review scheme adopted relies on the approach taken by the European Commission within the International Reference Life Cycle Data System defining the“framework and requirements for LCIA models and indicators” (JRC-IES 2011). The following procedure was followed for the methods review: (1) description of relevant cause–effect chains, (2) definition of criteria to evaluate the existing methods, (3) development of sub-criteria specific to water use, and (4) description and review of existing fresh-water use assessment methods.
2.1 Description of relevant cause–effect chains
Figure1depicts the cause–effect chains that link freshwater type and use to potential impacts at the mid- and endpoint level and, ultimately, to the related area of protection of human health, ecosystem quality, and resources (Jolliet et al. 2004). The identified cause–effect chains serve as basis for the development of specific criteria linked to freshwater use. In nature, precipitation water (liquid or solid) is differ-entiated in three types of water that are interconnected: (1)
surface water (river, lake, and sea), (2) groundwater (renew-able, shallow, and deep) that is only reached through surface water and soil moisture, and (3) precipitation water stored as soil moisture (also called“green water”) (Falkenmark and Rockstrom 2006). Fossil groundwater compartment is not connected to other freshwater compartments. Freshwater is characterized by less than 1,000 ml/l of dissolved solids (USGS 2012) and encompasses all previously mentioned three types. The impact of freshwater use is related to (1) consumption of one of these water types and (2) withdrawal of one of these water types and release of surface water. Impact of degradative use is considered as withdrawal of surface or groundwater at a given quality followed by re-lease at another quality. However, impact of direct pollutant release in freshwater and resulting cause–effect chains are excluded from the scope of this study, in which there is no value judgment regarding the inclusion of degradative use in considered methods. Related impact assessment approaches are assessed in the ILCD handbook (JRC-IES 2011). Land occupation and transformation as well as rainwater harvesting are a driver for a change in surface water and precipitation
water stored as soil moisture. The availability of the latter water type leads to debated potential impacts that are not considered in this work. However, the modification of the hydrological balance following land transformation or occu-pation is accounted for in the present framework as it corre-sponds to a modification of the amount of water that reaches the groundwater and surface water (equivalent to a consump-tion of the corresponding water).
The use of freshwater can generate potential impacts to humans, the ecosystems, and resources. These impacts can be related to water scarcity, water functionality, water eco-logical value, and water renewability rate and are influenced by the possibility to develop compensation mechanisms. Water scarcity is defined in this work being the water use approaching or exceeding the natural regeneration of water in a given area, e.g., a drainage basin. In this article, water scarcity is considered as a parameter leading to freshwater deprivation by limiting freshwater availability. Freshwater quality is defined as a set of parameters considered to characterize the chemical, physical, and biological proper-ties of freshwater. It is related to a functionality approach,
Fig. 1 Cause–effect chains leading from the inventory to the areas of protection of human health, ecosystem quality, and resources (adapted from Bayart et al.2010)
which assesses to which users the freshwater withdrawn and released are functional (Bayart et al. 2010), and can also lead to water deprivation when water of a given quality is not available anymore for specific users. Water ecological value describes the physical relation to and dependency of ecosystems on freshwater (Bayart et al.2010). Water renew-ability rate is the natural rate at which the resource is recharged. Compensation mechanisms refer to the use of backup technologies by human users deprived of “function-al” freshwater to meet their needs (Boulay et al.2011b). 2.1.1 Human health
The way human health is affected by freshwater use depends on the level of economic development and welfare (Boulay et al.2011b; Bayart2008). If this is sufficient, the lack of freshwater will be compensated by the development of backup technologies [such as desalination or the import of water-intensive goods as virtual water (Allan1996)]. These compensation activities need to be assessed with a new inventory and can, in turn, lead to environmental impacts via other interventions involved in the compensation activ-ities (e.g., climate change impacts caused by energy con-sumption for desalination). If the level of economic development is not sufficient to cover these costs, freshwa-ter use will lead to wafreshwa-ter deprivation for primarily three functions which fulfill essential human needs depending on local conditions: domestic use (hygiene and ingestion), agriculture, and aquaculture/fisheries. Industrial functions of freshwater closed to human essential needs (e.g., house building and provision of pharmaceuticals) are not consid-ered in this framework because they are more likely to consider compensation strategies rather than suffering from freshwater deprivation (Boulay et al.2011b). Water quality degradation leads to water deprivation when it creates a loss of functionality for users who need water at a higher quality level than the released one. Users who are able to use freshwater at that or a lower quality level would not be deprived. The extent of water quality degradation depends on the amount and intensity of chemical, biological, and thermal pollution withdrawn and is related to the sanitation capacity. The withdrawn freshwater represents an adverse impact depriving users from a given amount of water at ambi-ent water quality; the released freshwater (negative LCI flow) results in a burden reduction by making available the same amount of water for users capable to use water at that quality. Current models agree that the way human health is affected by water use depends on the level of economic development and welfare. They acknowledge that under given conditions, water use can lead to deprivation for essential human needs such as agriculture, fisheries, and domestic use and ultimately to mal-nutrition and spread of diseases. However, there is currently no sufficient information to determine whether freshwater use in a
low-income water-stressed region would lower water availabil-ity for domestic users or rather only affect other users, e.g., agricultural, fisheries, or industries (Boulay et al.2011b).
Malnutrition and spread of diseases are interconnected, i.e., malnutrition could, for example, make a person more vulner-able to the spread of diseases, and reciprocally, some enteric diseases could affect the ability to absorb nutrients and thus contribute to malnutrition. Freshwater use ultimately leads to an aggregated impact on human health, generally expressed in disability-adjusted life years (Motoshita et al. 2010a, b; Boulay et al.2011b; Pfister et al.2009).
2.1.2 Ecosystem quality
Water use can also affect the ecosystem, for instance, by changes in the river, lake, or wetland flow quantity (e.g., due to surface water withdrawals); changes in the level of the groundwater table (e.g., due to groundwater withdrawal); changes in flow regimes (e.g., due to turbined water use); and loss of freshwater quality. Similarly to human health, degradation corresponds to the consumption of freshwater of a higher quality (with a higher ecological value or eco-logical functionality) and the release of freshwater of lower quality (with a lower ecological value, thus affecting all the ecological users needing a better water quality, but not the users able to deal with a lower quality).
It should be noted that the latter cause–effect chain is related to the deprivation of freshwater of a given quality and not to the aquatic ecotoxicity, aquatic eutrophication, and aquatic acidifi-cation impact of this degradation. The midpoint impacts related to freshwater deprivation, which depend on water scarcity and water quality, eventually lead to species diversity change in aquatic and terrestrial ecosystems. The extent of these changes depends on the ecological value of water in the considered ecosystem. Ultimate impacts on ecosystem quality are com-monly expressed in potentially disappeared fraction (PDF) of species on a given surface or volume during a given time (PDF per square meter per year or PDF per cubic meter per year) (van Zelm et al.2011; Hanafiah et al.2011).
Milà i Canals et al. (2009) suggest that changes caused by production systems on the amount of rainwater available to other users (ecosystems) through changes in the fractions of rainwater that follow infiltration, evapotranspiration, and runoff should be included as impacts on ecosystem quality. This is closely linked to the impact of land occupation and transformation on green water availability through the var-iation of stock of water stored as soil moisture available for plant uptake (green water).
2.1.3 Resources
Consumption of all freshwater types as well as withdrawal and release of fossil groundwater can respectively lead to overuse
of renewable water bodies or exhaustion of nonrenewable fossil groundwater. Overuse of renewable water bodies depends on the water renewability rate. These midpoint impacts affect water flows and funds and ultimately have an effect on the resources stock. This reduction of available water affects other cause–effect chains by increasing local water scarcity. Different approaches exist to characterize the impact on resources encompassing the abiotic depletion potential given in antimony equivalents (Sb-eq) (Milà i Canals et al. 2009) at the midpoint level, and the backup technology con-cept expressing the resource damage in megajoules (MJ) surplus energy- (Pfister et al.2009) or exergy-based methods given in megajoules of exergy (MJex) (Boesch et al.2007) at the endpoint level.
2.2 Definition of criteria to evaluate the existing methods Five scientific (1–5) criteria and one potential stakeholder acceptance (6) criterion based on the ILCD Handbook (JRC-IES2011) were adopted within this review: (1) completeness of scope; (2) environmental relevance; (3) scientific robust-ness and certainty; (4) documentation, transparency, and re-producibility; (5) applicability; and (6) degree of potential stakeholder acceptance and suitability for communication in business and policy contexts. They are further described in Table S5in theelectronic supplementary material.
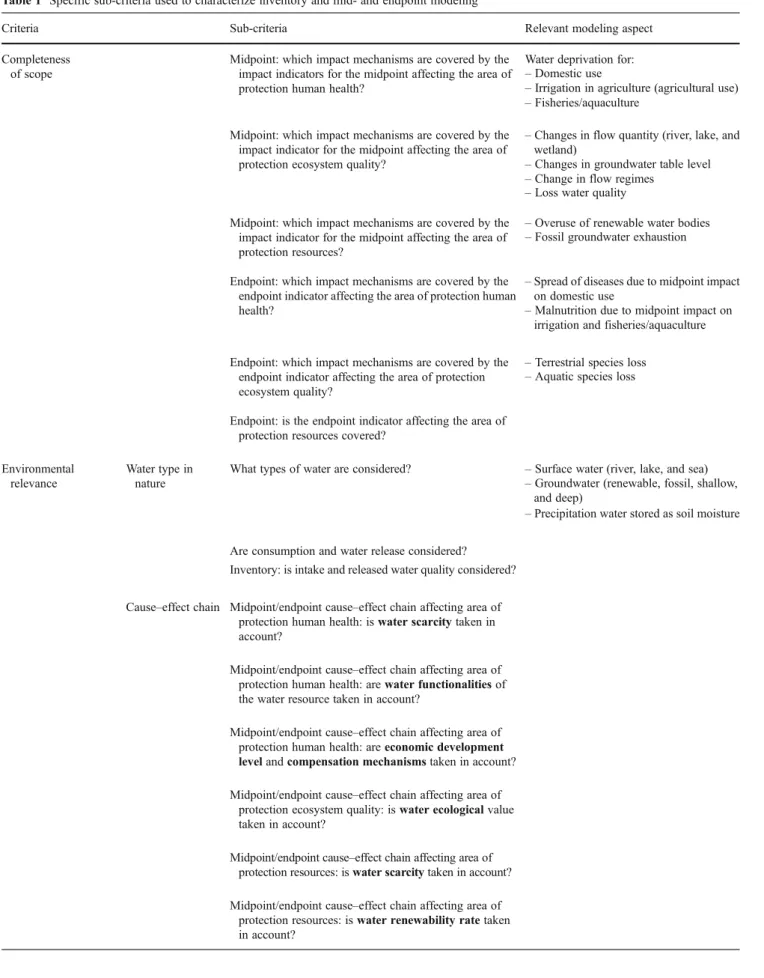
2.3 Development of sub-criteria specific to freshwater In addition to the six criteria mentioned above, sub-criteria specific to freshwater use were added in the criteria “com-pleteness of scope” and “environmental relevance” as de-scribed in Table1. For the former, sub-criteria were needed to identify which areas of protection are considered by the existing methods and which mid- and endpoints are modeled. For the latter, sub-criteria were needed to evaluate the cover-age of relevant freshwater-specific cause–effect chains as depicted in Fig.1. The level of coverage was assessed without weighting the relative importance of different cause–effect chains and related parameters, but rather by exploring how far and with which method this coverage has been performed. 2.4 Description and review of existing freshwater use assessment methods
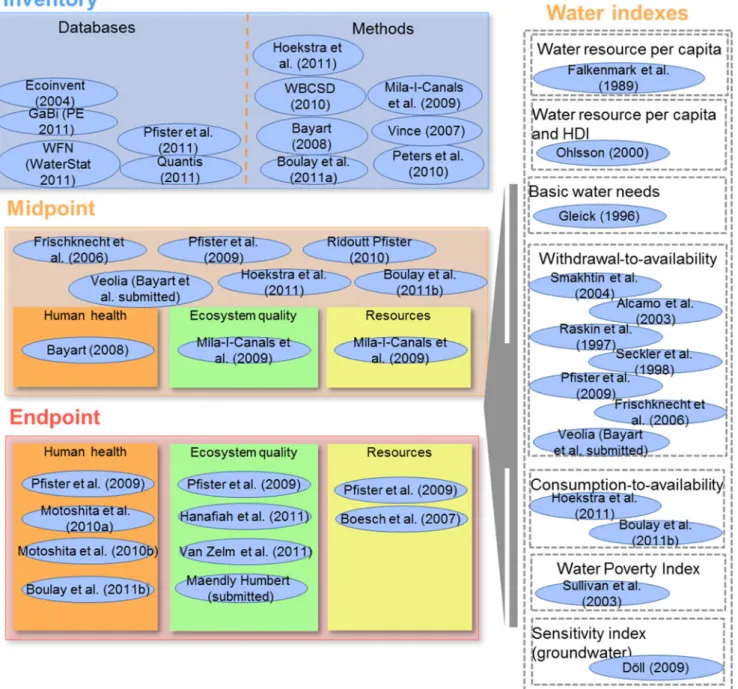
Various methods have been developed to evaluate freshwater use in LCA. Many of them were already published or in the process of being published. All methods addressing freshwa-ter use supported by sufficient documentation to be analyzed, i.e., a draft article, a report, etc., were considered in this paper. Unpublished methods were assessed regarding the latest in-formation available in June 2012. Figure2 summarizes the reviewed methods and classifies them at the inventory level,
water index level, or impact assessment level, distinguishing between mid- and endpoint assessments. It identifies those specifically addressing one area of protection or more com-prehensive methods that address more than one area of pro-tection. Databases are called according to the database name and methods according to the name of the developer for academic work, e.g., Boulay (Boulay et al. 2011b) or the industry for methodology developed within a company, e.g., Veolia. A short description of assessed methods is provided in thesupporting information.
2.4.1 Inventory databases
The inventory section contains both inventory databases and inventory methods. The ecoinvent database (Frischknecht et al.2004; Ecoinvent2007) and GaBi database (PE2011) are widely used databases and contain elementary flows for fresh-water withdrawal and turbined fresh-water. The WFN database (Water Footprint Network2011) assesses the inventory con-sumptive and degradative flows of crops and derived crop products, farm animals, and animal products; biofuels; nation-al consumption and production; as well as trade in crop and animal and industrial products according to the WFN method (Water Footprint Network 2011). Pfister et al.’s database (Pfister et al.2011) assesses the freshwater consumption for the production of 160 crops. An additional source of data for consumptive and evapotranspirative use can be found for five crops and three livestock products (Hanasaki et al.2010). The Quantis water database (Quantis2011) is a database of water uses based on ecoinvent 2.2 developed in the aim of providing industrial stakeholders with datasets required to apply all existing impact assessment methods.
2.4.2 Inventory methods
Inventory methods generally suggest concepts for a systematic classification of freshwater elementary flows according to their type (surface water, groundwater, precipitation water stored as soil moisture, whether intake water quality is considered, etc.) without providing respective data. Inventory methods also describe technical water flows such as cooling water and irri-gation water. The reviewed inventory methods differ widely in their objective and level of detail. Some focus on defining water categories to allow quality to be considered (Vince 2007; Bayart2008; Boulay et al.2011a), and others, on pro-viding inventory tools for organizations (Hoekstra et al.2011; WBCSD2010), integrating the effects of direct water use and of land occupation and transformation on water availability in a comprehensive methodology (Milà i Canals et al. 2009), or providing detailed hydrological modeling and classification of freshwater use data in specific sectors (e.g., Australian red meat sector) (Peters et al.2010). Boulay et al. (2011a) was built on Vince’s (2007) and Bayart’s (2008) methods.
Table 1 Specific sub-criteria used to characterize inventory and mid- and endpoint modeling
Criteria Sub-criteria Relevant modeling aspect Completeness
of scope
Midpoint: which impact mechanisms are covered by the impact indicators for the midpoint affecting the area of protection human health?
Water deprivation for: – Domestic use
– Irrigation in agriculture (agricultural use) – Fisheries/aquaculture
Midpoint: which impact mechanisms are covered by the impact indicator for the midpoint affecting the area of protection ecosystem quality?
– Changes in flow quantity (river, lake, and wetland)
– Changes in groundwater table level – Change in flow regimes
– Loss water quality Midpoint: which impact mechanisms are covered by the
impact indicator for the midpoint affecting the area of protection resources?
– Overuse of renewable water bodies – Fossil groundwater exhaustion
Endpoint: which impact mechanisms are covered by the endpoint indicator affecting the area of protection human health?
– Spread of diseases due to midpoint impact on domestic use
– Malnutrition due to midpoint impact on irrigation and fisheries/aquaculture
Endpoint: which impact mechanisms are covered by the endpoint indicator affecting the area of protection ecosystem quality?
– Terrestrial species loss – Aquatic species loss
Endpoint: is the endpoint indicator affecting the area of protection resources covered?
Environmental relevance
Water type in nature
What types of water are considered? – Surface water (river, lake, and sea) – Groundwater (renewable, fossil, shallow,
and deep)
– Precipitation water stored as soil moisture
Are consumption and water release considered? Inventory: is intake and released water quality considered?
Cause–effect chain Midpoint/endpoint cause–effect chain affecting area of protection human health: is water scarcity taken in account?
Midpoint/endpoint cause–effect chain affecting area of protection human health: are water functionalities of the water resource taken in account?
Midpoint/endpoint cause–effect chain affecting area of protection human health: are economic development level and compensation mechanisms taken in account? Midpoint/endpoint cause–effect chain affecting area of
protection ecosystem quality: is water ecological value taken in account?
Midpoint/endpoint cause–effect chain affecting area of protection resources: is water scarcity taken in account? Midpoint/endpoint cause–effect chain affecting area of
protection resources: is water renewability rate taken in account?
2.4.3 Midpoint assessment methods
Midpoint impact assessment methods give an indicator either common to all areas of protection or specific to a defined area of protection. Methods covering all area of protections giving a single index related to water scarcity include the Swiss ecolog-ical scarcity (Frischknecht et al. 2006; Pfister et al. 2009; Ridoutt and Pfister2010b), Water Impact Index of Veolia,
Boulay et al. (2011b) methods, and Water Footprint impact indices (Hoekstra et al.2011). Area of protection-specific mid-point indicators describe the impact pathway leading to a decrease in freshwater availability for contemporary human users (Bayart2008), as well as changes in freshwater availabil-ity for ecosystems leading to freshwater ecosystem impacts (Milà i Canals et al.2009) and changes in groundwater avail-ability causing freshwater depletion (Milà i Canals et al.2009).
Fig. 2 Scope of and relationship between the available freshwater use inventory and impact assessment methods with classification for the three areas of protection
Milà i Canals et al. (2009) suggest to use different types of water indices (Smakhtin et al.2004; Falkenmark et al.1989; Raskin et al.1997) to assess freshwater ecosystem impacts. Falkenmark et al.’s (1989) index focuses on human use by evaluating the fraction of the total annual runoff available for human use. Raskin et al. (1997) use a water use per resource refined by Smakhtin et al. (2004) by subtracting environmental freshwater requirements from the available resources to derive a water index focused on freshwater resources available for human use.
The overall“blue-green-gray water” footprint concept of Hoekstra et al. (2011) was generally classified as an inventory metric, given that precipitation water stored as soil moisture evapotranspirated by plants (“green water footprint”) and consumptive use of surface and groundwater (“blue water footprint”) represent physical metrics and are not further char-acterized. However, the gray water footprint can also be evaluated as a midpoint approach as gray water footprint denotes degradative freshwater use by characterizing the chemical pollution in water similar to “the critical dilution volumes approach”,1
i.e., an equivalent amount of water needed to dilute an emission below an acceptable threshold. This method thus juxtaposes measurable inventory results of “blue” and green water footprint with a theoretical volume of “gray water” which corresponds to a characterized inventory results. Using the term gray water also creates the problem of having two competing definitions of this term circulating in the water industry2(Henriques and Louis2011).
2.4.4 Endpoint assessment methods
Endpoint impact assessment methods provide specific indi-cators for potential damages on the areas of protection of human health (Boulay et al.2011b; Motoshita et al.2010b, a; Pfister et al. 2009), ecosystem quality (Hanafiah et al. 2011; Pfister et al.2009; van Zelm et al.2011), and resour-ces (Pfister et al.2009; Boesch et al.2007).
Other approaches exist to estimate impact on resources that attempt to account for the emergy flows put into place by natural processes to make available a given resource at a given state (Zhang et al.2010; Rugani et al.2011) but are not evaluated in this review because they are not specific to the characteristics of freshwater resource. Emergy is defined as the measure of both the work of nature and that of humans in generating products and services, i.e., a record of previously used-up available energy that is a property of the smaller amount of available energy in a transformed product (Odum1996).
2.4.5 Water indices
Water indices are originally non-LCA-based indicators that express a measure of human and environmental water needs or of the fraction of resource available to meet these needs. Water indices can be used as characterization factors for mid-point (Raskin et al.1997; Smakhtin et al.2004; Falkenmark et al.1989) and endpoint (Sullivan et al.2003; Döll2009) impact assessment methods when applied to freshwater consumptive or degradative use. Such indices can be considered as human use oriented (Gleick1996; Falkenmark et al.1989; Ohlsson2000; Seckler et al.1998; Sullivan et al.2003; Döll2009), ecosystem use oriented (Smakhtin et al.2004), or cover all three areas of protection (Alcamo et al.2007; Raskin et al.1997; Pfister et al. 2009; Frischknecht et al.2006; Hoekstra et al.2011; Boulay et al.2011b). In this work, the terminology“water scarcity index” is related solely to withdrawal-to-availability ratio (Smakhtin et al.2004; Alcamo et al.2007; Raskin et al.1997; Seckler et al. 1998; Pfister et al.2009; Frischknecht et al.2006; Bayart et al. submitted) or consumption-to-availability ratio (Boulay et al. 2011b; Hoekstra et al.2011). Water scarcity indices can be based solely on a measure of water scarcity or include, additionally, a measure of water quality (Boulay et al.2011b). The details of the implementation of water indices in a LCA context, i.e., the water type to be considered in the inventory phase, needs to be specified in order to make water indices applicable in a method. 2.4.6 Uncertainty
Uncertainties are generally large in life cycle impact assess-ment, especially on the endpoint level, and are yet generally not quantified in most of methods. Only a few authors, i.e., Pfister and Hellweg (2011), reported uncertainties for human health and WSI indicators on watershed and country level.
3 Results and discussion on method evaluation and cross comparison
The methods were evaluated and compared according to the selected criteria and sub-criteria displayed in Table1and S5 at the inventory, midpoint, and endpoint levels, and key differences were identified. Tables S1, S2, and S3 in the electronic supplementary materialprovide a summary of the review for each method.
3.1 Inventory databases
While the ecoinvent (Frischknecht et al. 2004; Ecoinvent 2007), GaBi (PE2011), and Quantis (Quantis2011) databases give the opportunity to distinguish freshwater input as water withdrawal according to its natural source [surface water (river and lake) or groundwater (renewable and fossil)], in
1The critical dilution volume approach characterizes each emission in
terms of the volume of water required to dilute an emission to reach the legal limit set for that emission.
2
In the water industry, gray water is nutrient-rich sewage from house-holds which lacks fecal or urine contamination.
the WFN database (Water Footprint Network 2011) and Pfister et al.’s datasets (Pfister et al. 2011), water input is restricted to consumption of precipitation water stored as soil moisture evapotranspirated by plants (so-called green water footprint) as well as consumption of surface and groundwater combined (so-called blue water footprint). All datasets con-sider water outputs and global water balances in a different manner. The ecoinvent datasets in their current version 2.2 do not allow the determination of water balances because water releases are not reported, water consumption being thus an unknown part of the withdrawal. In contrast, GaBi and Quantis databases contain water inputs and outputs for all fore- and background processes. The WFN database (Water Footprint Network2011) considers volumetric estimations of water consumption through blue and“green” water footprint, while degradative use is expressed through the gray water concept, where pollutant persistence, inter-compartment transfer, and bioaccumulation properties are only implicitly included in water quality standard definitions which exist for a reduced set of substances. Only the Quantis water database considers water evaporated from reservoirs. The WFN and GaBi databases, the Quantis water database, and Pfister et al.’s datasets provide regionalized data per country which were appropriate in regards to the product (global commodities or region-specific products).
3.2 Inventory methods
The water flow classification of Boulay et al. (2011a) and the Global Water Tool of the WBCSD (2010) distinguish water according to its origin (e.g., surface and groundwater) and account for water balances by using input–output inventories. Milà i Canals et al.’s (2009), Peters et al.’s (2010), and WFN (2011) methods account only for consumptive water use of soil moisture lost by evapotranspiration (green water) as well as evaporated surface and groundwater flows. Boulay et al.’s method, which is an upgraded version of Vince’s (2007) and Bayart’s (2008) methods, is more comprehensive, as it enables to classify 11 input and output water inventory flows by using corresponding water quality classes based on 137 parameters. 3.3 Midpoint assessment methods
Water indices used in midpoint methods are based on a withdrawal-to-availability ratio (Pfister et al. 2009; Ridoutt and Pfister2010b; Frischknecht et al.2006; Milà i Canals et al.2009) or a consumption-to-availability ratio (Boulay et al. 2011b; Hoekstra et al.2011). They are used as a characteriza-tion factor for freshwater use in life cycle impact assessment to assess the impact of water consumption (Pfister et al.2009; Ridoutt and Pfister2010b; Frischknecht et al.2006; Boulay et al.2011b; Hoekstra et al.2011; Milà i Canals et al.2009) and water degradation (Hoekstra et al.2011; Boulay et al.2011b;
Ridoutt and Pfister 2010b). Ridoutt and Pfister’s (2010b) index is an extended version of Pfister et al.’s approach (2009), given that degradative water use (gray water) is in-cluded additionally to consumptive use (“blue water con-sumption”). The Water Footprint Network’s impact indices (green, blue, and gray water footprint impact indices) (Hoekstra et al.2011) follow the same concept by applying blue, gray, and green water scarcity indices to corresponding water categories. The Water Impact Index and Boulay et al.’s (2011b) index both include water quality as a parameter, additionally, to water scarcity considering that water quality parameters could restrict its use by humans and the natural environment as defined in Fig.1. Storage capacity has been considered in Pfister et al. (2009) as it is strongly related to water deprivation (deprivation occurs only if storage capacity is insufficient or if much of the stored water is evaporated).
Most of the methods provide characterization factors dif-ferentiated by country (Frischknecht et al.2006; Bayart2008; Pfister et al. 2009; Milà i Canals et al. 2009; Ridoutt and Pfister2010b; Boulay et al.2011b), watershed (Frischknecht et al. 2006; Water Footprint Network 2011; Boulay et al. 2011b; Pfister et al. 2009), or grid cell (Pfister et al. 2009; Ridoutt and Pfister2010b). The Water Footprint Network blue water footprint impact indices provide characterization factors with monthly temporal differentiation (Hoekstra et al.2011) and thus offer more temporal precision for impact evaluation. However, storage of water is not included. Milà i Canals et al. (2009) methods on freshwater depletion do not provide regionalized characterization factors.
3.4 Endpoint assessment methods 3.4.1 Human health
The impact pathways covered by current methods regarding human health include the lack of freshwater for hygiene and ingestion resulting in the spread of communicable diseases (Motoshita et al.2010b; Boulay et al.2011b), water depri-vation for irrigation causing in malnutrition (Pfister et al. 2011; Motoshita et al. 2010a; Boulay et al. 2011b), and water deprivation for freshwater aquaculture and fisheries resulting in loss of productivity and food supply (Boulay et al.2011b). Indirect impact of freshwater use, i.e., impact on human health and conflict creation, is not covered by exist-ing methods. The cause–effect chain modelexist-ing is based on hydrological and socioeconomical data (Pfister et al.2009; Boulay et al. 2011b; Motoshita et al. 2010b, a). Some of them consider the water scarcity index used at the midpoint level (Pfister et al.2009; Boulay et al.2011b). The level of economic development is considered in studied methods through parameters such as Human Development Index (Pfister et al. 2009), house connection to water supply (Motoshita et al. 2010b), or adaptation capacity based on
gross national income (Boulay et al.2011b). All methods consider the reduction of human health impacts in case the level of economic development is sufficient to cover com-pensation mechanism costs, but none of them include the impact of the development and functioning of compensation mechanisms. Not expanding the system boundary is a com-mon approach in attributional LCA. Some of the cause–effect chain relationships have been calculated based on empirical data, e.g., malnutrition rate and human development index (Pfister et al.2009), water scarcity, and accessibility to safe water (Motoshita et al.2010b). Other cause–effect chains rely on the multiplication of key parameters (Boulay et al.2011b). Both approaches are relevant but need to be further character-ized by a measure of uncertainty to assess the deviation of potential impacts estimation. Endpoint indicators are general-ly regionalized on a country (Pfister et al.2009; Motoshita et al.2010b; Boulay et al.2011b) or watershed level (Pfister et al.2009; Boulay et al.2011b).
3.4.2 Ecosystem quality
Methods addressing ecosystem quality cover different parts of the cause–effect chains relevant to ecosystem services and biodiversity. The cause–effect chains that current meth-ods cover regarding damages to ecosystem quality are the decrease of terrestrial biodiversity due to freshwater con-sumption (Pfister et al.2009), decrease of aquatic biodiver-sity due to turbined water use, disappearance of terrestrial plant species due to groundwater withdrawal and related lowering of the water table (van Zelm et al.2011), and the effects of freshwater consumption on freshwater fish species (Hanafiah et al.2011). These endpoint methods do not use water scarcity indices as elements of the modeling equa-tions. Rather, they are applied to different water types and uses and should be used complementarily. Most methods consider the ecological value of freshwater resources through an empirical observation of decreased biodiversity or of other proxy data such as net primary production (Pfister et al. 2009; van Zelm et al. 2011) and from a mechanistic perspective, e.g., by relating fish species rich-ness to river discharge (Hanafiah et al.2011).
Some cause–effect chains, e.g., the impact due to water deprivation related to water quality degradation on aquatic ecosystems, still need to be covered by additional methods. Endpoint methods addressing ecosystem quality have dif-ferent levels of spatial difdif-ferentiation: no difdif-ferentiation, generic or for a specific region (van Zelm et al. 2011), archetype (e.g., alpine and non-alpine dams) country (Pfister et al. 2009), or watershed (Pfister et al. 2009; Hanafiah et al.2011). This variability of the differentiation level reflects the diversity of the parameters considered in the cause–effect chain.
3.4.3 Resources
Methods addressing the area of protection resources quantify the impact on future freshwater availability through a backup technology approach to evaluate the impact of freshwater consumption above their renewability rate (Pfister et al. 2009) or through the exergy content of the freshwater resource (Boesch et al.2007). In contrast to the Pfister et al.’s method (2009), Boesch et al.’s (2007) method is not specific to water resources and does not consider water scarcity.
None of the evaluated endpoint methods cover the cause– effect chain comprehensively; the pathway addressing im-pact due to fossil groundwater depletion is poorly known and is not covered by available methods. Furthermore, esti-mation of impact of consumption over the renewability rates lacks differentiation between different water types, and change in green water availability is not covered. Pfister et al.’s (2009) method is a spatially differentiated method on a watershed and a country level, whereas Boesch et al.’s (2007) method is not differentiated.
4 Recommendations
4.1 Model components to build a scientific consensus for method developers
The previously described findings can guide future consid-eration of freshwater use in LCA.
4.1.1 Inventory databases
From a business and industry perspective, data availability on freshwater use as well as harmonized reporting formats are limiting factors for establishing meaningful water footprints of products, processes, and organizations (Koehler 2008). A balanced approach between LCIA methods and business data requirements is therefore needed to make characterization methods broadly applicable and meaningful. In order to link up with emerging LCI and LCIA methods, inventory data-bases should preserve the maximum freedom to provide nec-essary flows for application of different impact methods. The following recommendations for inventory database develop-ments were drawn based on existing LCI and LCIA methods and are evaluated as necessary:
1. Differentiate consumptive freshwater use from with-drawal (abstraction) through consistent water balances for fore- and background processes and do not mix physical flows with assessment units such as cubic meter equivalents of polluted water.
2. Distinguish between different water types based on origin (surface freshwater, including river, lake, and
sea; groundwater, including renewable, shallow, and deep; and precipitation freshwater stored as soil mois-ture and fossil groundwater) and freshwater quality (and thus functionality). This can be done by applying the systematic classification proposed by Boulay and col-leagues (2011a) according to quality data that could be collected, e.g., data on general parameters (which in-clude microbial parameters) and inorganic and organic compounds.
3. Include freshwater evaporation from water reservoirs as consumptive use, as it makes freshwater locally/region-ally not available anymore.
The following additional optional guidelines could be integrated:
1. For the assessment of groundwater withdrawals and associated impacts, differentiate shallow (<2.3 m) and deep water tables (van Zelm et al. 2011) or estimate regional average fractions of areas of each type. 2. Differentiate withdrawal of fossil groundwater from
renewable groundwater based on regionally available resources as far as possible.
4.1.2 Inventory methods
General recommendations for inventory methods are the following:
1. Include only measurable freshwater types, e.g., surface water and groundwater, or a method to estimate those flows shall be provided, e.g., for water stored as soil moisture evapotranspirated by plants, so called green water, which can be estimated with a crop model suitable, based on input data on climate, soil, and crop character-istics (Hanasaki et al.2010; Hoekstra et al.2011). 2. Use water quality parameters to characterize freshwater
flows that are available in existing databases. 4.1.3 Impact assessment methods
In order to ease their applicability, LCIA shall, in general, show robust examples linking the inventory of freshwater types with all needed calculation steps to apply character-ization factors and aggregate results for obtaining related mid- or endpoint indicators.
4.1.4 Midpoint assessment methods
The water consumption or withdrawal to availability ratio has been recognized as a representative proxy for scarcity, in comparison to other indices, e.g., water use per capita, which reflects rather a socioeconomic situation. Midpoint methods
addressing water scarcity shall (1) include water storage ca-pacity in the modeling of total water availability within a geographical unit, (2) be quantitatively compared to evaluate the trade-off between easiness of application and cause–effect chain coverage and related uncertainty between indicators based solely on water scarcity (Pfister et al. 2009; Ridoutt and Pfister2010b; Frischknecht et al.2006; Milà i Canals et al. 2009) and more comprehensive midpoint indicators (Boulay et al.2011b), (3) provide further empirical evidence of the link between water scarcity, water deprivation, and impact on different areas of protection to evaluate the rele-vance of mid- versus endpoint indicators. In an LCA perspec-tive, water scarcity indicator does not refer to any potential impact. This does not necessarily mean that an endpoint is ultimately affected. Water stress index is, for example, in-volved in Pfister et al.’s and Boulay et al.’s endpoint models for human health, but human health is not affected if the economic development level is sufficient. Clear evidence of the link between water scarcity, water deprivation, and impact on different areas of protection would be needed to evaluate the relevance of mid- versus endpoint indicators.
4.1.5 Endpoint assessment methods
Next steps towards a consistent framework for application of endpoint methods are as follows.
1. For the area of protection human health:
a. Provide a quantitative comparison of existing meth-ods as well as an evaluation against empirical figures. b. Assess the relevance and uncertainty of modeling indirect impacts related to water deprivation, e.g., human health impact due to conflict creation, and population displacement.
c. Develop new approaches for modeling of compen-sation mechanisms to prevent water loss in func-tionality throughout impact categories, knowing that technical means can also be used to cope with other impacts such as climate change.
2. For the area of protection ecosystem quality: a. Identify extensively missing cause–effect chain. b. Provide global coverage and appropriate spatial
res-olution (e.g., watershed scale) for methods devel-oped for a single country (van Zelm et al.2011) or with partial basin coverage (Hanafiah et al.2011). 3. For the area of protection resources:
a. Cover the cause–effect chain leading to impact of fossil groundwater exhaustion, as well as include it in the inventory.
b. Distinguish impact related to different freshwater types consumption, given that they have different renewability rates and functionalities.
c. Quantifying the link between green water use and resources. Although Heuvelmans et al. (2005) de-veloped a method to quantify impact of land use concerned with changes in hydrological response of the land, no characterization factors yet exist to quantify this relationship.
For all mid- and endpoint methods, uncertainties of input data as well as model uncertainty still need to be evaluated and documented. Mid- and endpoint methods covering hu-man health and ecosystem quality impact shall provide characterization factors with monthly differentiation to re-flect variability related to meteorological conditions and associated ecosystem changes.
4.2 Application recommendations for practitioners given current state of the art
The evaluation of freshwater use is possible by assembling methods in a comprehensive methodology to characterize each use adequately. Current state of the art can already provide a preliminary understanding of water uses and associated impacts, especially on human health and ecosystem quality.
In this respect, a detailed inventory, including freshwater withdrawal and release, water consumption, and turbined water, constitutes a first step towards understanding the various flows related to the system. Inventory results can be used as an indicator as such (Hoekstra2011; WBCSD 2010), but the interrelation between inventory results and impact linked to freshwater use is not yet proven and can be, in some cases, misleading (Ridoutt et al. 2010; Ridoutt 2011). Clarity of LCI scope demands clear communication regarding whether an attributional or consequential LCI approach has been taken.
For midpoint level assessment, it is not yet possible to draw conclusions on method preference, given that case studies to test the significance of each method are under development. It is recommended to use the existing mid-point methods most relevant for the study under elaboration to ensure an extensive sensitivity analysis on the methodo-logical choice, keeping in mind their cause–effect chain overlaps. If possible, the information given by scarcity indices should be interpreted in parallel with damage-oriented impact assessment indicators to provide a compre-hensive picture of impacts related to freshwater use.
For endpoint level assessment, it is recommended to combine indicators of all cause–effect chains, i.e., malnutri-tion or infectious diseases related to water deprivamalnutri-tion of a defined quality class for agriculture, fisheries, and domestic use for human health. For ecosystem quality, the scopes of
methods developed could so far be considered as comple-mentary. All ecosystem quality indicators could therefore be used simultaneously and summed up into a single metric. However, results should be interpreted with caution as not all the indicators are addressing the same endpoints. The resource area of protection is considered not being suffi-ciently developed to provide significant results.
This assessment needs to be completed by emission to all compartments ultimately affecting water (e.g., aquatic acid-ification, eutrophication, human toxicity, ecotoxicity, as well as heat release to water) to provide a complete picture of water-related impacts.
5 Conclusions
This is the first state-of-the-art assessment of freshwater use-related methods. This review assesses relevant tools to make an assessment from a product or site perspective, extending the analysis beyond the water flow inventory and encom-passing impact from indirect water use in the system limits. Although some cause–effect chains still need to be covered, spatial differentiation refined, and uncertainty assessed, the set of methods presented can already help to grasp water-related challenges and risks which humans face and serve as a first base for strategic decisions. Water assessment is a fast progressing field, and this review will need to be regularly updated to include new developments.
Acknowledgments Most of the work for this project was carried out on a voluntary basis and financed by in-kind contributions from the authors’ home institutions which are therefore gratefully acknowl-edged. The work was performed under the auspices of the UNEP-SETAC Life Cycle Initiative which also provided logistic and financial support and facilitated stakeholder consultations. A number of persons have contributed to this work. The authors are grateful for the partic-ipation of (in alphabetical order) Emmanuelle Aoustin, Damien Arbault, Adisa Azapagic, Jane Bare, Enrico Benetto, Michael Boesch, Marlia Hanafiah, Arjen Hoekstra, Tereza Levova, Sven Lundie, Sonia Valdivia, and Samuel Vionnet.
Open Access This article is distributed under the terms of the Creative Commons Attribution License which permits any use, distri-bution, and reproduction in any medium, provided the original author (s) and the source are credited.
References
Alcamo J, Flörke M, Märker M (2007) Future long-term changes in global water resources driven by socio-economic and climatic changes (Changements futurs à long terme dans les ressources en eau globales forcés par les changements climatiques et socio-économiques). Hydrolog Sci J 52(2):247–275
Allan JA (1996) Policy responses to the closure of water resources: regional and global issues. Water Policy Allocation and Manage-ment in Practice, pp 228–234
AWS (2009) Alliance for water stewardship
Bauer C, Warren F, Barton K, Llorenc MIC, Bo W, Assumpcio A (2007) Impact category natural resource use: freshwater (UNEP/ SETAC LC initiative)
Bayart J-B (2008) Quantification des impacts reliés à l’utilisation de la ressource eau en analyse de cycle de vie: définition d’un cadre d’étude et dévelopement de facteurs de caractérisation (Maîtrise és Sciences Appliquées). Ecole Polytechnique de Montréal, Montréal Bayart J-B, Bulle C, Deschênes L, Margni M, Pfister S, Vince F,
Koehler A (2010) A framework for assessing off-stream freshwa-ter use in LCA. Int J Life Cycle Assess 15(5):439–453
Berger M, Finkbeiner M (2010) Water footprinting: how to address water use in life cycle assessment? Sustainability 2(4):919–944 Boesch M, Hellweg S, Huijbregts M, Frischknecht R (2007) Applying
cumulative exergy demand (CExD) indicators to the ecoinvent database. Int J Life Cycle Assess 12(3):181–190
Boulay A-M, Bouchard C, Bulle C, Deschênes L, Margni M (2011a) Categorizing water for LCA inventory. Int J Life Cycle Assess 16 (7):639–651
Boulay A-M, Bulle C, Bayart J-B, Deschênes L, Margni M (2011b) Regional characterization of freshwater use in LCA: modeling direct impacts on human health. Environ Sci Technol 45(20): 8948–8957
CEO Water Mandate (2007) An initiative by business leaders in partner-ship with the international community. United Nations, New York Döll P (2009) Vulnerability to the impact of climate change on
renew-able groundwater resources: a global-scale assessment. Environ Res Lett 4(3):1–12
Ecoinvent (2007) Ecoinvent center. Swiss Centre for Life Cycle In-ventories, Duebendorf
Falkenmark M, Rockstrom J (2006) The new blue and green water paradigm: breaking new ground for water resources planning and management. J Water Resour Plann Manag 132(3):129–132 Falkenmark M, Lundqvist J, Widstrand C (1989) Macro-scale water
scarcity requires micro-scale approaches. Aspects of vulnerability in semi-arid development. Nat Resour Forum 13(4):258–267 Frischknecht R, Jungbluth N, Althaus H-J, Doka G, Dones R, Heck T,
Hellweg S, Hischier R, Nemecek T, Rebitzer G, Spielmann M (2004) The ecoinvent database: overview and methodological framework. Int J Life Cycle Assess 10(1):3–9
Frischknecht R, Steiner R, Braunschweig A, Egli N, Hildesheimer G (2006) Swiss ecological scarcity method: the new version 2006. Swiss Federal Office for the Environment (FOEN), Switzerland Gleick PH (1996) Basic water requirements for human activities:
meeting basic needs. Water Int 21(2):83–92
Hanafiah M, Xenopoulos M, Pfister S, Leuven RS, Huijbregts M (2011) Characterization factors for water consumption and green-house gas emissions based on freshwater fish species extinction. Environ Sci Technol 45(12):5272–5278
Hanasaki N, Inuzuka T, Kanae S, Oki T (2010) An estimation of global virtual water flow and sources of water withdrawal for major crops and livestock products using a global hydrological model. J Hydrol 384:232–244
Henriques JJ, Louis GE (2011) A decision model for selecting sustain-able drinking water supply and greywater reuse systems for de-veloping communities with a case study in Cimahi, Indonesia. J Environ Manag 92(1):214–222
Heuvelmans G, Muys B, Feyen J (2005) Extending the life cycle methodology to cover impacts of land use systems on the fresh-water balance. Int J Life Cycle Assess 10:113–119
Hoekstra AY (2011) The global dimension of freshwater governance: why the river basin approach is no longer sufficient and why cooperative action at global level is needed. Freshwater 3:21–46 Hoekstra AY, Chapagain AK, Aldaya MM, Mekonnen MM (2011) The
water footprint assessment manual: setting the global standard. Water Footprint Network. Enschede, The Netherlands
Hoff H (2009) Global freshwater resources and their management. Curr Opin Environ Sustain 1:141–147
Joint Research Centre - Institute for Environment and Sustainability (2011) ILCD handbook general guide for life cycle assessment— recommendations for life cycle impact assessment in the Europe-an context—based on existing environmental impact assessment models and factors. Luxembourg
Jolliet O, Müller-Wenk R, Bare J, Brent A, Goedkoop M, Heijungs R, Itsubo N, Pena C, Pennington D, Potting J, Rebitzer G, Stewart M, de Haes H, Weidema B (2004) The LCIA midpoint-damage framework of the UNEP/SETAC life cycle initiative. Int J Life Cycle Assess 9(6):394–404
Koehler A (2008) Water use in LCA: managing the planet’s freshwater resources. Int J Life Cycle Assess 13(6):451–455
Koehler A, Aoustin E (2008) UNEP/SETAC Life Cycle Initiative SETAC Europe Annual Meeting, Project group on assessment of use and depletion of water resources within LCA. Warsaw, Poland
Milà i Canals L, Chenoweth J, Chapagain A, Orr S, Antón A, Clift R (2009) Assessing freshwater use impacts in LCA: part I —inven-tory modelling and characterisation factors for the main impact pathways. Int J Life Cycle Assess 14(1):28–42
Motoshita M, Itsubo N, Inaba A (2010a) Damage assessment of water scarcity for agricultural use. Proceedings of 9th international conference on EcoBalance. D1-1410. National Institute of Ad-vanced Industrial Science and Technology (AIST)
Motoshita M, Itsubo N, Inaba A (2010b) Development of impact factors on damage to health by infectious diseases caused by domestic water scarcity. Int J Life Cycle Assess 16(1):65–73 Odum HT (1996) Environmental accounting: emergy and
environmen-tal decision making. Wiley, New York
Ohlsson L (2000) Water conflicts and social resource scarcity. Phys Chem Earth Pt B 25(3):213–220
Oki T, Kanae S (2006) Global hydrological cycles and world water resources. Science 313(5790):1068–1072
Owens JW (2001) Water resources in life-cycle impact assessment: considerations in choosing category indicators. J Ind Ecol 5 (2):37–54
PE (2011) GaBi software and database. Available at: http://www.gabi-software.com
Peters G, Wiedemann S, Rowley H, Tucker R (2010) Accounting for water use in Australian red meat production. Int J Life Cycle Assess 15(3):311–320
Pfister S and Hellweg S (2011). Surface water use—human health impacts. Report of the LC-IMPACT project (EU-sponsored FP7 project). Available at:http://www.ifu.ethz.ch/ESD/downloads/ Uncertainty_water_LCIA.pdf
Pfister S, Koehler A, Hellweg S (2009) Assessing the environmental impacts of freshwater consumption in LCA. Environ Sci Technol 43(11):4098–4104
Pfister S, Bayer P, Koehler A, Hellweg S (2011) Environmental impacts of water use in global crop production: hotspots and trade-offs with land use. Environ Sci Technol 45(13):5761–5768 Quantis (2011) Quantis Water Database—technical report. Lausanne, Switzerland. Available at: http://www.quantis-intl.com/ waterdatabase.php
Raskin P, Gleick P, Kirshen P, Pontius G, Strzepek K (1997) Water futures: assessment of long-range patterns and prospects. Stock-holm, Sweden
Ridoutt BG (2011) Development and application of a water footprint metric for agricultural products and food industry. In: Finkbeiner M (ed) Towards life cycle sustainability management. Springer, Berlin Ridoutt BG, Pfister S (2010a) Reducing humanity’s water footprint.
Environ Sci Technol 44(16):6019–6021
Ridoutt BG, Pfister S (2010b) A revised approach to water foot-printing to make transparent the impacts of consumption and
production on global freshwater scarcity. Glob Environ Chang 20(1):113–120
Ridoutt BG, Williams SRO, Baud S, Fraval S, Marks N (2010) Short communication: the water footprint of dairy products: case study involving skim milk powder. J Dairy Sci 93(11):5114–5117 Rockström J, Steffen W, Noone K, Persson A, Chapin FS, Lambin EF,
Lenton TM, Scheffer MF, Schellnhuber HJ, Nykvist B, Hughes T, van der Leeuw S, Rodhe H, Sorlin S, Snyder PK, Costanza R, Svedin U, Falkenmark M, Karlberg L, Corell RW, Fabry VJ, Hansen J, Walker B, Liverman D, Richardson K, Crutzen P, Foley JA (2009) A safe operating space for humanity. Nature 461:472–475 Rugani B, Huijbregts MAJ, Mutel C, Bastianoni S, Hellweg S (2011)
Solar energy demand (SED) of commodity life cycles. Environ Sci Technol 45(12):5426–5433
Seckler D, Amarasinghe U, Molden DJ, de Silva R, Barker R (1998) World water demand and supply, 1990 to 2025: scenarios and issues. IWMI Research Report vol 19. IWMI, Colombo, Sri Lanka Shen Y, Oki T, Utsumi N, Kanae S, Hanasaki N (2008) Projection of future
world water resources under SRES scenarios: water withdrawal (Pro-jection des ressources en eau mondiales futures selon les scénarios du RSSE: prélèvement d’eau). Hydrolog Sci J 53(1):11–33
Smakhtin V, Revenga C, Döll P (2004) A pilot global assessment of environmental water requirements and scarcity. Water Int 29 (3):307–317
Sullivan C, Meigh J, Giacomello A (2003) The water poverty index: development and application at the community scale. Nat Resour Forum 27(3):189–199
United Stated Geological Survey (USGS) (2012) The water cycle: freshwater storage. Available athttp://ga.water.usgs.gov/edu/ watercyclefreshstorage.html
van Zelm R, Schipper AM, Rombouts M, Snepvangers J, Huijbregts MAJ (2011) Implementing groundwater extraction in life cycle impact assessment: characterization factors based on plant spe-cies richness for the Netherlands. Environ Sci Technol 45 (2):629–635
Verones F, Hanafiah MM, Pfister S, Huijbregts MAJ, Pelletier GJ, Koehler A (2010) Characterization factors for thermal pollution in freshwater aquatic environments. Environ Sci Technol 44 (24):9364–9369
Vince F (2007) UNEP/SETAC Life Cycle Initiative working group: assessment of water use and consumption within LCA. Veolia Environnement, Paris
Vörösmarty CJ, Green P, Salisbury J, Lammers RB (2000) Global water resources: vulnerability from climate change and population growth. Science 289(5477):284–288
Water Footprint Network (2011) WaterStat. Enschede, the Netherlands WBCSD (2010) The global water tool. Accessible at:www.wbcsd.org.
Geneva, Switzerland
World Water Assessment Programme UN (2009) The United Nations World Water Development report 3: water in a changing world. Paris, France and London, England
Zhang Y, Baral A, Bakshi BR (2010) Accounting for ecosystem services in life cycle assessment. Part II: toward an ecologically based LCA. Environ Sci Technol 44(7):2624–2631