Int J Public Health 52 (2007) 117–119 1661-8556/07/020117-3
DOI 10.1007/s00038-007-6081-2 © Birkhäuser Verlag, Basel, 2007
Hints & Kinks
Key elements in the statistical analysis of surveys
André BerchtoldGroupe de Recherche sur la Santé des Adolescents, Institut Universitaire de Médecine Sociale et Préventive, Centre Hospitalier Universitaire Vaudois, Suisse
Institut de Mathématiques Appliquées, Université de Lausanne, Suisse
Submitted: 13 June 2006; Revised: 20 November, 4 December 2006; Accepted: 29 January 2007
This Hints & Kinks paper summarizes the main points relat-ed to the statistical analysis of survey data. We emphasize fi rst on the specifi city of such data, then we compare two dif-ferent statistical approaches. This paper should prove useful to researchers used to traditional statistical analysis, but with-out particular knowledge of the specifi cities of survey data. More generally, it can also serve as a reminder for all statisti-cians.
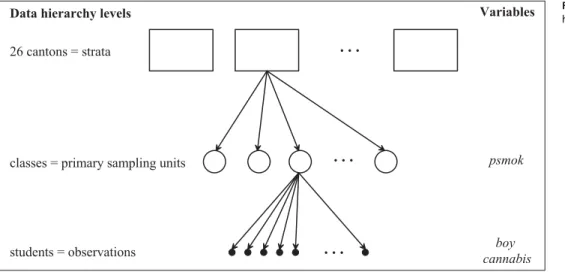
Most surveys are characterized by the complexity of the sam-pling design used to obtain data representative of the underly-ing population (Groves et al. 2004; Korn & Graubard 1999). In many cases, the population is divided fi rst in strata corre-sponding to clearly different groups of population, then a sample is taken from each strata. Moreover, samples are often composed of subjects sharing some important characteristics, and we speak then of clusters of observations. For instance, in a study concerned about the cannabis consumption by high school students in Switzerland, we could decide to take a
sample of students in each of the 26 Swiss cantons, then to select several classes of students in each canton and to inter-view all students belonging to these classes (Fig. 1). In this example, the cantons are the strata and the classes are the pri-mary sampling units. Since it is likely that students belonging to the same class share some important features and so are correlated in some sense, each class is a cluster of observa-tions.
In addition to strata and clusters, a third element, sampling (or probability) weights, is essential in the design of surveys. Sampling weights are defi ned as the inverse of the probability for a subject to be included in a sample taken from the popula-tion. They generally take non-integer values (Tibaldi et al. 2003). These weights are used to rectify the sample e. g. in case of oversampling of a part of the population, or for non-response adjustment.
When analysing survey data, it is essential to take into ac-count all the elements of the design. Otherwise, variances
Figure 1 Three-level data hierarchy of the example survey
. . . D 2 6 c a n t o n s = s t r a t a c l a s s e s = p r i m a r y s a m p l i n g u n i t s s t u d e n t s = o b s e r v a t i o n s . . . . . . p s m o k b o y c a n n a b i s a t a h i e r a r c h y l e v e l s V a r i a b l e s
118 Int J Public Health 52 (2007) Key elements in the statistical analysis of surveys © Birkhäuser Verlag, Basel, 2007
computed from the sample will be too small, the consequenc-es being confi dence interval too narrows and a too high prob-ability to reject the null hypothesis of tests (Crockett 2004). The inclusion of sampling weights and of strata and clusters into a statistical model are two different problems. Whatever the model, weights must always be included. For the research-er, the diffi culty comes from the fact that many standard sta-tistical packages such as SPSS or S-Plus do not allow for the use of sampling weights, at least in their standard version. The temptation is then high either to simply discard the weights or to treat the sampling weights as another type of weights al-lowed by the software, frequency weights in most cases. Such a practice must be absolutely banned, since results can be completely biased with not only errors on variance, but also on parameter point estimates. The only valid solution is to use software specialized in survey data analysis, such as Stata, the Complex Sample toolbox of SPSS, SAS/STAT, SUDAAN, or WesVar (Brogan 2005).
Concerning strata and clusters, two elements have to be mentioned. First of all, in regard of a specifi c research ques-tion, it is not always necessary to take into account each ele-ment of the design. For instance, in the above example where Swiss cantons are strata, it could be possible that the effect of living in a particular canton does not change sig-nifi cantly the level of cannabis consumption. In that case, it is possible to simplify the design and not to include strata in the model. The effect of each element of the design upon a model can be evaluated through the deff measure (Kish 1965) defi ned as
deff = 1 + (n – 1) ρ
where n is the average size of strata and ρ is the intraclass cor-relation. The deff measure is interpreted as the expected ratio between a variance computed from data obtained through a complex design and the corresponding variance computed from data obtained through simple random sampling.
The statistical model itself used to explain the cannabis con-sumption can follow two completely different strategies. In the fi rst one, a standard model such as a linear regression is defi ned for the dependent variable with all available explana-tory factors, whatever at which level (students, classes, can-tons) they apply. Since the design of the survey infl uences the model through the variance of each parameter, approxima-tions of the true variances are obtained either by Taylor series linearization or by replication procedures such as the jacknife method. For instance, a model for the cannabis consumption of subject i could be of the form
cannabisi = b0 + b1boyi + b2 psmoki + ei
where cannabis is the number of days with cannabis con-sumption during the last 30 days, boy is an indicator variable identifying boys, psmok is the percentage of regular tobacco smokers in the class, and e is a normally distributed error term. The cannabis and boy variables are computed at the subject level, when psmok is an average computed at the class level.
In this standard approach, the objective is to compute popula-tion estimapopula-tions of parameters and the design of the survey is considered as a noise effect exogenous from the statistical model itself. By contrast, in a multilevel model (Hox 2002), the different levels of the data (subjects, classes, cantons) are constitutive elements of interest of the model. The value of the dependent variable is then seen as the combination of various infl uences coming from all levels of the data and the model is used to decompose the value into these effects. For instance, we could have the model
cannabisijk = g000 + g100boyijk + g010 psmokjk + g110boyijk psmokjk + eijk + u0jk + u1jkboyijk + u00k + u10kboyijk + u01k psmokjk + u 11k-boyijk psmokjk
where i, j and k are respectively the indexes of subjects, class-es, and cantons. Fixed parameters are named g and normally
distributed error terms are named e at the subject level and u at the class and canton levels. The fi rst line of the model groups all fi xed effects, when the random part is on the second and third lines. The fi xed part of the model tells that the number of cannabis consumption days is explained by varia-bles boy and psmok, and by their interaction. The random part of the model indicates the magnitude of variation between subjects due to random differences coming from all three lev-els of the data hierarchy. The error terms eijk specifi c to each subject, u0jk + u1jkboyijk is the error attributable to random variations among classes, u00k + u10k boyijk + u01k psmokjk + u11k boyijk psmokjk and is the error attributable to random vari-ation among cantons.
This model is complex, but it provides a very precise explana-tion of the dependent variable. Of course, it can be simplifi ed by suppressing non-signifi cant parameters. Moreover, if some elements of the design do not infl uence signifi cantly the re-sults, they can also be suppressed, leading to a more readable model. In our case, the analysis of the deff measure shows that the use of sampling weights and clusters is essential. Ignoring them would lead to an under-estimation of the variances by a factor 2. On the other hand, the use of strata does not add any-thing signifi cant, so the model could be simplifi ed by remov-ing the canton level.
To summarize, a correct statistical analysis of survey data re-quires taking into account the whole design of the survey. Not
Key elements in the statistical analysis of surveys Int J Public Health 52 (2007) 117–119 119
© Birkhäuser Verlag, Basel, 2007
doing so would result in incorrect variances, confi dence inter-vals and p-values. The use of specialized softwares and /or specialized procedures such as multilevel models is then re-quired. Table 1 compares the main characteristics of the two statistical approaches presented in the paper.
The writing of this paper would not have been possible with-out the support and pertinent comments of André Jeannin, Pierre-André Michaud and Joan-Carles Suris.
Table 1 Comparison of statistical approaches
Standard approach Multilevel approach
The goal is to obtain population estimates of parameters. The goal is to understand the exact infl uence of explanatory factors
belonging to the different levels of the data hierarchy. Easy to understand results, but modelling sometimes oversimplifying
the reality.
Modelling very close to the reality, but results complex to interpret.
Sampling design exogeneous to the model. Sampling design endogeneous to the model.
Not taking into account the whole sampling design results in underestimated variances.
All variables are treated as if they belong to the same level. Each variable is introduced into the model at its own measurement
level.
One global error term for the whole model. Several error terms indicating which part of the total variability is
attributable to each element of the model. The use of specialized statistical softwares is generally required.
Moderate computational time. Computational time can become prohibitive on complex models with
more than three levels and many factors.
References
Brogan DJ (2005). Sampling error estimation for survey data. In: Household Sample Surveys in Developing and Transition Countries, Chapter XXI. United Nations.
Crockett A (2004). Weighting the Social Surveys. UK Data Archive and Institute for Social and Economic Research. http://www.esds.ac.uk/ government/docs/weighting.pdf.
Groves RM, Fowler FJ, Couper MP, Lepkowski JM, Singer E, Tourangeau R (2004). Survey Methodology. Wiley Series in Survey methodo-logy. New York: Wiley.
Hox JJ (2002). Multilevel Analysis: Techniques and Applications. London: Lawrence Erlbaum Associates.
Kish L (1965). Survey Sampling. New York: Wiley.
Korn EL & Graubard BI (1999). Analysis of Health Surveys. Wiley Series in Survey methodo-logy. New York: Wiley.
Tibaldi F, Bruckers L,Van Oyen H, Van der Hey-den J, Molenbergh G (2003). Statistical software for calculating properly weighted estimates from Health Interview Survey Data. Social and Preven-tive Medicine 48: 269–71.
Address for correspondence André Berchtold Université de Lausanne
Institut de Mathématiques Appliquées SSP, Anthropole
CH-1015 Lausanne
e-mail: [email protected]
To access this journal online: http://www.birkhauser.ch/IJPH