COMPUTED TOMOGRAPHY
Low-dose CT of the lung: potential value
of iterative reconstructions
Stephan Baumueller&Anna Winklehner&
Christoph Karlo&Robert Goetti&Thomas Flohr&
Erich W. Russi&Thomas Frauenfelder&Hatem Alkadhi
Received: 15 March 2012 / Revised: 20 April 2012 / Accepted: 27 April 2012 / Published online: 15 June 2012 # European Society of Radiology 2012
Abstract
Objectives To prospectively assess the impact of sinogram-affirmed iterative reconstruction (SAFIRE) on image quality of nonenhanced low-dose lung CT as compared to filtered back projection (FBP).
Methods Nonenhanced low-dose chest CT (tube current-time product: 30 mAs) was performed on 30 patients at 100 kVp and on 30 patients at 80 kVp. Images were reconstructed with FBP and SAFIRE. Two blinded, independent readers mea-sured image noise; two readers assessed image quality of normal anatomic lung structures on a five-point scale. Radia-tion dose parameters were recorded.
Results Image noise in datasets reconstructed with FBP (57.4 ±15.9) was significantly higher than with SAFIRE (31.7±9.8, P<0.001). Image quality was significantly superi-or with SAFIRE than with FBP (P<0.01), without significant difference between FBP at 100 kVp and SAFIRE at 80 kVp (P00.68). Diagnostic image quality was present with FBP in 96% of images at 100 kVp and 88% at 80 kVp, and with SAFIRE in 100% at 100 kVp and 98% at 80 kVp. There were significantly more datasets with diagnostic image quality with
SAFIRE than with FBP (P<0.01). Mean CTDIvoland
effec-tive doses were 1.5 ± 0.7 mGy·cm and 0.7 ± 0.2 mSv at 100 kVp, and 1.4±2.8 mGy·cm and 0.5±0.2 mSv at 80 kVp (P<0.001, both).
Conclusions Use of SAFIRE in low-dose lung CT reduces noise, improves image quality, and renders more studies diagnostic as compared to FBP.
Key Points
• Low-dose computed tomography is an important thoracic investigation tool.
• Radiation dose can be less than 1 mSv with iterative reconstructions.
• Iterative reconstructions render more low-dose lung CTs diagnostic compared to conventional reconstructions. Keywords Spiral computed tomography . Image reconstruction . Image enhancement . Lung . Radiation dosage
Introduction
Computed tomography (CT) of the lung represents the prin-cipal diagnostic investigation for imaging of the normal and diseased pulmonary parenchyma [9, 13, 18, 27]. This is mainly due to the superiority of CT as compared to chest X-ray in regard to the sensitivity and specificity for the diagnosis of various pulmonary disorders. The downside of chest CT as compared to X-ray, however, is the higher radiation dose associated with the technique. Current stan-dard chest CT studies are associated with an effective radi-ation dose of approximately 6–8 mSv [16]. Because of growing concern regarding the increase in the collective radiation burden to the population, various strategies have been developed for lowering the radiation dose associated
S. Baumueller
:
A. Winklehner:
C. Karlo:
R. Goetti:
T. Frauenfelder
:
H. Alkadhi (*)Institute for Diagnostic and Interventional Radiology, University Hospital Zurich,
Raemistrasse 100,
CH-8091 Zurich, Switzerland e-mail: [email protected] T. Flohr
Computed Tomography Division, Siemens Healthcare, Forchheim, Germany
E. W. Russi
Pulmonary Division, Department of Internal Medicine, University Hospital Zurich,
Zurich, Switzerland
with CT. This is considered particularly important in patients undergoing repetitive chest CT studies for the diag-nosis and follow-up of pulmonary infections [6,10,25] or in light of recent considerations on the use of chest CT for the screening of lung cancer [1–3].
Various strategies exist for lowering the radiation dose of chest CT. These include lowering the tube voltage, automat-ing exposure control, and usautomat-ing high pitch or selective in-plane shielding [4,5,7,11,20], resulting in effective radi-ation doses for chest CT as low as 1–2 mSv. Recently, another image reconstruction technique that minimises the noise in CT images, iterative reconstruction (IR), has been introduced for CT, offering an alternative to the convention-al reconstruction mode filtered back-projection (FBP) [26]. While reconstruction with FBP contains a trade-off between sharpness and image noise that limits the minimum applied radiation dose required for appropriate diagnostic imaging [12], IR aims to overcome these limitations of FBP. As a matter of fact, several studies have shown the benefit of image domain-based IR for improving the image quality of chest CT [14, 21–24, 30], with reported radiation dose levels of 1.8 mSv using iterative reconstruction in image space (IRIS) [21] and 8.5–8.8 mSv using adaptive statistical iterative reconstruction (ASIR) [23,24].
Sinogram-affirmed iterative reconstruction (SAFIRE) is one of the most recently introduced IR processes. As com-pared to previous image domain-based techniques, SAFIRE uses a noise modelling technique supported by the raw data (sinogram data) with the aim of reducing noise and main-taining image sharpness.
The purpose of this study was to prospectively assess the impact of SAFIRE on the image quality of nonenhanced low-radiation-dose chest CT as compared to the conventional FBP reconstruction mode.
Materials and methods Patient population
Between November 2010 and February 2011, a total of 60 consecutive patients who underwent clinically indicated
nonenhanced low-dose CT of the chest were enrolled in this study. The first cohort of 30 consecutive patients (14 women, 16 men; mean age 50.8±21.6 years, range 17–84 years) was examined at 100 kVp. After preliminary analysis of these data (for details, see“Results” section below), the radiation dose was lowered further in the second cohort of 30 consecutive patients (18 women, 12 men; mean age 53.8±16.6 years, range 25–79 years) by using a protocol with 80 kVp. Descrip-tive and comparaDescrip-tive statistics on patient demographics are summarized in Table1. There were no significant differences in patient demographics between the two patient groups.
Clinical indications for nonenhanced CT of the chest encompassed suspected pulmonary infections in immu-nocompromised patients (n027) and CT examinations for known or suspected pulmonary nodules (n033). Patients with implanted pacemaker devices or port sys-tems were excluded from the study to avoid bias in noise measurements.
Institutional review board and local ethics committee approval was obtained; all patients gave written informed consent.
CT protocol
All studies were performed on a 64-section CT machine (Somatom Definition AS, Siemens Healthcare, Forchheim, Germany). Patients were examined with a collimation of 32×0.6 mm and a slice acquisition of 64×0.6 mm by means of a z-flying focal spot, a gantry rotation time of 0.5 s, and a pitch of 1.2. Tube voltage for the first cohort of 30 consec-utive patients was set at 100 kVp, and for the second cohort of 30 consecutive patients at 80 kVp. Attenuation-based tube current modulation (CareDose4D, Siemens) was used with a reference tube current-time product of 30 mAs per rotation for both 80 and 100 kVp. The scans were performed in a craniocaudal direction and included the entire lung parenchyma.
After each CT study, images were immediately reviewed on the operator console for the image quality. In case of non-diagnostic image quality (which occurred in three patients), an additional standard-dose CT study (tube voltage 100 kVp, tube current-time product 80 mAs) was subsequently performed.
Table 1 Patient demographics
Data are presented as mean±standard deviation (range) or number BMI Body mass index
Characteristic 100 kVp protocol (30 patients) 80 kVp protocol (30 patients) P values
Age (years) 50.8±21.6 (17–84) 53.8±16.6 (25–79) 0.59 Sex Men 16 12 0.31 Women 14 18 Height (m) 1.70±0.1 (1.49–1.94) 1.66±0.08 (1.49–1.80) 0.15 Body weight (kg) 69.8±14.2 (42.0–100.0) 69.1±13.3 (52.0–105.0) 0.66 BMI (kg/m2) 24.2±4.3 (17.0–35.2) 25.1±5.1 (17.9–40.5) 0.53
These patients were not excluded, but their low-dose CT image data were included in this study, since low-dose CT data from these patients were reconstructed with FBP und SAFIRE and could be used for further analysis.
Data reconstruction
All CT images were reconstructed with FBP and with SAFIRE in each patient. Since the clinical indications in this study did not require high resolution lung image reconstructions, the data reconstruction of all images was performed according to the standard CT reconstruction protocol of our department using a slice thickness of 2 mm, an increment of 1.6 mm, and a sharp tissue convolution kernel (B50f for FBP and I50f for SAFIRE) with lung window settings (center−600 HU, width 1,200 HU). Mean field-of-view (FoV) equaled 323±29 mm, and image matrix was 512×512 pixels with a resulting in-plane resolution of 0.63×0.63 mm2.
The duration of each data reconstruction, being the time interval between the initialization and the end of the recon-struction of the chest series, was measured for FBP and SAFIRE in each patient.
Subsequent analyses were all made on a picture archiving and communication system (PACS) workstation (AGFA Impax Client ES DS 3000, AGFA HealthCare, Mortsel, Belgium).
Sinogram-affirmed iterative reconstruction
In an IR, a correction loop is introduced into the image reconstruction process. Each time the original image is updated by a correction image. Nonlinear image processing algorithms are used to enhance spatial resolution at higher object contrasts and to reduce image noise in low contrast areas. This “regularisation” step is essential for the noise reduction properties of an IR. Synthetic raw data are calcu-lated by forward projection of the image and compared to the originally measured raw data to derive correction pro-jections, a process that mainly removes artifacts introduced by the approximate nature of the FBP reconstruction.
The performance of the regularisation depends on how well local structures in the image are separated from local image noise. SAFIRE uses a refined local image noise model, which predicts the variance of the image noise in different directions in each image pixel and adjusts the space-variant regularization function correspondingly [17, 29]. The anisotropic noise model in each image pixel is obtained by analysing the statistical significance of the raw data contributing to that pixel (in the raw data sinogram). This is why the method is called sinogram-affirmed iterative reconstruction. In each of up to five iterations, SAFIRE estimates the local noise content and removes it from the image (Fig.1).
To obtain a certain predefined noise reduction, the param-eters and criteria used by the noise model can be chosen by the user. Five presets (strength 1 to 5) are available for adaptation of the noise model and for controlling image impression and noise reduction. The strength is not related to the number of iteration loops. These five preset levels are illustrated in a preview series, which was reconstructed at the level of the carina (Fig. 2). Using this preview series, one reader (with 4 years of experience in CT chest imaging) who was not involved with further image evaluation selected the optimum strength level, based on the combination of image noise, image contrast, and image impression for each individual patient.
CT data analysis Image quality
The reconstructed transverse images were presented to two independent and blinded readers (with 4 and 5 years of experience in CT chest imaging, respectively) in a random fashion. Both readers assessed the image quality of all image datasets reconstructed with FBP and SAFIRE using fixed window settings (level−600, width 1,200). The readers were allowed to modify the window settings.
Image quality was assessed for normal anatomical lung structures corresponding to five different categories, as pre-viously shown [23]: large vessels and bronchi, small bronchi and bronchioles, pleural and subpleural area, secondary pulmonary lobule with centrilobular artery, and interlobular
Fig. 1 Schematic diagram of raw-data-based iterative reconstruction. Using the measured raw data, a CT image [CT image (n)] is recon-structed by weighted filtered back projection [W(F)BP]. New synthetic raw data are generated by forward projection of the image. They are compared to the originally measured raw data to derive correction projections that are then used to reconstruct a correction image. This step mainly reduces artifacts introduced by the approximate nature of W(F)BP. Each time the image is updated, nonlinear image processing (regularization) is performed to maintain image structures and reduce image noise. In the SAFIRE approach, regularization is based on a refined anisotropic spatially variant image noise model that is derived by analyzing the statistical significance of the raw data contributing to each image pixel
septae. Image quality was determined for each category by using a five-point rating scale: 1 excellent image quality, no artifacts; 2 slight blurring with unrestricted diagnostic image evaluation possible; 3 moderate blurring with restricted assessment; 4 severe blurring with uncertainty about the evaluation; 5 nondiagnostic image quality, strong artifacts, insufficient for diagnostic purposes [23].
Image noise
Two other blinded and independent readers (with 4 and 3 years of experience in CT chest imaging, respectively) measured image noise. A region of interest (ROI) was placed in the trachea at level of the bifurcation, representing the central scan FoV, as previously shown [5]. The ROI was defined as encompassing an area of 1 cm2while avoiding adjacent anatomical structures of the tracheal wall and the mediastinum. Mean image noise was defined as the average of the standard deviation of the attenuation value in three consecutive ROI measurements.
Imaging findings
Two other blinded and independent readers (with 10 and 11 years of experience in CT chest imaging, respectively)
evaluated abnormal lung structures according to five differ-ent categories, as previously shown [23]: reticular pattern, pulmonary nodule, decreased lung opacity, increased lung opacity, and bronchiectasis. Thereby, pulmonary nodules were rated as present or not, while the detection of decreased lung opacities included focal as well as diffuse patterns. Transverse images reconstructed with FBP and SAFIRE were presented to the two readers in a random fashion. Water-equivalent attenuation
To correlate the selected image noise with the attenuation of the patient, we calculated the water-equivalent attenuation of the topogram as previously shown [28]. These values are derived from the attenuation values of the topogram including the entire chest, which are translated into a corresponding thickness of water (i.e., water-equivalent attenuation). Using this approach, lower attenuating structures are considered to have a lower water thickness, whereas higher attenuating structures are considered to have a higher water thickness. Radiation dose
For radiation dose estimations, the CT volume dose index (CTDIvol) and the dose-length product (DLP) were obtained
Fig. 2 Example of a preview series performed at a tube voltage of 100 kVp and reference tube current-time product of 30 mAs, recon-structed at the level of the cari-na in a 79-year-old male patient with a body mass index of
32.7 kg/m2illustrating the five
selectable strength levels (a–e). Note the progressive decrease in image mottle with increasing strength. Radiation dose parameters were as follows:
CTDIvol1.54 mGy·cm, DLP
56 mGy/cm, and effective radiation dose 1.0 mSv
from the electronically stored patient protocol from each CT study. The effective radiation dose of chest CT was calculated by multiplying the DLP by a conversion coefficient k of 0.014 mSv/mGy·cm [8].
Statistical analysis
Continuous variables are expressed as mean ±standard devi-ations, categorical variables as frequencies or percentages.
Patient demographics, quantitative image quality data, and radiation dose parameters were tested for normality using the Shapiro-Wilk test. Normally distributed variables were compared by using the paired t-test; variables not represented by Gaussian distribution were compared by using the Wilcoxon signed-rank test. Correlations were tested by using the Pearson correlation.
Interobserver agreements for quantitative image quality read-outs were calculated by using the Pearson correlations. Interobserver agreements for qualitative image quality read-outs were calculated using Cohen’s kappa statistics. Overall qualitative image quality ratings of image datasets recon-structed with FBP and SAFIRE were compared for signifi-cance by using the Mann-Whitney U-test.
Statistical analysis was performed by using commercially available software (SPSS, release 18.0 for Windows, SPSS, Chicago, IL). A P-value of less than 0.05 was considered to be statistically significant.
Results
CT and data reconstructions with FBP and with SAFIRE were feasible in all patients, giving rise to a total of 120 datasets for analysis.
Mean duration for data reconstruction for the full set of CT images with FBP (9.4±0.8 s) was significantly shorter than that with SAFIRE (54.2±3.1 s, P<0.005).
Image quality
There was a good (κ00.69) overall interobserver agreement for qualitative image quality ratings with FBP and an excel-lent (κ00.97) overall interobserver agreement for qualitative image quality ratings with SAFIRE. Because of the good to excellent interobserver agreement, we used the image qual-ity ratings of one reader (i.e. reader 1) for further analyses. Image quality ratings of datasets performed with the 100 kVp protocol were significantly superior when recon-structed with SAFIRE as compared to reconstructions with FBP (P<0.01, Fig.3). The same was true for image quality ratings of datasets reconstructed with the 80 kVp protocol (P<0.01, Fig. 4). Image quality ratings of datasets recon-structed with FBP at 100 kVp were not significantly differ-ent from image quality ratings of datasets reconstructed with SAFIRE at 80 kVp (P00.68).
Diagnostic image quality (i.e., scores 1 and 2) for the assessment of the various lung structures was present in 96% among datasets reconstructed with FBP at 100 kVp, in 88% among datasets reconstructed with FBP at 80 kVp, in 100% among datasets reconstructed with SAFIRE at 100 kVp, and in 98% among datasets reconstructed with SAFIRE at 80 kVp.
There were significantly more ratings with diagnostic im-age quality (i.e., scores 1 and 2) among datasets reconstructed with SAFIRE compared to reconstructions with FBP at 100 kVp (P00.01) and 80 kVp (P<0.01, Fig.5). The same was true when including datasets from both kVp protocols in the comparison between FBP and SAFIRE (P<0.01).
Image noise
Excellent and significant correlations were found between the two readers regarding image noise measurements in datasets reconstructed with FBP (r00.83, P<0.001) and SAFIRE (r00.87, P<0.001). We therefore used the image
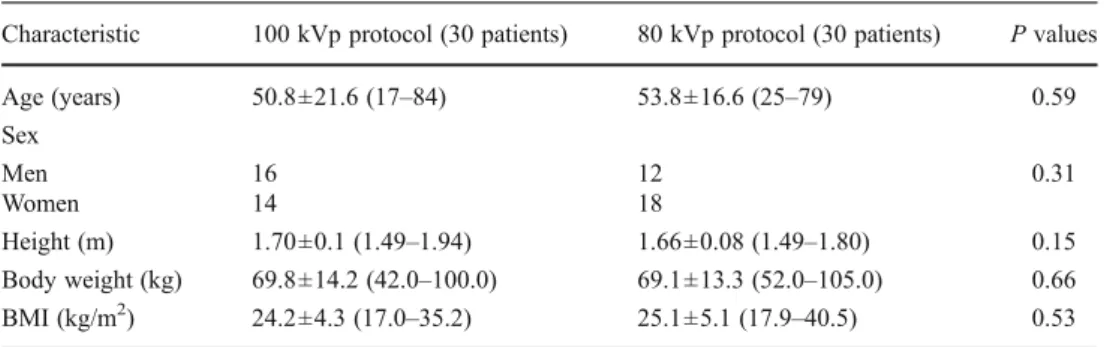
Fig. 3 Corresponding transverse CT images acquired with a tube voltage of 100 kVp and reference tube current-time product of
30 mAs in a 52-year-old obese (BMI 31.2 kg/m2) female patient
referred to CT for follow-up of pulmonary nodules. a Reconstruction with FBP shows minimal blurring of pulmonary structures (score 2 by both readers). b Reconstruction with SAFIRE at a strength of 3 shows
less image noise and excellent image quality (score 1 by both readers). Note the small pulmonary nodule (arrow) in the right lower lobe, which can be clearly seen in both images. Radiation dose parameters
were as follows: CTDIvol2.28 mGy·cm, DLP 79 mGy/cm, and effective
noise measurements from one reader (i.e., reader 1) for further analyses.
Image noise in both datasets reconstructed with FBP (57.4 ± 15.9) was significantly higher than in datasets reconstructed with SAFIRE (31.7±9.8, P<0.001, Fig. 6), resulting in an overall mean image noise reduction of 45.6% with SAFIRE. The same was true when comparing separately the 100 and 80 kVp protocols between SAFIRE (28.0±6.8 at 100 kVp and 35.2±9.4 at 80 kVp; P<0.01) and FBP (50.5 ± 8.7 at 100 kVp and 65.3 ± 14.6 at 80 kVp; P< 0.01). In addition, image noise at 80 kVp reconstructed with SAFIRE (35.2 ± 9.4) was significantly lower than datasets at 100 kVp reconstructed with FBP (50.5 ± 8.7; P < 0.01).
Imaging findings
Abnormal lung structures according to the categories de-fined above were depicted in all image datasets with both
protocols and reconstruction modes (Table2). Significantly more abnormal lung structures could be found in datasets reconstructed with SAFIRE (total 131 abnormal lung struc-tures) than in datasets reconstructed with FBP (109 abnor-mal lung structures, P < 0.01). A more detailed analysis including an assessment of the diagnostic accuracy of low-dose chest CT was not feasible because of the lack of a reference standard.
Patient characteristics
In the datasets reconstructed with SAFIRE at both 80 and 100 kVp, the BMI of patients with a selected strength of 3 (23 patients, mean BMI 22.7 ± 4.2 kg/m2, range 17.0– 35.0 kg/m2) was significantly lower than the BMI of patients reconstructed with strength 4 (37 patients, mean BMI 25.8 ±4.6 kg/m2, range 17.9–40.5 kg/m2, P< 0.01). The strength levels 1, 2, and 5 were not selected in any group or patient.
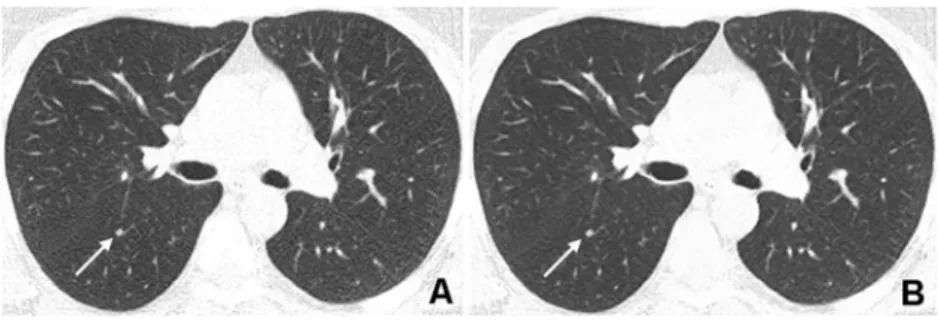
Fig. 4 Corresponding transverse CT images acquired with a tube voltage of 80 kVp and reference tube current-time product of
30 mAs in a 67-year-old normal weight (BMI 24.0 kg/m2) male patient
with immunodeficiency referred to CT to confirm clinically suspected pulmonary infection. a Reconstruction with FBP shows high image noise with restricted but still diagnostic image quality (score 2 by both readers). Note the pulmonary consolidation in the right posterior upper lobe (arrow). Small vessels in the right anterior upper lobe
(arrowhead) show severe blurring due to a high noise level. b Re-construction with SAFIRE at a strength of 4 shows less noise and improved image quality (score 1 by both readers). The pulmonary consolidation (arrow) and the small vessels are now delineated more precisely with consequently improved conspicuity. Radiation dose
parameters were as follows: CTDIvol0.79 mGy·cm, DLP 27 mGy/cm,
and effective radiation dose 0.4 mSv
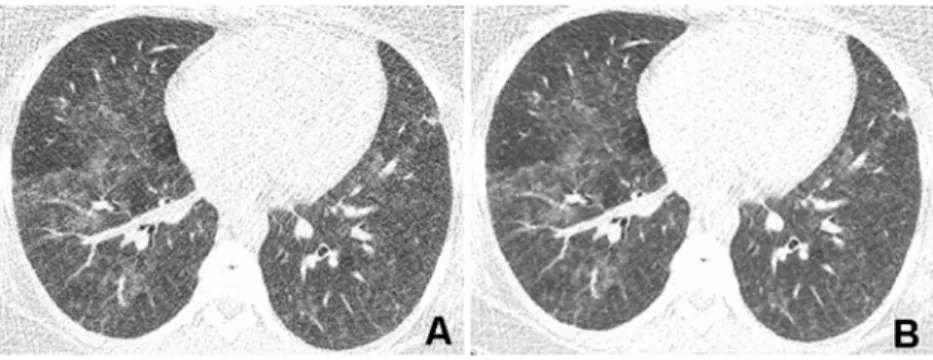
Fig. 5 Corresponding transverse CT images acquired with a tube voltage of 80 kVp and reference tube current-time product of
30 mAs in a 34-year-old obese (BMI 35.0 kg/m2) female patient with
immunodeficiency referred for CT to rule out pulmonary infection. a Reconstruction with FBP shows a high degree of image noise render-ing the image quality nondiagnostic (score 3 by both readers). Note that areas with ground-glass opacity cannot be clearly differentiated
from normal lung parenchyma because of high image mottle. b Re-construction with SAFIRE at a strength level of 3 shows less image noise and improves the differentiation between ground-glass opacities and normal lung parenchyma (score 2 by both readers). Radiation dose
parameters were as follows: CTDIvol1.1 mGy·cm, DLP 35 mGy/cm,
Water-equivalent attenuation
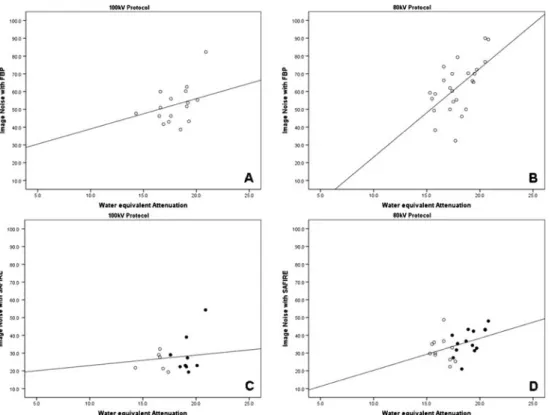
As illustrated in Fig. 7, we found a good and significant correlation between image noise and water-equivalent atten-uation in datasets reconstructed with FBP at 100 kVp (r00.61, P<0.01) and 80 kVp (r00.61, P<0.005). In contrast, there were only fair to moderate correlations between image noise and water-equivalent attenuations for datasets reconstructed with SAFIRE at 80 kVp (r00.42, P<0.05) and 100 kVp (r00.23, P00.4).
Estimated radiation dose
Radiation dose parameters of the different groups and pro-tocols are summarised in Table3. The mean effective radi-ation dose of the protocol at 100 kVp was 0.7±0.2 mSv, the mean effective radiation dose at 80 kVp was 0.5±0.2 mSv (P<0.001, average difference 28.6%).
Discussion
Recent debates about the assumed radiation-associated risk of developing cancer from ionising radiation challenge the radiology community to lower the dose of each CT study to a level that is “as low as reasonably achievable” (the so-called ALARA principle). This holds particularly true for the cumulative dose associated with repetitive CT studies or for screening studies using CT. For example ongoing trials on lung cancer screening employ low-radiation-dose chest CT protocols with estimated effective radiation doses of around 1.5 mSv in the Lung Screening Trial [2] or 1.6 mSv in obese and 0.8 mSv in normal weight patients in the Lung Screen trial [3]. At these low radiation dose levels, the chance of acquiring CT data with a nondiagnostic image quality is not negligible, necessitating efforts to maintain diagnostic image quality even at these low dose levels. Various types of iterative reconstructions from var-ious vendors have been recently introduced, all indicating their potential for lowering the radiation dose of CT studies [12,14,17,19,21–24,26,29,30].
Our study extends this knowledge by adding another type of iterative reconstruction, i.e., SAFIRE, to the field of chest CT imaging. We demonstrated diagnostic image quality of nonenhanced chest CT in 100% of patients at a very low radiation dose level of 0.7 mSv when using SAFIRE as reconstruction technique. Radiation dose could be further lowered to 0.4 mSv, and still 98% of the CT studies were of diagnostic image quality when reconstructed with iterative reconstruction.
Conventional CT image reconstruction approaches such as FBP contain a trade-off between sharpness and image
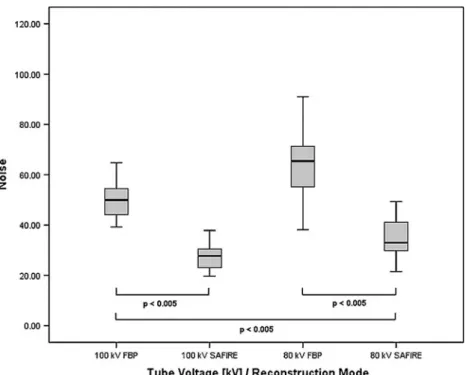
Fig. 6 Boxplots representing the image noise of the two tube voltage protocols and
reconstruction modes. In both 100 and 80 kVp protocols, mean image noise was significantly lower in datasets reconstructed with sinogram-affirmed iterative reconstruction (SAFIRE) than with filtered back projection (FBP) (all P<0.005). In addition, image noise in datasets scanned at 80 kVp and reconstructed with SAFIRE was significantly lower than in datasets scanned at 100 kVp and reconstructed with FBP (P<0.005)
Table 2 Imaging findings of abnormal lung structures
80 kVp 100 kVp FBP (n021)a SAFIRE (n028)a FBP (n026)a SAFIRE (n030)a Reticular pattern 13 16 18 24 Pulmonary nodule 16 18 7 10
Decreased lung opacity 7 8 10 10
Increased lung opacity 11 14 18 22
Bronchiectasis 5 5 4 4
a
noise that limits the minimum applied radiation dose re-quired for appropriate diagnostic imaging as lower radiation doses are associated with increased image noise values [15]. We found evidence that SAFIRE, being an IR technique with a raw-data-based local noise model, allows this con-straint to be overcome by reducing image noise by 45.6% while still providing a diagnostic image quality of low-dose chest CT studies. Furthermore, our study demonstrates that the effective radiation dose of chest CT can be lowered to a submillisievert level with respective protocol settings while maintaining image quality when using raw-data-based itera-tive reconstruction, with no restrictions in patient BMI (up to 40 kg/m2). Nevertheless, the main shortcoming of SAFIRE as a reconstruction mode is the greater expenditure of time than for conventional FBP.
Concerning image noise, we found a good and significant correlation between the noise and attenuation of the chest according to the topogram (i.e., water-equivalent attenuation) for both datasets reconstructed with FBP. There were no such correlations for the datasets reconstructed with SAFIRE. In those datasets, the BMI of patients reconstructed with strength
3 was significantly lower than the BMI of patients recon-structed with a strength level of 4. This is explained by the fact that strength levels for image reconstruction with SAFIRE were individually selected in each patient based on the pre-view series (see Fig.2).
Obviously, a higher strength level was selected in patients with a higher BMI, in whom a higher image noise level was found on the preview series, whereas in patients with a lower BMI a lower strength level was chosen. This fact abolished the correlation between image noise and chest attenuation in the SAFIRE datasets. Moreover, this lack of correlation indicates that image noise levels can be held constant when individually selecting the strength level for image reconstruction with SAFIRE, resulting in image qual-ity being independent of the patient’s habitus.
Our study had some limitations. Firstly, two different patient populations with unequal clinical indications for nonenhanced chest CT and consequently different clinical management were enrolled in this study. However, the study focused on patients undergoing repetitive chest CT studies for the diagnosis and follow-up of pulmonary nodules or
Fig. 7 Scatterplots demonstrating significant correlations between image noise and chest attenuation according to the topogram (i.e., water-equivalent attenuation) in datasets reconstructed with FBP
at a 100 kVp (r00.61, P<0.01)
and b 80 kVp (r00.61, P<0.005). There were no sig-nificant correlations between image noise and water-equivalent attenuation for the SAFIRE datasets at either c
100 kVp (r00.23, P00.4) or
d 80 kVp (r00.42, P<0.05).
Black dots in c and d represent strength level 4, while circles represent a strength level of 3. Note that higher strength levels were used at higher attenuation values (black dots)
Table 3 Radiation dose parameters of the two low-dose chest CT protocols
Data are presented as mean± standard deviation (range)
CTDIvolCT volume dose index,
DLP dose-length product
100 kVp protocol 80 kVp protocol P values
CTDIvol(mGy·cm) 1.5±0.7 (0.9–4.8) 1.4±2.8 (0.7–17) <0.001
Anatomical length (cm) 34.2±6.8 (10.0–52.1) 32.2±7.0 (3.3–44.8) 0.28
DLP (mGy/cm] 47.4±13.4 (26.0–85.0) 32.7±10.6 (21.0–56.0) <0.001
pulmonary infections in immunocompromised conditions. Secondly, the two tube voltage protocols (80 and 100 kVp) were not performed within the same patient popula-tion, and therefore image noise aspects are difficult to compare between groups. However, there was no signifi-cant difference in the physical data between the two populations. Thirdly, the individual selection of the strength of IR on the basis of the preview series precludes more detailed comparisons of image noise between groups. Fourthly, image quality evaluation was based on the subjective impression of two readers. Fifthly, we ap-plied an edge-enhancing tissue convolution kernel (B50F for FBP) for reconstruction of data sets acquired with low-dose CT protocols. Choosing a tissue convolution kernel lower than 40 would probably have resulted in more CT data sets reconstructed with FBP being classified as diag-nostic. Sixthly, no diagnostic accuracy study was per-formed because no standard-dose chest CT was available in most patients for direct comparison. Thus, it was not possible to definitely differentiate if alterations in image quality with SAFIRE were true positive opacities. Sev-enthly, we did not investigate the image quality of the mediastinum. However, this study aimed at the evaluation of iterative reconstructions for CT imaging of the lung. Eighthly, readout of the CT data may not have been completely blinded to the reconstruction mode, as the image impression of iterative reconstructions usually differs from that from FBP. Ninthly, we did not compare SAFIRE to other noise-reducing algorithms. Finally, we did not evaluate whether or not low-dose chest CT studies at a submillisievert level with data reconstructed with SAFIRE are suited for accurate delineation of diffuse lung parenchymal disease. It is likely that the noise levels even in SAFIRE datasets are still too high to allow for the diagnosis of subtle interstitial lung disease.
In conclusion, our study results indicate that sinogram-affirmed iterative reconstruction reduces noise, improves image quality, and renders more low-dose CT studies of the lung diagnostic as compared to the conventional recon-struction mode FBP. Radiation dose of nonenhanced lung CT can be lowered down to a submillisievert level, while image quality still remains diagnostic when data are recon-structed with SAFIRE.
References
1. National Lung Screening Trial Research Team, Aberle DR, Adams AM, et al (2011) Reduced lung-cancer mortality with low-dose computed tomographic screening. N Engl J Med 365:395–409 2. Aberle DR, Berg CD, Black WC et al (2011) The National Lung
Screening Trial: overview and study design. Radiology 258:243–
253
3. Baldwin DR, Duffy SW, Wald NJ, Page R, Hansell DM, Field JK (2011) UK Lung Screen (UKLS) nodule management protocol: modelling of a single screen randomised controlled trial of
low-dose CT screening for lung cancer. Thorax 66:308–313
4. Bankier AA, Tack D (2010) Dose reduction strategies for thoracic multidetector computed tomography: background, current issues, and recommendations. J Thorac Imaging 25:278–288
5. Baumueller S, Alkadhi H, Stolzmann P et al (2011) Computed tomography of the lung in the high-pitch mode: is breath holding
still required? Invest Radiol 46:240–245
6. Cereser L, Zuiani C, Graziani G et al (2010) Impact of clinical data on chest radiography sensitivity in detecting pulmonary abnormal-ities in immunocompromised patients with suspected pneumonia.
Radiol Med 115:205–214
7. Christner JA, Zavaletta VA, Eusemann CD, Walz-Flannigan AI, McCollough CH (2010) Dose reduction in helical CT: dynamically adjustable z-axis X-ray beam collimation. AJR Am J Roentgenol
194:W49–55
8. Committee CDDICC (2008) The measurement, reporting, and management of radiation dose in CT. The American Association of Physicists in Medicine report no. 96. AAPM, College Park, MD 9. Costello P (1994) Thoracic helical CT. Radiographics 14:913–918 10. Heussel CP, Kauczor HU, Heussel G, Fischer B, Mildenberger P, Thelen M (1997) Early detection of pneumonia in febrile neutro-penic patients: use of thin-section CT. AJR Am J Roentgenol 169:1347–1353
11. Kalender WA, Buchenau S, Deak P et al (2008) Technical
approaches to the optimisation of CT. Phys Med 24:71–79
12. Kalra MK, Maher MM, Sahani DV et al (2003) Low-dose CT of the abdomen: evaluation of image improvement with use of noise
reduction filters—pilot study. Radiology 228:251–256
13. Kazerooni EA (2001) High-resolution CT of the lungs. AJR Am J
Roentgenol 177:501–519
14. Leipsic J, Nguyen G, Brown J, Sin D, Mayo JR (2010) A pro-spective evaluation of dose reduction and image quality in chest CT using adaptive statistical iterative reconstruction. AJR Am J
Roentgenol 195:1095–1099
15. McCollough CH, Bruesewitz MR, Kofler JM Jr (2006) CT dose reduction and dose management tools: overview of available options. Radiographics 26:503–512
16. McNitt-Gray MF (2002) AAPM/RSNA physics tutorial for resi-dents: topics in CT. Radiation dose in CT. Radiographics 22:1541– 1553
17. Moscariello A, Takx RA, Schoepf UJ et al (2011) Coronary CT angiography: image quality, diagnostic accuracy, and potential for radiation dose reduction using a novel iterative image reconstruc-tion technique-comparison with tradireconstruc-tional filtered back projecreconstruc-tion.
Eur Radiol 21:2130–2138
18. Naidich DP (2010) High-resolution computed tomography of the pulmonary parenchyma: past, present, and future? J Thorac
Imag-ing 25:32–33
19. Noel PB, Fingerle AA, Renger B, Munzel D, Rummeny EJ, Dobritz M (2011) Initial performance characterization of a clinical noise-suppressing reconstruction algorithm for MDCT. AJR Am J
Roentgenol 197:1404–1409
20. Paul NS, Blobel J, Prezelj E et al (2010) The reduction of image noise and streak artifact in the thoracic inlet during low dose and ultra-low dose thoracic CT. Phys Med Biol 55:1363–1380 21. Pontana F, Duhamel A, Pagniez J et al (2011) Chest computed
tomography using iterative reconstruction vs filtered back projec-tion (part 2): image quality of low-dose CT examinaprojec-tions in 80
patients. Eur Radiol 21:636–643
22. Pontana F, Pagniez J, Flohr T et al (2011) Chest computed tomog-raphy using iterative reconstruction vs filtered back projection (part1): evaluation of image noise reduction in 32 patients. Eur
23. Prakash P, Kalra MK, Ackman JB et al (2010) Diffuse lung disease: CT of the chest with adaptive statistical iterative
recon-struction technique. Radiology 256:261–269
24. Prakash P, Kalra MK, Digumarthy SR et al (2010) Radiation dose reduction with chest computed tomography using adaptive statistical iterative reconstruction technique: initial experience. J Comput Assist Tomogr 34:40–45
25. Schueller G, Matzek W, Kalhs P, Schaefer-Prokop C (2005) Pul-monary infections in the late period after allogeneic bone marrow transplantation: chest radiography versus computed tomography.
Eur J Radiol 53:489–494
26. Thibault JB, Sauer KD, Bouman CA, Hsieh J (2007) A three-dimensional statistical approach to improved image quality for
multislice helical CT. Med Phys 34:4526–4544
27. Vock P, Soucek M, Daepp M, Kalender WA (1990) Lung: spiral volumetric CT with single-breath-hold technique. Radiology
176:864–867
28. Winklehner A, Goetti R, Baumueller S et al (2011) Automated attenuation-based tube potential selection for thoracoabdominal computed tomography angiography: improved dose effectiveness. Invest Radiol 46:767–773
29. Winklehner A, Karlo C, Puippe G et al (2011) Raw data-based iterative reconstruction in body CTA: evaluation of radiation dose
saving potential. Eur Radiol 21:2521–2526
30. Yanagawa M, Honda O, Yoshida S et al (2010) Adaptive statistical iterative reconstruction technique for pulmonary CT: image quality of the cadaveric lung on standard- and reduced-dose CT. Acad