HAL Id: tel-00426893
https://tel.archives-ouvertes.fr/tel-00426893
Submitted on 28 Oct 2009
HAL is a multi-disciplinary open access archive for the deposit and dissemination of sci-entific research documents, whether they are pub-lished or not. The documents may come from teaching and research institutions in France or abroad, or from public or private research centers.
L’archive ouverte pluridisciplinaire HAL, est destinée au dépôt et à la diffusion de documents scientifiques de niveau recherche, publiés ou non, émanant des établissements d’enseignement et de recherche français ou étrangers, des laboratoires publics ou privés.
POLICY RESPONSE TO PRIVATE CAPITAL FLOWS
IN DEVELOPING COUNTRIES
Tidiane Kinda
To cite this version:
Tidiane Kinda. DETERMINANTS, CONSEQUENCES AND A POLICY RESPONSE TO PRIVATE CAPITAL FLOWS IN DEVELOPING COUNTRIES. Humanities and Social Sciences. Université d’Auvergne - Clermont-Ferrand I, 2009. English. �tel-00426893�
Faculté des Sciences Economiques et de Gestion
Centre d’Etudes et de Recherches sur le Développement International (CERDI)
LES DETERMINANTS, LES CONSEQUENCES ET LA GESTION
DES FLUX DE CAPITAUX PRIVES DANS LES PAYS EN
DEVELOPPEMENT
DETERMINANTS, CONSEQUENCES AND A POLICY RESPONSE
TO PRIVATE CAPITAL FLOWS IN DEVELOPING COUNTRIES.
Thèse Nouveau Régime
Présentée et soutenue publiquement en septembre 2009 Pour l’obtention du titre de Docteur ès Sciences Economiques
Par
Tidiane KINDA
Sous la direction de
M. le Professeur Jean-Louis COMBES et M. le Directeur de Recherche CNRS Patrick PLANE
Membres du jury:
Andrew BERG Assistant Director au Département de la Recherche, Fonds Monétaire International Jean-Louis COMBES Professeur, Université d’auvergne (CERDI) Jaime De MELO Professeur, Université de Genève
Gérard DUCHENE Professeur, Université de Paris XII
Patrick PLANE Directeur de recherche au CNRS (CERDI) Elisabeth SADOULET Professeur, University of California, Berkeley
L’Université d’Auvergne Clermont 1 n’entend donner aucune approbation ni improbation aux opinions émises dans les thèses. Ces opinions doivent être considérées comme propres à leurs auteurs.
Remerciements
La réalisation de cette thèse a été possible grâce à l’aide, au soutien, et aux conseils d’un certain nombre personnes. Je remercie particulièrement mes directeurs de thèse Jean-Louis Combes et Patrick Plane pour l’encadrement et l’attention dont j’ai bénéficié tout au long de ce travail. Leurs conseils et encouragements ont été des éléments majeurs pour la réalisation de cette thèse.
Je remercie également les membres du jury : Andrew Berg, Jaime de Melo, Gérard Duchêne et Elisabeth Sadoulet pour avoir accepté de rapporter cette thèse. Mes remerciements s’adressent aussi aux membres du CERDI, tant au personnel enseignant, chercheur, administratif, ou étudiant aussi bien qu’à mes amis à Clermont et ailleurs.
Je tiens à remercier particulièrement Léandre Bassolé, Mohamed Chaffai, Alain de Janvry, Ndiame Diop, Allassane Drabo, Rachid Laajaj, Melissa Lambert, Abdoul Mijiyawa, Luc Désiré Omgba, Elisabeth Sadoulet, Caitlin Sanford, ainsi que les participants aux séminaires de l’école doctorale et aux conférences auxquelles j’ai présenté mes travaux pour leurs critiques, suggestions et commentaires. Je remercie également Gaoussou Diarr a, Eric Djimeu, Christian Ebeke et Catherine Korachais.
Enfin, je tiens à souligner ma profonde reconnaissance à Anne-Sophie, à mes parents et à ma sœur Aminata pour leur amour, leur confiance, leur patience et leur soutien sans faille durant toutes ces longues années.
Table of contents
CHAPTER 1: GENERAL INTRODUCTION AND OVERVIEW
PART 1: DETERMINANTS OF PRIVATE CAPITAL INFLOWS
CHAPTER 2: INCREASING PRIVATE CAPITAL FLOWS TO DEVELOPING COUNTRIES: THE ROLE OF PHYSICAL AND FINANCIAL INFRASTRUCTURE CHAPTER 3: INVESTMENT CLIMATE AND FDI IN DEVELOPING COUNTRIES: FIRM-LEVEL EVIDENCE
PART 2: CONSEQUENCES AND A POLICY RESPONSE TO PRIVATE CAPITAL INFLOWS
CHAPTER 4: PRIVATE CAPITAL INFLOWS AND THE REAL EXCHANGE RATE IN DEVELOPING COUNTRIES
CHAPTER 5: INVESTMENT CLIMATE, FOREIGN OWNERSHIP, AND
AGGREGATE PRODUCTIVITY
Chapter 1: General Introduction and
Overview
Sustaining economic growth and pursuing a development agenda require considerable domestic resource mobilization as well as external finance. With limited and hardly predictable public flows, private capital flows have a major role in financing development needs. Private flows to developing countries help smoothing spending throughout the business cycle by financing saving gaps. Private flows also increase investments, contributing to higher economic growth and economic development in the recipient countries. For instance, a major component of private capital flows, the foreign direct investment is recognized to have beneficial effects on local firms and the economy at large. FDI gives more resources, facilitates technological and managerial knowledge transfers to the host countries, develops their international import and export network, creates job opportunities, and promotes economic growth. Policy makers often seek to attract external resources to finance savings gaps but also for their potential to generate growth and promote economic development (Dornbusch, 1998). This is an important issue in economics, business, and politics which calls for further analysis of the forces driving private flows and their potential consequences on the recipient economies.
Beyond their expected benefits, capital inflows also create important challenges for policy makers because of their potential to create macroeconomic instability and weaken the financial system. During the last three decades, the international economy has been largely marked by financial crises. The national and international economic environment contributed to these episodes of economic stagnation, but the destination and composition of private capital flows were also important factors. For instance, the lending boom following capital inflows episodes could reinforce the vulnerability of the financial system through bubbles in asset prices. Macroeconomic overheating following capital inflows could be in the form of an acceleration of economic growth and inflation, or a loss of competitiveness associated with the appreciation of the real exchange rate. Real exchange rate appreciation jeopardizes export competitiveness, widens the current account deficit, and increases the vulnerability to financial crises.
Developing countries often implement various policies to avoid the negative impact of private capital flows; for instance policies aiming to dampen the real appreciation of
the exchange rate due to capital inflows. The available policy responses include macroeconomic policies such as sterilization, exchange rate flexibility, and fiscal tightening as well as more structural policies such as capital controls, trade liberalization, and better regulation and supervision of the financial system.
All these issues remain contentious and the solutions offered in the empirical literature are inconclusive, raising the importance to reassess them. Within this framework, this dissertation aims to analyze empirically the forces driving private capital flows, their consequences on recipient countries’ competitiveness, and an effective policy response to manage capital inflows. Before dealing with each of these issues (chapter 2 to chapter 5), the following sections briefly present the main data issues on capital flows, some stylized facts on these flows, and the outline and main results of this dissertation.
1.
Data issues
There are two main data sources on external flows. A database can be constructed using borrowers or lenders data. On one hand, the main databases compiled by the IMF -the World Economic Outlook (WEO) and the Balance of Payments Statistics Yearbook (BOPSY)- come from the data reported by debtor countries. On the other hand, aid flows published by the Organization for Economic Co-Operation and Development (OECD) originate from the Development Agency Committee (DAC) members, which are the creditors. In its publication Global Development Finance (GDF), the World Bank mixes the two different data sources. Public and publicly guaranteed debt data are provided by member countries (the debtors) through the Debt Reporting System, while the short-term debt of some countries are derived from creditor sources (such as data on officially guaranteed suppliers’ credits compiled by the OECD) and lending from multilateral institutions and government lending agencies are confirmed by creditors’ statements and reports. The provision and the related-recording of debt relief in national accounts complicate the manipulation of data. Debt relief can be recorded in various ways depending on the creditors’ choice of the vehicle to provide it and the methodological choice of the authorities. Thus, it is
to different definitions and estimations of external public flows across databases (box 1).
The nature and composition of private sector flows are less subject to different treatment, definition, or interpretation (box 1). Most databases capture the net position of the main aggregates -liabilities are deducted from assets. Even though some discrepancies persist1, private capital flows are relatively homogeneous across
databases. Dorsey et al. (2008) show that correlation coefficients between private liabilities are above 0.6 during the period 1990-2000. During the same period, the authors also find that the correlation across databases is the highest for FDI flows (between 0.97 and 1). The correlation for other private flows (portfolio investment and other investment) is between 0.7 and 0.82. The BOPSY/IFS data are severely plagued
by missing observations while the GDF and WEO databases include much more information. This is because these two databases (WEO and GDF) use staff estimates to complete some missing observations. This dissertation focuses on the analysis of private capital flows and uses the WEO and GDF databases.
1 Some datasets focus on long-term capital flows, while others expand the spectrum of flows and include short-term flows.
2 See Dorsey et al. (2008) for a comprehensive analysis of private capital flows consistency across different databases.
Box 1. Definition and Coverage of External Financing Across Databases
The databases include the IMF World Economic Outlook (WEO) database, Balance of Payments Statistics Yearbook (BOPSY) database, and International Financial Statistics (IFS) database; the World Bank Global Development Finance (GDF) database; and the Development Agency Committee (DAC) of the OECD database.
Net inflows to the public-sector can be derived using:
WEO: Net debt flows to the public sector are estimated by summing up net liabilities to official debtors, debt forgiveness, and official debt securities, and deducting interest payments on external debt. Aggregated flows can be derived by adding current public transfers to net debt flows.
BOPSY: Public flows are calculated by adding current public transfers, debt forgiveness, official debt securities (being the sum of portfolio net liabilities to monetary authorities and the general government in form of bonds and notes and money market instruments) and net liabilities to official debtor (being the sum of other investment net liabilities in form of trade credits, loans and other liabilities to the general government; and other investment net liabilities in form of loans, currency and deposits, and other liabilities to monetary authorities).
GDF: This database provides disaggregated data on net resources flows on debt (loan disbursements minus principal repayments) and net transfers on debt (net resources flows on debt minus interest payments) by types of creditors. Grants (excluding technical cooperation grants) can be added.
DAC: It compiles Official Development Assistance (ODA) flows provided by DAC members. The flows are the sum of net ODA loans disbursements and ODA grants disbursements (the provision of debt relief is recorded through grants).
Net inflows to the private-sector can be derived using:
WEO: External financing to the private sector is the sum of direct investment in reporting economy, foreign purchases of equities of domestic companies, debt instruments issued by the domestic private sector, other investment liabilities to the private sector, and private current transfers.
BOPSY/IFS: Estimates of flows to the private sector are derived by adding direct investment in the reporting economy, portfolio investment liabilities (in form of equity and debt securities to the private sector), other private investment liabilities (the difference between other investment liabilities and net liabilities to the official debtors), and private current transfers.
GDF: Private sector flows are calculated by adding foreign direct investment, portfolio equity flows, bank and trade related lending, and workers’ remittances.
2.
Stylized facts of private capital flows to
developing countries
Since the Second World War, developing countries experienced three major episodes of surge in private capital inflows. The first one is associated with the oil price boom of the 1970s and the subsequent significant foreign investment in form of bank loans from oil exporting countries. It has been followed by a crisis of national debt in the beginning of the 1980s; the consequence of borrower countries unable to pay back their loans. The second surge in private capital inflows occurred in the aftermath of the debt crisis, during the second half of the 1980s. This second episode ended with two main financial crises: the Mexican crisis in 1994 and the Asian crisis in 1997. The third wave of private capital inflows is a shorter one. This wave started in the beginning of the 2000s and is expected to end with the current global financial and economic crisis triggered by the US mortgage market and the collapse of major financial institutions such as Lehman Brothers.
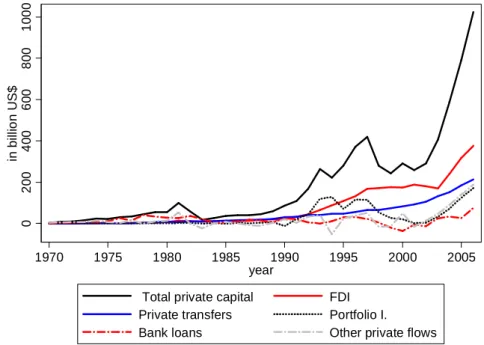
Figures 1.1 and 1.2 illustrate the evolution of private capital inflows to developing countries in absolute value and as a percentage of GDP, using WEO data.
Figure 1.1: Private capital flows to developing countries (in billion of US$)
0 2 0 0 4 0 0 6 0 0 8 0 0 1 0 0 0 in b ill io n U S $ 1970 1975 1980 1985 1990 1995 2000 2005 year
Total private capital FDI
Private transfers Portfolio I.
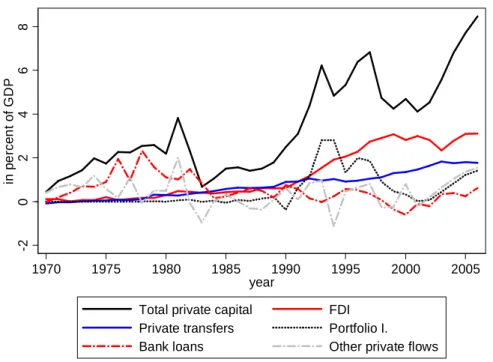
Figure 1.2: Private capital flows to developing countries (in percent of GDP) -2 0 2 4 6 8 in p e rc e n t o f G D P 1970 1975 1980 1985 1990 1995 2000 2005 year
Total private capital FDI Private transfers Portfolio I.
Bank loans Other private flows
Figure 1.1 indicates that private capital flows3 to developing countries have risen from
an almost null value to approximately 100 billion US dollar during the first wave (from 1970 to the beginning of the 1980s). In relative term, this represents a rise from 0.4 percent of GDP to almost 4 percent of GDP (figure 1.2). During this episode, private flows are mainly in form of banks loans. The observed decrease of private flows at the beginning of the 1980s illustrates the effects of the debt crisis.
Shortly after the debt crisis, developing countries observed a second wave of private capital inflows during the middle of the 1980s with private flows growing from approximately 1 percent of GDP of the recipient countries to almost 7 percent of GDP in 1997. During this second wave, FDI flows became the major component of private flows, rising from less than 1 percent of GDP to almost 3 percent of GDP and banks loans represented less than 1 percent of GDP. Portfolio investments are the major element determining this second episode of capital flows. Indeed, from almost 0
3 Private capital flows in this section are defined as the sum of FDI, portfolio investment, bank loans, private transfers, and other private flows.
percent of GDP during the 1980s, these flows grew steadily to reach almost 3 percent of GDP before the Mexican crisis and 2 percent of GDP before the Asian crisis. The deceleration of capital inflows observed in 1994 is the effect of the Mexican crisis that was largely restricted to countries in the region and affected mainly portfolio investments. Following the Mexican crisis, a new crisis hit the Asian countries in 1997. Although portfolio investments decreased sharply during this crisis (due to the contagion between short-term capital markets), the Asian crisis was mainly due to a collapse in private debts. During these two crises, FDI and private transfers pursued a robust growth.
The figures illustrate the beginning of a third wave of private capital inflows starting in the beginning of the 2000s. This wave is particularly dominated by a surge in FDI and private transfers that are relatively stable flows. Portfolio investment and private debt also participate in this new episode. The current financial and economic crisis is expected to mark the end of this wave of private flows.
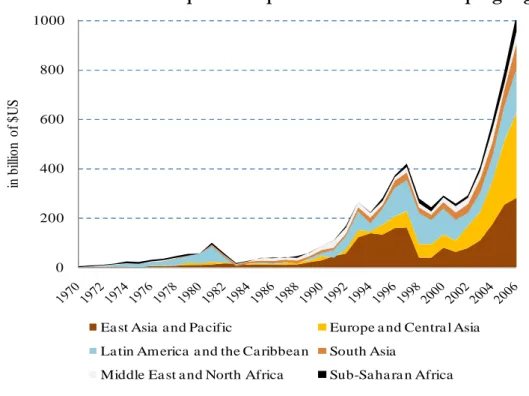
Beyond the evolution of private flows to developing countries, the distribution of these flows among the recipient countries is also important. In the developing world, some countries succeed in attracting foreign capital while others remain marginalized. Figure 1.3 illustrates rather well this unequal distribution of private flows across developing regions.
Figure 1.3: Distribution of private capital flows across developing region 0 200 400 600 800 1000 in b ill io n o f $ U S
Ea st Asia a nd Pa cific Europe a nd Centra l Asia La tin America a nd the Ca ribbea n South Asia
Middle Ea st a nd North Africa Sub-Sa ha ra n Africa
Most of countries in Europe and Central Asia were independent after 1990; thus interpreting the data for these countries makes more sense after this date. Although some caution is necessary because we interpret absolute values, a general view shows that Sub-Saharan African countries receive the lowest volume of private flows followed by countries in the Middle East and North Africa region. Latin American countries attracted the main part of private flows before the debt crisis. After this crisis, East Asia and Pacific countries became the major recipients of private flows. In the aftermath of the Asian crisis, private capital flows remained mainly directed to countries in East Asia and the Pacific but European and Central Asian countries became the second major recipients, followed by Latin American and the Caribbean countries.
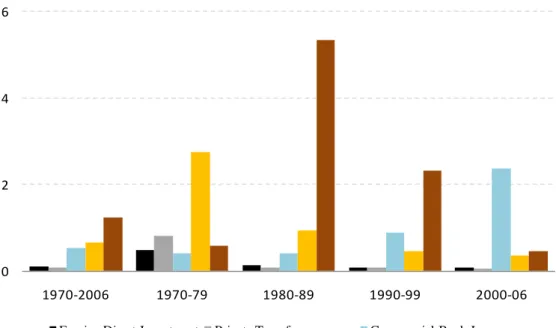
Private capital flows have been relatively volatile, albeit decreasingly so during the recent years. Volatility is estimated using the normalized standard deviation of de-trended inflows. Normalization is performed using the average flows during the period and the Hodrick-Prescott filter with a smoothing parameter of ten is used to de-trend the series. This method controls for the increasing trend of private flows during the
Figure 1.4: Volatility of private capital flows 0 2 4 6 1970-2006 1970-79 1980-89 1990-99 2000-06
Foreign Direct Investment Private Transfers Commercial Bank Loans Portfolio Investment Other Private Flows
Except commercial bank loans, there is an evidence of decreasing volatility of other private flows during the last three decades. FDI and private transfers exhibit the lowest volatility level. Commercial bank loans and other private flows (trade credits, deposits, etc.) are in average twenty times more volatile than FDI and private transfers are during the 1990s and the 2000s4. Portfolio investments are also relatively volatile,
averaging at least six times the volatility level of FDI and private transfers. The volatility of capital flows complicates their management for recipient countries. It contributes to a more instable macroeconomic environment and a higher vulnerability of economies due to the pro-cyclicality of capital inflows, particularly in developing countries.
The increasing volume of private capital inflows to developing countries, coupled with their unequal distribution across countries and region as well as the high instability of some forms of private flows raise a number of questions to which this dissertation aims to provide some insights. Why do some developing countries succeed better than
4 The significant volatility of commercial bank loans and other private flows during the 1980s is due to the succession of inflows and significant outflows -which started in the context of banking crises in 1990.
others in attracting foreign capital? What are the potential consequences of private capital flows for recipient countries competitiveness? How could developing countries attract capital flows while avoiding the associated negative effects?
3.
Outline and main results
This dissertation deals with the previously addressed questions through an empirical analysis. The first part of the dissertation analyzes the macroeconomic determinants of two forms of private flows: foreign direct investment (FDI) and portfolio investment. This analysis is completed by a firm-level study of the determinants of FDI in the manufacturing sector. In the second part, the dissertation analyzes the consequences of foreign capital for local economies. This is done through two main channels: the positive impact of foreign investment on aggregate productivity and the negative effect of capital inflows on countries’ competitiveness captured by the appreciation of the real exchange rate. This second part concludes with the analysis of a main policy response to dampen the real appreciation of the exchange rate stemming from capital inflows. The next sections summarize the main findings of this dissertation.
Combining the classical “push-pull factors” and the “Lucas paradox” theoretical approaches, and controlling for the relationship between two forms of private capital flows -through Three Stage Least Square (3SLS) estimations-, the second chapter shows that physical infrastructure and financial development positively affect FDI and portfolio investment using a sample of 58 developing countries. The analysis highlights the importance of non-linearity when assessing the role of financial development for portfolio investment inflows. Indeed, a lax monetary policy and excessive credit provision could weaken the financial system and significantly reduce portfolio investment flows. This indicates the importance of sound monetary policy and strong oversight of the financial system. The results also show that for Sub-Saharan African countries, better physical infrastructure attracts more FDI.
first empirical analysis of the importance of the investment climate for FDI with a large sample of developing countries. FDI is characterized by the presence of at least 10% of foreign ownership in firms’ capital, following the IMF standard definition. Investment climate constraints are defined by two principal factors: first, physical and financial infrastructure problems, and second, human capital constraints and institutional problems. The main results show that physical infrastructure problems, financing constraints, and institutional problems discourage FDI. An innovative breakdown analysis between exporter and non-exporter firms shows that foreign firms that supply foreign markets are more affected by physical infrastructure problems but financing constraints affect more foreign firms that supply local markets. Exporter foreign firms are also more constrained in their activity by the lack of skilled workers compared to firms supplying the domestic market. Corruption and tax rate represent obstacles for FDI but trade and customs regulations encourage FDI. This last finding follows the theory of horizontal FDI according to which foreign firms aiming to supply the local market may look for protected countries with high trade barriers, giving them price advantages. The results also highlight the importance of institutional quality for FDI in Sub-Saharan African countries. Finally, tax incentives in the manufacturing sector are relevant for developing countries other than the African ones.
While most of studies focus on the effect of aggregated or specific form of capital inflows on the real exchange rate with mixed results, the fourth chapter proposes a comprehensive analysis of the impact of different forms of private capital flows on the real exchange rate. This chapter also assesses the flexibility of the exchange rate as a hedge against the real appreciation. Based on a sample of 42 developing countries, the chapter uses the newly developed panel co-integration method (the pooled mean group estimator) that allows short-run heterogeneity while imposing long-run homogeneity of the real exchange rate determination across countries. The results show that aggregated capital inflows as well as public and private flows appreciate the real exchange rate. Among private flows, portfolio investment has the highest appreciation effect on the real exchange rate, almost seven times the appreciation level due to FDI or banks loans. FDI and bank loans are relatively more related to an increase in the productive
capacity compared to portfolio flows. Private transfers (mainly remittances) lead to the lowest appreciation of the real exchange rate compared to the other forms of private flows. This suggests more counter-cyclical remittances aiming to smooth consumption during economic slowdown. Countries often implement various policies to offset or avoid the loss of competitiveness associated with the appreciation of the real exchange rate following capital inflows. This chapter assesses the effectiveness of one of the main macroeconomic tools: the exchange rate policy. Using for the first time a de facto measure of exchange rate flexibility (in a real exchange rate framework), we find that allowing higher flexibility of the exchange rate dampen the appreciation of the real exchange rate stemming from capital inflows.
With a particular attention to foreign ownership, the last chapter analyzes productive performances of the manufacturing industry by considering the “one step” stochastic frontier approach where production technology and efficiency determinants are simultaneously estimated. Using manufacturing firm-level data for a sample of five developing countries, we find that average productivity scores broadly reflect international per capita GDP differences and foreign firms are more productive than local companies. Differences in infrastructure quality, in access to finance, in the availability of skilled labor, as well as in institutional quality significantly explain productivity disparities. We propose for the first time differences in the investment climate faced by foreign and local companies as major factors contributing significantly to the higher productivity of foreign firms. Indeed, foreign companies could positively influence their investment climate or locate where the investment climate is better. Adjusting efficiency to the best investment climate in each country -the investment climate faced by foreign firms- highlights efficiency gains ranging from less than 10% in South Africa to about 25% in Pakistan. In contrast with former studies that estimate spillovers effects at sector-level, we propose an innovative way to address this issue. We use, for the first time, the share of each firm’s sales to multinationals located in the country to assess the importance of vertical spillovers. The results show that firms, particularly local and small-local firms selling higher part of their production to foreign
The rest of the dissertation is organized as follows: The first part analyzes the determinants of private capital flows using macroeconomic and firm-level data (chapter 2 and chapter 3). The second part investigates the consequences of private capital flows on countries’ competitiveness measured by the real exchange rate and firms’ aggregate productivity (chapter 4 and chapter 5). The last part proposes the general conclusion.
PART I: DETERMINANTS OF
PRIVATE CAPITAL INFLOWS
Chapter 2:
Increasing Private Capital Flows to
Developing Countries: The Role of
Physical and Financial Infrastructure
1. Introduction
According to the neoclassical economic theory -assuming free capital markets and diminishing returns-, capital should flow from capital abundant countries (developed countries) to capital scarce countries (developing countries) leading to the equalization of marginal returns to capital. In reality, this theoretical prediction is not observed, leading to an important paradox in international macroeconomics: the “Lucas paradox”. Private capital flows are important in financing development, especially in the context of insufficient and unstable aid, which makes it crucial to understand why the neoclassical theory is not observed. Why does capital not flow to developing countries where their marginal return is higher? Answering this question requires the study of the determinants of private capital flows. For foreign private capital, we consider net flows of FDI, portfolio investments and debts.
Following the Asian crisis, a number of studies on the determinants of private capital flows emerged. These studies were generally based on an approach that distinguishes between external determinants (exogenous to the economy receiving capital, or “push factors”) and internal determinants5 (under the recipient economy’s control, or “pull
factors”). The analysis of external factors explains how the economic conditions of capital-exporting countries (developed countries) influences capital inflows in developing countries. These external factors reflect the opportunity cost of investment in these countries. The international interest rate and world growth rates, generally approximated by those of the United States, are the most influential factors. Low profit in developed countries is a significant cause of capital flows to developing countries where profits’ prospects can be more promising. One of the first analyzes of private capital flows determinants was made by Calvo, Leiderman and Reinhart (1993). Using a sample of 10 Latin American countries over the period 1988-1991, they find that
5 Studies also focus on contagion during episodes of surges in private capital flows between large countries and their smaller neighbours who benefit from externalities resulting from the high attractiveness of the large countries (Calvo et al.. 1996, Hernandez, Medallo, and Valdes 2001). A competition between countries of the same area for better attractiveness to private capital flows could also happen (Kang and al., 2003).
capital flows are mainly influenced by the external factors, namely the growth rate and the interest rate of developed countries. Many authors showed the importance of the external factors (international interest rate and international growth rate) in determining private capital flows (Calvo et al., 1996; Fernandez-Arias, 1996; Montiel and Reinhart, 1999; Kim, 2000; Ying and Kim, 2001; Ferrucci et al., 2004). A greater number of studies revealed the dominant role of internal factors (macroeconomic conditions of the recipient country) in the explanation of private capital inflows (Root and Ahmed, 1979; Schneider and Frey, 1985; Fernandez-Aria, 1996; Ahn et al., 1998; Gastanga et al., 1998; Asiedu, 2002). Internal factors are the macroeconomic conditions of the recipient country that influence private capital flows to this country. A stable macroeconomic environment is favourable to investment decisions, creation of value added, and productivity. Internal factors include economic growth rate, inflation, trade openness, education, and political stability, which can be influenced by national-level policies. Studies that are more recent use the “Lucas paradox” to explain the determinants of private capital flows6. Following Lucas, these studies differentiate
the determinants of capital flows into economic fundamentals with the ability to affect the production structure (education, institutions, and so forth) and capital market imperfections (mainly informational asymmetry). Alfaro et al. (2006a, 2006b), through a cross-sectional study, find that the “Lucas paradox” is explained by the quality of institutions, education, inflation and financial development. According to Reinhart and Rogoff (2004), the “Lucas paradox” exists because of political risk and credit market imperfections. Reinhart and Rogoff (2004) argue that the reduction of credit market imperfections through better institutions would allow externalities, in particular those related to the human capital, to play a more significant role. Recent studies also illustrated the importance of business environment for private capital flows (Martin and Rose-Innes, 2004; Asiedu, 2006; Naudé and Krugell, 2007; Bénassy-Quéré et al. 2007; IMF, 2007; IMF, 2008).
6 A very recent approach, applied to emerging countries, consists in the estimation of a model of supply and demand of capital flows. Then using the maximum likelihood method, this approach
All of these studies lead to different conclusions about the factors which significantly influence private capital inflows to a country. Another crucial element to attracting FDI is building industrial capacity. This includes developing infrastructure and human capital; strengthening institutional capabilities and economic openness; and promoting sound macroeconomic policies (low inflation, strong and sustainable economic growth). The purpose of this study is to extend the “Lucas paradox” approach (which considers only the economic fundamentals7 and capital market imperfections), by
integrating external factors from the traditional approach (“push-pull factors”). Emphasis will be given to physical infrastructure and financial development that have received insufficient attention in the literature (especially for financial development) given the importance of their contribution for countries attractiveness to private capital flows. We will analyze aggregated private capital flows and their components. Breaking-up aggregate private capital flows allows the differentiation between short-term and long-short-term flows, which can have some common deshort-terminants while other factors are specific to certain flows. Contrary to past studies, this paper, for the first time, takes into account the relationship between different components of private capital and non-linearity effects of physical infrastructure and financial development.
The rest of the paper is organised in two main sections: the first section analyzes the theoretical relation between private capital flows, physical infrastructure and financial development and describe a simple model based on the “Lucas paradox” approach. The second part of the study is devoted to the empirical analysis of the determinants of private capital flows followed by robustness checks. The last part concludes.
2. Physical Infrastructure and Private Capital Flows
A large number of studies (The World Bank, 1994; Temple 1999; Demurger, 2001; Willoughby, 2003) highlight the role of infrastructure (telecommunications, electricity, etc.) for economic growth and development. Beyond its direct effect on economic growth, infrastructure also affects growth by increasing private investment8. A greateravailability of infrastructure increases the output of private investment by reducing transactions costs and enabling firms to get closer to their customers and suppliers, making it possible for the firms to increase their potential markets and thus their opportunities for profit. Well-developed telecommunications infrastructure, for example, can help firms to access financial resources through financial markets. Firms that do not have access to modern telecommunication services, reliable provision of electricity, or developed road systems invest less and have less productive investments (regardless of whether they are local or foreign). When the provision of well-functioning infrastructure fails, firms are sometimes forced to pay the costs of providing infrastructure themselves, such as electricity through power generating units, in order to continue their activities. This type of provision is generally more costly than traditional infrastructure provision. In addition to these high costs of provision, firms also support other costs due to damages caused by power outages.
The determinants of FDI may vary according to their type. FDI in manufacturing, services or in oil, gas and mineral extraction may have different determinants. Moreover, variables such as infrastructure, education or inflation may have different effects depending on the destination of FDI.
In previous studies, the importance of physical infrastructure in determining the attractiveness of foreign private capital essentially focused on FDI. Loree and Guisinger (1995) find that countries with developed infrastructure (measured by a multidimensional index of infrastructure) receive more FDI from United States. Wheeler and Mody (1992) and Mody and Srinivasan (1998) find similar results. Kumar (2002), with a sample of 66 countries over 1982-1994, finds that the development of
infrastructure, measured by a composite index, has a positive effect on FDI inflows. Ngowi (2001), Asiedu (2002) using a sample of African countries, and Jenkins and Thomas (2002), using a sample of Southern African countries, obtain similar results. The limited resources of public sector in developing countries, coupled with profitable opportunities in some infrastructure projects (electricity, telecommunications, etc.), lead to the provision of infrastructure by the private sector. Given the high cost of infrastructure investments, private corporations carrying out this type of investment are generally foreign. Sader (2000) finds that between 1990 and 1998, 17% of FDI flows received by developing countries were directed to infrastructure projects. According to Ramamurti and Doh (2004), FDI financing infrastructure represents one third of capital inflows to developing countries in the beginning of the 1990s.
3. Financial Development and Private Capital
Flows
Financial development may increase private investments due to better access of firms to capital9. With the emergence of financial intermediaries, financial development
reduces transactions costs through lower informational asymmetry and better risk management and coverage. The reduction of informational asymmetry through financial intermediaries has a considerable effect on foreign capital and investments. In fact, in addition to the informational asymmetry supported by the local entrepreneurs, the distance between foreign investors and local markets generally increases this already existing information asymmetry. Foreign investors know neither the opportunities nor the risks of the local market as well as local investors do. Financial intermediaries can provide information about local market risks, providing more credibility to potential profit in the country. This stimulates the entry of new investors, in particular foreign investors, in the local market. Huang (2006), focuses only on domestic investment, but suggests an empirical model for the importance of financial development on investment. Using a sample of 43 developing countries over 1970-1998, he finds that financial development significantly and positively affects private
investment. The author also concludes that private investment has a positive and significant effect on financial development. A developed financial sector also facilitates interactions between foreign and local firms and their suppliers and clients. The importance of financial intermediaries could also vary according to the type of private flows. Indeed, even if financial development significantly explains countries’ attractiveness to FDI and debts, financial intermediaries’ contribution for portfolio investments is more significant. Portfolio investments generally require the pre-existence of a stock market and thus a relatively developed financial sector. Financial development, itself, can imply the entry of new banks or new actors in the local market. The process of financial liberalization with bank privatization implies acquisitions in the form of FDI or portfolio investment, increasing of foreign private capital inflows. The importance of financial development for FDI could however be reduced with the entry of multinational banks which tend to follow their corporate clients.
As mentioned by Levine (1997), studies on financial development and investments generally do not distinguish domestic investments from foreign investments. Focusing only on foreign capital, this study enriches the scarce literature on this topic. To the best of our knowledge, very few studies deal specifically with the effect of financial development on private capital flows, precisely FDI. Hausmann and Fernandez-Arias (2000) find that countries with the least developed capital markets tend to have more FDI inflows. According to the authors, FDI can be alternative financing for the firms which do not have access to capital markets. However, using a sample of 81 foreign firms based in Southern African countries, Jenkins and Thomas (2002) show that South Africa attracts relatively more FDI than other African countries because of its developed financial system. Montiel (2006), in a theoretical analysis, argues that Africa does not attract enough foreign private capital to finance sectors with high potential profits because of Africa’s human capital weakness, lack of infrastructure, and bad institutional quality. Montiel (2006) underlines that when African countries are relatively well endowed in these factors; financial underdevelopment explains their low
4. The Theoretical Model
The “Lucas paradox” is derived from a simple neoclassical growth model assuming a common technology to all economies. Let us consider a Cobb-Douglas production function with constant return to scales, representing a small open economy in which the production (Y) is obtained from the combination of capital (K) and labor (L).
Yt = At F (Kt, Lt) = At Kt α Lt1 –α with F' (.)>0, F'' (.)<0, F(0)=0 (1)
A is the productivity factor and reflects the technological level which can be stock of human capital (Lucas, 1990). Assuming a common technological level in all economies and perfect capital mobility, capital will flow from most endowed economies (in capital) to the least endowed countries because of the property of diminishing returns. That would lead to a convergence and equality of the interest rates. Considering two economies i and j, the interest rate rt would be defined as follows:
At f' (kit) = rt = At f' (kjt) (2)
However, the prediction of interest convergence is not observed, leading to the “Lucas paradox”. According to Lucas, this paradox is mainly due to capital market imperfections (mostly informational asymmetry) and differences in economic fundamentals between countries, implying a difference of the technological factors (At). A could reflect for instance, available infrastructure, which is generally external to
the firm. If i is a more developed country than j, then Lucas supposes that Ait is higher
than Ajt which explains the fact that country i attracts more capital than the country j
(kit > kjt) since the return of the capital is higher there. Giving-up the assumption of common technology between countries, the real return of capital becomes:
Ait f' (kit) > Ajt f' (kjt) (3)
With more detail, equation (3) can be rewritten as followed:
With Iit and Ijt, the infrastructure available in country i and j during the period t. Ait and
Ajt represent other technological factors such as human capital, institutions, and
macroeconomic conditions.
5. Empirical Analysis
5.1. Data and variables
The data cover the period 1970-2003 (subdivided into five periods of five years) and we retain for the regressions 58 developing countries.10 The variables for private capital
flows are FDI, portfolio investments, debts, and private capital -defined as an aggregate of the three types of private capital11. For the econometric analysis, we will
only retain FDI and portfolio investments as variables of capital inflows for several reasons. After the debt crisis, data on debts suffer from significant measurement errors (Alfaro et al., 2006a, 2006b). The principal reason is the lack of data on debts existing exclusively between private agents (debt data used here are issued by private economic agents but can be contracted by private or public sector)12. These debts, contrary to the
FDI and portfolio investments, reflect not only market incentives but also government’s decisions; the objective of this chapter being to analyze market
10 Central and Eastern European Countries (CEEC) are not taken into account in the regressions since the majority of these countries was created after 1990 whereas one of our objectives is to evaluate a differentiated effect before and after the 1990’s financial crises.
11 Foreign direct investment is net inflows of investment to acquire a lasting management interest (10 percent or more of voting stock) in an enterprise operating in an economy other than that of the investor. It is the sum of equity capital, reinvestment of earnings, other long-term capital, and short-term capital as shown in the balance of payments. Portfolio investment flows are net and include non-debt-creating portfolio equity flows (the sum of country funds, depository receipts, and direct purchases of shares by foreign investors). Bank and trade-related lending covers commercial bank lending and other private credits. (WDI 2005).
incentives. After the debt crisis for instance, the government of developing countries contracted a significant share of private debt.
Since 1970, developing countries have seen three episodes of massive surge in capital flows13. Beyond the evolution of private capital flows, their repartition is largely
unequal, highlighting a marginalisation of Sub-Sahara African countries.
We use the proportion of the subscribers of fixed and mobile phone service in the population and the electric consumption per capita as the proxies for physical infrastructure. Although these variables approximate well the infrastructure available in a country, an addition excellent proxy for physical infrastructure would be the density of the road network in each country. Data missing problem do not allow the use of this last variable. Financial development is captured by three variables: the ratio of liquid liabilities to the GDP (M3/GDP), the ratio of bank credit to the private sector over the GDP, and the ratio of financial system deposits to the GDP. In accordance with the theoretical and empirical literature, we control for other important variables. Appendix 1 gives the list, definitions and sources of all variables.
5.2. Estimations
Although the objective of this chapter is not to test the existence of the “Lucas paradox,” but rather its explanation, it is interesting to investigate whether this paradox, so far established between developed and developing countries can also be observed among developing countries. In other words, are countries with higher income level among developing countries receiving more private capital flows? The results, in appendix 5, show that among developing countries, private capital are more directed towards countries with higher GDP per capita, confirming the existence of “Lucas paradox” among developing countries.
13 The general introduction (chapter 1) presents a comprehensive analysis of the trends, composition, and repartition of private capital flows to developing countries.
The analysis of the effects of physical infrastructure and financial development on private capital inflows is based on the following equation. It includes capital market imperfections and economic fundamental variables to explain the “Lucas paradox” and variables specific to capital exporters’ countries in accordance with the “push-pull factors” approach:
jt j jt jt jt t jt
Ci = +λ βInf +δFin +φX +λ ε+ (1) Cijt, is a type i of private capital flow received by the country j in year t. Infjt is the
variable of physical infrastructure and Finjt the variable of financial development. Xjt is
the matrix of the control variables. The country and time fixed effects are respectively
λj and λt while εjt is the error term. Because our sample is only made up of developing
countries, the time fixed effects capture external factors (“push factors”). The growth rate or the interest rate of the developed countries, important variables in the determination of short-term capital flows (particularly portfolio investments), represent common shocks to all developing countries that are captured by the time fixed-effects. Capital market imperfections, which can be approximated by the distance between countries, reflecting informational asymmetry (Coval and Moskowitz, 1999, 2001), are taken into account in the country fixed effects.
The two equations of capital inflows could be estimated with standard fixed effect method. However this would suppose that the amount of the FDI received by a country is independent of the amount of portfolio investments received by this country (in other words, error terms of the two equations are not correlated). This rather restrictive assumption is not verified since a high number of identical variables explain the two components of capital flows. For instance, significant inflows of FDI in a country can stimulate the inflows of portfolio investments. It is thus important to consider the correlation of error terms that can affect the significance of the coefficients. The empirical model for estimation will be a system of equations as follows:
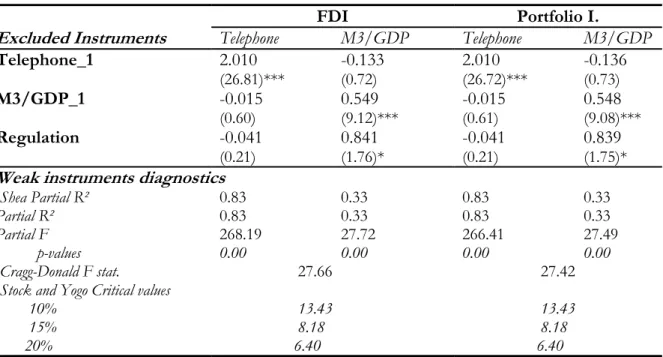
FDIjt and PORTjt represent net inflows of FDI and portfolio investments in country j in year t, respectively. The definition of the other explanatory variables remains identical to those given in equation 1. The use of Seemingly Unrelated Regression (SUR) would be more efficient than the standard fixed effect model (Arellano, 1987) since SUR takes into account the correlation between the errors terms. It is very likely that private capital flows received by a country affect its financial and physical infrastructure development. This potential reverse causality, as explained in the theoretical section, can be a source of endogeneity. In order to solve this problem, which is confirmed by the Nakamura-Nakamura test, we define three instruments: the lagged value of physical infrastructure variable, the lagged value of financial development variable, and the regulation of credit market as financial development variable instrument.14 Instruments diagnostic with first-stage regressions statistics
(partial R², Shea partial R², partial F-test, Cragg-Donald Statistics) reject the hypothesis of weak instruments (table 1).
Table 2.1 First-stage equation
FDI Portfolio I.
Excluded Instruments Telephone M3/GDP Telephone M3/GDP
Telephone_1 2.010 -0.133 2.010 -0.136 (26.81)*** (0.72) (26.72)*** (0.73) M3/GDP_1 -0.015 0.549 -0.015 0.548 (0.60) (9.12)*** (0.61) (9.08)*** Regulation -0.041 0.841 -0.041 0.839 (0.21) (1.76)* (0.21) (1.75)*
Weak instruments diagnostics
Shea Partial R² 0.83 0.33 0.83 0.33
Partial R² 0.83 0.33 0.83 0.33
Partial F 268.19 27.72 266.41 27.49
p-values 0.00 0.00 0.00 0.00
Cragg-Donald F stat. 27.66 27.42
Stock and Yogo Critical values
10% 13.43 13.43 15% 8.18 8.18 20% 6.40 6.40
* significant at 10%; ** significant at 5%; *** significant at 1%
14 This variable of credit market regulation indicates governments’ constraints or incentives in term of control of interest rates on deposits and bank loans. An instrument for financial development, commonly used in the literature is the legal origin. This instrument cannot be used in our case since it is already included in the country fixed effects.
For the estimations, we use three stage least squares (3SLS) which, like two stage least squares (2SLS), deals with the endogeneity problem but also takes into consideration the correlation between the errors terms of the equations like SUR method. Under the null assumption of good specification of all equations in the model, 3SLS is more efficient since it deals with the correlation of different equations’ error terms. However, when at least one equation in the system is misspecified, this misspecification extends to all systems by the correlation of error terms, leading to biased and less consistent coefficients. In this case, the 2SLS estimator, although less efficient, is preferable since there is no correlation in error terms and it is consistent, even in the case of the misspecification of one equation in the system. Although results obtained by the 2SLS do not differ significantly (appendix 8), a Hausmann test confirms the preference for 3SLS.
5.3. Results
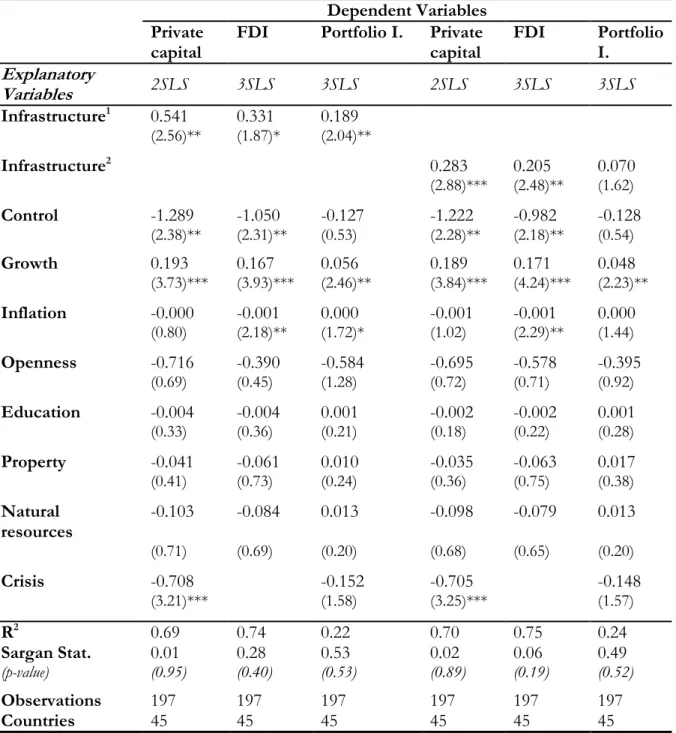
We first consider an index of physical and financial infrastructure obtained with principal components analysis that avoids colinearity problems between infrastructure variables. A second method of aggregation used is the standardisation of variables. This method is similar to principal component analysis but it gives an equivalent weight to each variable in the calculation of the index. The indexes include five variables: the proportion of subscribers of fixed and mobile phone, the electric consumption per capita, the ratio M3/GDP, the credit to private sector, and the deposits in financial institutions. The following table gives the results of estimations with aggregated indexes.
Table 2.2: Estimation with physical and financial infrastructure index Dependent Variables
Private capital
FDI Portfolio I. Private capital FDI Portfolio I. Explanatory Variables 2SLS 3SLS 3SLS 2SLS 3SLS 3SLS Infrastructure1 0.541 0.331 0.189 (2.56)** (1.87)* (2.04)** Infrastructure2 0.283 0.205 0.070 (2.88)*** (2.48)** (1.62) Control -1.289 -1.050 -0.127 -1.222 -0.982 -0.128 (2.38)** (2.31)** (0.53) (2.28)** (2.18)** (0.54) Growth 0.193 0.167 0.056 0.189 0.171 0.048 (3.73)*** (3.93)*** (2.46)** (3.84)*** (4.24)*** (2.23)** Inflation -0.000 -0.001 0.000 -0.001 -0.001 0.000 (0.80) (2.18)** (1.72)* (1.02) (2.29)** (1.44) Openness -0.716 -0.390 -0.584 -0.695 -0.578 -0.395 (0.69) (0.45) (1.28) (0.72) (0.71) (0.92) Education -0.004 -0.004 0.001 -0.002 -0.002 0.001 (0.33) (0.36) (0.21) (0.18) (0.22) (0.28) Property -0.041 -0.061 0.010 -0.035 -0.063 0.017 (0.41) (0.73) (0.24) (0.36) (0.75) (0.38) Natural resources -0.103 -0.084 0.013 -0.098 -0.079 0.013 (0.71) (0.69) (0.20) (0.68) (0.65) (0.20) Crisis -0.708 -0.152 -0.705 -0.148 (3.21)*** (1.58) (3.25)*** (1.57) R2 0.69 0.74 0.22 0.70 0.75 0.24 Sargan Stat. 0.01 0.28 0.53 0.02 0.06 0.49 (p-value) (0.95) (0.40) (0.53) (0.89) (0.19) (0.52) Observations 197 197 197 197 197 197 Countries 45 45 45 45 45 45 z statistics in parentheses.
All regressions include time and country fixed effects. * significant at 10%; ** significant at 5%; *** significant at 1% 1 Infrastructure index by principal component analysis 2 Infrastructure index by standardization
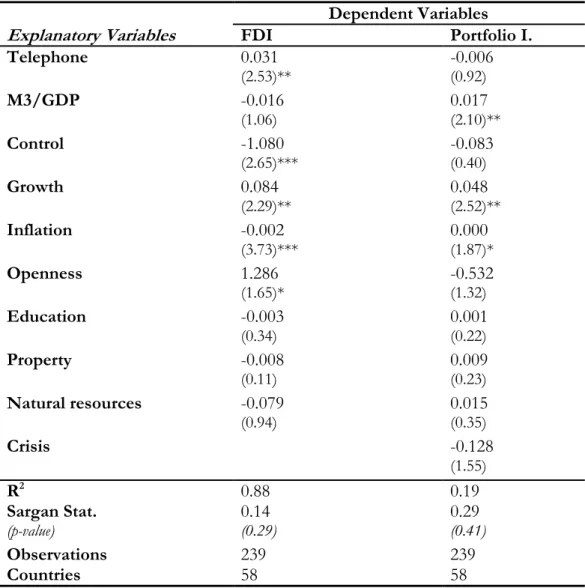
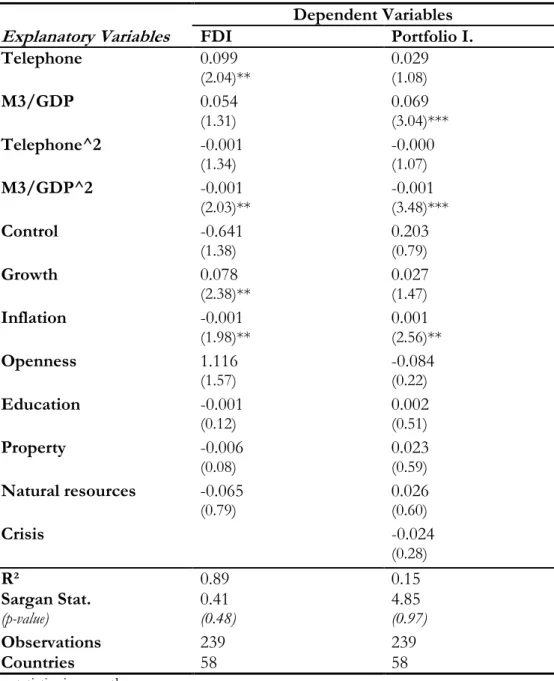
Before interpreting the results obtained with the infrastructure index, we separately estimate the equations with individual variables of infrastructure in order to address criticisms generally made to aggregate indicators that cannot distinguish the partial contribution of each variable. The following table gives the results of estimations considering a proxy for physical infrastructure (the proportion of fixed and mobile phone subscribers) and another one for financial development (M3/GDP) separately.
Table 2.3: Estimation (3SLS) with differentiation of physical and financial infrastructure
Dependent Variables
Explanatory Variables FDI Portfolio I.
Telephone 0.031 -0.006 (2.53)** (0.92) M3/GDP -0.016 0.017 (1.06) (2.10)** Control -1.080 -0.083 (2.65)*** (0.40) Growth 0.084 0.048 (2.29)** (2.52)** Inflation -0.002 0.000 (3.73)*** (1.87)* Openness 1.286 -0.532 (1.65)* (1.32) Education -0.003 0.001 (0.34) (0.22) Property -0.008 0.009 (0.11) (0.23) Natural resources -0.079 0.015 (0.94) (0.35) Crisis -0.128 (1.55) R2 0.88 0.19 Sargan Stat. 0.14 0.29 (p-value) (0.29) (0.41) Observations 239 239 Countries 58 58 z statistics in parentheses.
All regressions include time and country fixed effects. * significant at 10%; ** significant at 5%; *** significant at 1%
Beside the instrument diagnostic tests which reject the hypothesis of weak instruments, the Sargan overidentification test does not reject the validity of the instruments. Control variables have almost identical effects when considering the index of infrastructure or individual variables of infrastructure and financial development. The macroeconomic instability, characterised by a high inflation or a banking crisis negatively affects FDI and portfolio investments respectively (table 2.2). Inflation positively affects portfolio investment. This result could illustrate the fact that Latin American countries, which attract an important part of portfolio investment in the sample, have higher inflation, particularly during the Mexican crisis of 1994. Capital controls15 have a negative effect on private capital inflows and a good economic
performance characterised by a high growth rate positively influences private flows. Countries that are more open also receive more FDI.16
Concerning the two variables of interest, the index of physical and financial infrastructure, either obtained by the principal components analysis or by the standardisation method, positively and significantly affects private capital flows and each of its components (FDI and portfolio investments). Physical and financial
15 The measure of capital control is the average of proxies of government restrictions that affect capital mobility (capital account restrictions, current account restrictions, presence of multiple exchange rates and repatriation requirements for export proceeds). There is a structural break in capital account data series in 1996 when the IMF started to report more details on capital account -permitting a measure of the intensity of capital account restriction - instead of the dichotomous variable. That makes the data before and after 1996 not entirely comparable. Quinn (1997) and Mody and Murshid (2005) have constructed single data series using the IMF publications. Chinn (2004) finds also that Quinn index explain 71 percent of the four variables we used to construct our index before 1996. As Mody and Murshid (2005), a robustness check using a truncated sample (before 1996) does not change our results.
16 Education does not affect significantly private capital flows to developing countries. According to the type of FDI (vertical FDI or horizontal FDI), multinational firms will look for unskilled cheap labor or skilled more expensive labor force. Urata and Kawai (2000) find that skilled labor availability discourages Japanese FDI. After a breakdown analysis, the authors show that skilled labor positively affects FDI in developed countries but the effect is not significant for developing countries.
infrastructure have a stronger impact on FDI than on portfolio investments, but this result gives no indication of the respective importance of physical or financial infrastructure in the attractivity of FDI or portfolio investments. Table 2.3 deals with this question by underlining the fact that physical infrastructure only affects FDI inflows while financial infrastructure only has a significant effect on portfolio investments. Indeed, a rise of 1 percentage point in the number of fixed and mobile phone subscribers increases FDI inflows by 0.03 percentage point. This result illustrates the existence of a minimal condition in order to guarantee prosperity of investments and thus attract FDI. A large number of economic activities (especially industrial ones) require a minimum of communication infrastructure (telephone, roads) allowing or facilitating the access to raw and intermediate materials but also the access to markets, reducing production costs. The government usually provides financing for infrastructure since firms can hardly support the cost. The existence of infrastructure thus creates a favourable business environment, encouraging investments, particularly foreign investments.
Portfolio investments are more volatile and relatively scarce in developing countries. Of the two infrastructure variables, only financial development significantly and positively affects portfolio investment flows to developing countries. A rise of 1 percentage point of liquidity liabilities increases portfolio investments by 0.02 percentage point. Inflows of portfolio investments require a high level of financial development since this form of capital flow is most frequently negotiated in stock markets. By improving information sharing, developed financial markets reduces transaction costs and the potential risk taken by investors.17
17 The analysis shows that FDI and portfolio investments are mostly explained by identical determinants. It is important to pinpoint that some specific determinants of portfolio investments relate to the international economic situation, mainly the international interest rate and growth rate, approximated by those of the developed countries. As mentioned above, these important variables in the determination of portfolio investments are captured by time fixed-effects.
5.4. Robustness check and African specificity
5.4.1. Alternative explanatory variables
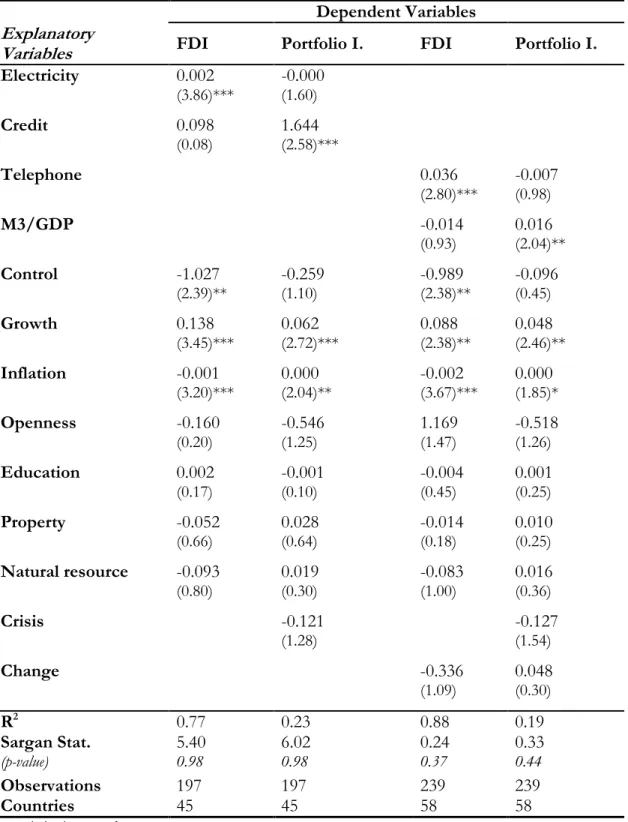
The literature suggests several variables that capture the physical infrastructure or financial development of a country. We considered the percentage of subscribers of fixed and mobile phone service in the population as a proxy for physical infrastructure and liquid liabilities (M3/GDP) as a proxy of financial development. The results can be influenced by the choice of these variables. As a robustness check, we estimate the system of equations with electric consumption per capita to reflect physical infrastructure and credit to private sector (in percentage of the GDP) as the financial development variable. The results are robust to the use of these alternative variables (table 2.4).
Table 2.4: Robustness checks (3SLS)
Dependent Variables
Explanatory
Variables FDI Portfolio I. FDI Portfolio I.
Electricity 0.002 -0.000 (3.86)*** (1.60) Credit 0.098 1.644 (0.08) (2.58)*** Telephone 0.036 -0.007 (2.80)*** (0.98) M3/GDP -0.014 0.016 (0.93) (2.04)** Control -1.027 -0.259 -0.989 -0.096 (2.39)** (1.10) (2.38)** (0.45) Growth 0.138 0.062 0.088 0.048 (3.45)*** (2.72)*** (2.38)** (2.46)** Inflation -0.001 0.000 -0.002 0.000 (3.20)*** (2.04)** (3.67)*** (1.85)* Openness -0.160 -0.546 1.169 -0.518 (0.20) (1.25) (1.47) (1.26) Education 0.002 -0.001 -0.004 0.001 (0.17) (0.10) (0.45) (0.25) Property -0.052 0.028 -0.014 0.010 (0.66) (0.64) (0.18) (0.25) Natural resource -0.093 0.019 -0.083 0.016 (0.80) (0.30) (1.00) (0.36) Crisis -0.121 -0.127 (1.28) (1.54) Change -0.336 0.048 (1.09) (0.30) R2 0.77 0.23 0.88 0.19 Sargan Stat. 5.40 6.02 0.24 0.33 (p-value) 0.98 0.98 0.37 0.44 Observations 197 197 239 239 Countries 45 45 58 58 z statistics in parentheses.
All regressions include time and country fixed effects. * significant at 10%; ** significant at 5%; *** significant at 1%
Since portfolio investments are short-term flows, high variability in exchange rates could cause uncertainty in the return on these investments. Exchange rate variability may also negatively affect long-term flows such as FDI by increasing uncertainty in returns. Considering the exchange rate variability variable, the main results remain robust (table 2.4).
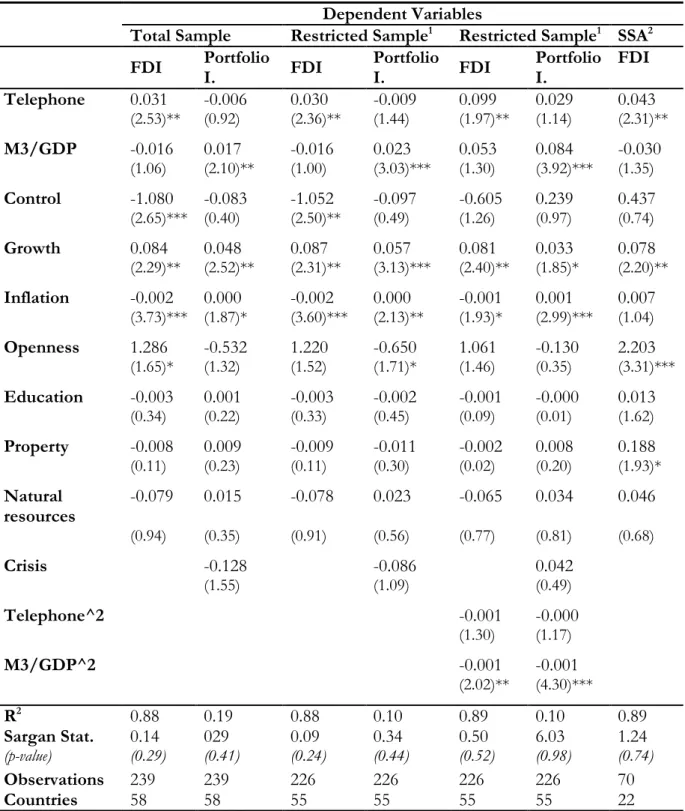
5.4.2. Non-linear relationship
Up to this point, we have only tested linear relations whereas the physical infrastructure may have a congestion effect. Even if the number of subscribers to telephone service or electric consumption per capita has a positive effect on capital inflows, it would be possible that this positive effect vanishes above a certain level of telephone subscribers. For a given level of income, excessive number of telephone subscribers could illustrate high telecommunication cost that forces subscribers to hold one mobile phone for each of the main mobile companies operating in the country. This phenomenon could be observed in African countries such as Côte d’Ivoire or Nigeria. The interaction between infrastructure and other limited factors such as the stock of human capital could also explain the congestion effect. An increase in credit or liquid liabilities can be a signal of a financial development but an excessive supply of money or private credit could also indicate a bad management of the monetary policy or be the precursory sign of a financial crisis. Table 2.5 shows the results considering possible thresholds for the impact of infrastructure and financial development18.
18 The Ramsey-Reset test confirms the non-linearity suspected for the variables of physical and financial infrastructure.