HAL Id: tel-00998381
https://tel.archives-ouvertes.fr/tel-00998381 Submitted on 2 Jun 2014
HAL is a multi-disciplinary open access archive for the deposit and dissemination of sci-entific research documents, whether they are pub-lished or not. The documents may come from teaching and research institutions in France or abroad, or from public or private research centers.
L’archive ouverte pluridisciplinaire HAL, est destinée au dépôt et à la diffusion de documents scientifiques de niveau recherche, publiés ou non, émanant des établissements d’enseignement et de recherche français ou étrangers, des laboratoires publics ou privés.
Plasmas dans l’eau et aux interfaces
Ilya Marinov
To cite this version:
Ilya Marinov. Plasmas dans l’eau et aux interfaces. Autre [condmat.other]. Université Paris Sud -Paris XI, 2013. Français. �NNT : 2013PA112291�. �tel-00998381�
UNIVERSITE PARIS-SUD
ÉCOLE DOCTORALE : Ondes et Matière
Laboratoire de Physique des Plasmas DISCIPLINE Physique
THÈSE DE DOCTORAT
soutenue le 02/12/2013
par
Ilya MARINOV
Plasmas dans l’eau et aux interfaces
D ir ecte ur de th èse : Antoine ROUSSEAU Directeur de Recherche (CNRS-LPP)
Co -d ir ectr ice de thèse : Svetlana Starikovskaia Directeur de Recherche (CNRS-LPP)
Co mpo sition du jury :
Président du jury : Catherine KRAFFT Professeur (Paris Sud)
Rapporteurs : Jean-Michel POUVESLE Directeur de Recherche (CNRS-GREMI) Peter BRUGGEMAN Professeur Associé (University of Minnesota)
Examinateurs : Corinne DUPUY Directeur de Recherche (CNRS-IGR) Thierry BELMONTE Directeur de Recherche (CNRS-IJL)
iii
ACKNOWLEDGEMENTS
This work would not have been possible without the contribution, guidance and support of dozens of people.
First and foremost I wish to thank my research advisor Dr. Antoine Rousseau for giving me the opportunity to do my PhD work on this fascinating subject. I am grateful to Antoine for his motivation, encouragement, patience and continuous scientific and emotional support.
I would like to express my deepest and sincere gratitude to my co-advisor Dr. Svetlana Starikovskaia who was guiding me during the three years of my PhD. I’m indebted to Svetlana for her great research experience and academic skills that allowed me to learn a lot and overcome the difficulties. The confidence Svetlana accorded to me during my PhD and, particularly, during the hard time of writing of this thesis is invaluable.
I gratefully acknowledge my thesis referees, Dr. Jean-Michel Pouvesle and Dr. Peter Bruggeman, and examiners Prof. Catherine Krafft, Dr. Corinne Dupuy and Dr. Thierry Belmonte for interesting discussions, their instructive criticism and explicit comments that allowed me to improve my work.
I am most grateful to Dr. Corinne Dupuy who afforded me with a chance to work in her team, for her valuable suggestions and personal attention. I am also thankful to Aurore Simon-Carré and Amélie Boichard for their help which is difficult to overestimate.
I gratefully acknowledge Dr. Anne Janin and Dr. Arnaud Duval for their expertise and implication.
I am sincerely thankful to Dr. Andrei Starikovskii and Dr. Mikhail Shneider for my unforgettable stay in Princeton University and fruitful discussions.
I wish to thank Dr. Leonid Arantchouk for his immense knowledge and everything I learned from him.
I thank everyone from Cold Plasma team, all PhD and undergraduate students for enriching discussions and memorable time we spent together in the lab and during the conferences. I wish to thank my entire laboratory, all research, technical and administrative staff for their everyday help and support.
I would like to thank my lovely family, my parents for their heart-warming care, my sister for her encouragement and my brother without whom I would have never finished this work.
iv
CONTENTS
1 INTRODUCTION ... 1
1.1 CONTEXT OF THE THESIS ... 1
1.2 ORGANIZATION OF THE WORK ... 3
1.3 ORGANIZATION OF THE THESIS ... 4
2 ELECTRICAL DISCHARGES IN LIQUID DIELECTRICS ... 7
2.1 STATE OF THE ART ... 7
2.2 MECHANISMS OF DISCHARGE INITIATION ... 8
2.3 DISCHARGE INITIATION IN GASEOUS BUBBLES ... 11
2.4 BUBBLE FORMATION IN LIQUID PRIOR TO DISCHARGE IGNITION ... 15
2.4.1 Existence of stable micro bubbles formed from dissolved gas... 15
2.4.2 Gaseous traps on the electrode surface ... 17
2.4.3 Bubble nucleation by ionization/emission currents... 18
2.4.4 Proton hopping (Grotthuss mechanism) ... 19
2.4.5 Auger process ... 19
2.4.6 Lippmann effect ... 20
2.4.7 Bubble cavitation induced by electrostrictive force ... 21
2.5 MECHANISMS OF DISCHARGE PROPAGATION... 23
2.5.1 Lipmann effect... 23
2.5.2 Negative discharge modes ... 24
2.5.3 Slow positive discharge ... 25
2.5.4 Fast positive discharge ... 25
2.6 PROPERTIES OF MATTER IN THE DISCHARGE CHANNEL... 26
2.6.1 From metastable liquid to gas at high pressures ... 26
2.6.2 Plasma parameters (ne,Te) ... 26
3 EXPERIMENTAL SETUP ... 31
3.1 NANOSECOND DISCHARGE IN LIQUID DIELECTRICS ... 31
3.2 ELECTRODE CONFIGURATION ... 32
3.3 PRODUCTION OF PIN ELECTRODES ... 33
3.4 DISCHARGE DEVICE ... 34
3.5 ELECTRICAL DIAGNOSTICS OF HV NANOSECOND PULSES ... 35
3.6 SHADOWGRAPH VISUALIZATION ... 40
v
3.8 CALIBRATION OF TIME DELAYS OF VISUALIZATION SCHEME ... 44
3.9 OPTICAL EMISSION SPECTROSCOPY ... 47
3.10 DIELECTRIC LIQUIDS ... 48
3.11 DBD FOR BIOMEDICAL APPLICATIONS ... 49
3.11.1 Discharge characterization ... 51
4 INITIATION AND DEVELOPMENT OF NANOSECOND DISCHARGE IN LIQUIDS ... 53
4.1 INITIATION OF NANOSECOND ELECTRICAL DISCHARGE IN WATER, ETHANOL AND N-PENTANE. ... 53
4.1.1 Three scenario under nanosecond positive HV pulse ... 54
4.1.2 Initiation of fast and slow modes in deionized water ... 56
4.1.3 Dynamics of cavitation mode. Formation of gaseous cavity in the vicinity of pin electrode under prebreakdown voltage. ... 63
4.1.4 Effect of dielectric permittivity on the discharge ignition. ... 65
4.1.4.1 Discharge initiation in ethanol ...66
4.1.4.2 Discharge initiation in n-pentane ...69
4.1.5 Initiation mechanisms of three modes ... 72
4.1.5.1 Mechanism of bubble formation ...72
4.1.5.2 Electrostriction induced cavitation ...74
4.1.5.3 Mechanical crack ...76
4.1.5.4 Initiation of slow ‘bush-like’ mode ...77
4.1.5.5 Initiation of ‘tree-like’ mode ...78
4.1.6 Conclusion on initiation of three modes ... 79
4.2 PROPAGATION OF BUSH-LIKE AND TREE-LIKE MODES ... 80
4.2.1 The effect of applied voltage on development of bush-like and tree-like modes in deionized water ... 80
4.2.2 The effect of voltage amplitude on discharge development in ethanol and n-pentane ... 83
4.2.3 Propagation of bush-like discharge in deionized water and ethanol ... 85
4.2.3.1 Conclusions on propagation of the bush-like mode...92
4.2.4 Propagation of tree-like mode ... 92
4.2.4.1 Tree-like discharge development in deionized water ...92
4.2.4.2 Tree-like discharge development in ethanol ... 101
vi
4.2.5 Conclusions on propagation dynamics of bush-like and
tree-like modes ... 104
4.3 PRESSURE EVOLUTION IN THE DISCHARGE CHANNEL ... 105
4.3.1 Shock wave velocity measurements ... 106
4.3.2 Expansion dynamics of the discharge channel ... 106
4.3.3 Pressure evolution in discharge channel at low applied voltage ... 107
4.3.4 Discharge pressure measurements at high voltage amplitude ... 110
4.3.5 Conclusions on discharge pressure measurements... 111
4.4 DISCHARGE DEVELOPMENT UNDER SUCCESSIVE HV PULSES ... 112
4.4.1 Discharge development under the second (negative) pulse ... 113
4.4.2 Discharge development under third (positive) pulse... 116
4.4.3 Conclusion on discharge development under successive HV pulses ... 118
4.5 SPECTROSCOPIC ANALYSIS OF THE FAST MODE (PRELIMINARY RESULTS) ... 118
4.5.1 Principle of measurements ... 118
4.5.2 Van der Waals broadening... 119
4.5.3 Stark broadening ... 121
4.5.4 Continuum emission ... 122
4.5.5 Experimental spectra and discussion ... 124
4.5.6 Conclusions on spectroscopic analysis of tree-like discharge 130 4.6 CONCLUSIONS ON INITIATION AND PROPAGATION OF NANOSECOND DISCHARGE IN LIQUIDS... 132
5 BIOMEDICAL APPLICATIONS OF COLD ATMOSPHERIC PLASMA ... 137
5.1 HISTORICAL OVERVIEW ... 137
5.2 APPLICATIONS OF COLD PLASMAS IN BIOLOGY AND MEDICINE ... 138
5.2.1 Plasma in dentistry ... 138
5.2.2 Plasma in dermatology ... 138
5.2.3 Plasma in cancer treatment ... 140
5.2.4 Plasma sources for bio-medicine ... 142
5.2.5 Directly generated plasma sources ... 142
5.2.6 Remote plasma sources ... 143
5.2.7 Plasma in liquid media... 144
vii
5.3.1 Cell membrane structure and transport ... 144
5.3.2 Cytosol, extra and intracellular medium ... 147
5.3.3 Cell cycle and death ... 149
5.3.4 Culturing of mammalian cells in vitro ... 150
5.4 APOPTOSIS INDUCED BY COLD ATMOSPHERIC PLASMA... 151
5.4.1 The role of ROS ... 153
5.4.2 The role of pulsed electric field ... 155
6 MATERIALS, METHODS AND PROTOCOLS ... 157
6.1 HAEMOCYTEMETER.TRYPAN BLUE ... 157
6.2 FLOWCYTOMETRY.ANNEXINE V(AV) AND PROPIDIUM IODIDE (PI) ASSAY . 157 6.3 WST-1 COLORIMETRIC PROLIFERATION ASSAY ... 168
6.4 AMPLEX RED EXTRACELLULAR HYDROGEN PEROXIDE (H2O2) FLUORESCENT PROBE ... 168
7 RESULTS ON PLASMA TREATMENT OF LIVING CELLS ... 171
7.1 DBD PARAMETERS ... 171
7.1.1 Absorbed energy measurements... 171
7.1.2 iCCD imaging ... 172
7.1.3 Temperature measurements ... 173
7.1.4 Electric field measurements ... 175
7.1.5 pH change in culture medium under plasma treatment ... 176
7.2 CELL DEATH INDUCED BY NANOSECOND DBD PLASMA (IN COLLABORATION WITH L’HOPITAL ST LOUIS GROUP) ... 177
7.2.1 In-vitro treatment of Jurkat and HMEC cells ... 177
7.2.1.1 Materials, methods and treatment protocol ... 177
7.2.1.2 Results on in-vitro plasma treatment ... 179
7.2.1.3 Conclusions on in-vitro plasma treatment of HMEC and Jurkat cells 181 7.2.2 Nude mouse skin treatment ... 181
7.2.2.1 Protocol ... 181
7.2.2.2 Results on nude mice treatment ... 182
7.2.2.3 Conclusions on plasma treatment of nude mice skin ... 184
7.3 MECHANISMS OF DBD PLASMA ACTION ... 185
7.3.1 Dosage of hydrogen peroxide in culture medium ... 187
7.3.1.1 Conclusions on H2O2 dosage ... 193
viii
7.3.2.1 Conclusions on plasma treatment of HTori cells... 201
7.3.3 Treatment of melanoma 1205Lu line ... 202
7.3.3.1 Conclusions on plasma treatment of melanoma Lu1205 cells.... 210
7.3.4 Influence of cell seeding protocol ... 210
8 GENERAL CONCLUSIONS AND PERSPECTIVES ... 215
8.1 INITIATION AND DEVELOPMENT OF NANOSECOND DISCHARGE IN LIQUID DIELECTRIC ... 215
8.2 DBD PLASMA INDUCED CELL DEATH MEDIATED BY PRODUCTION OF ROS IN CELL MEDIUM ... 220
8.3 PERSPECTIVES ... 222
9 BIBLIOGRAPHY ... 225
10 ANNEX ... 241
1
1 Introduction
1.1 Context of the thesis
n this thesis two main subjects have been investigated i) physics of initiation of electrical discharge in liquid medium and ii) application of cold atmospheric air plasma for treatment of living cells.
Plasma in liquids
Historically the early research on electrical breakdown of liquids followed two distinct purposes: the prevention of sparking in liquid isolators and production of thermal plasma for underwater welding and generation of strong shock waves. Experimental studies were mainly focused on formation of conductive channel in the discharge gap filled with liquid, while the initiation and prebreakdown phenomena were almost inaccessible with the experimental facilities of that time (Naugolnykh and Roy 1974). Later, electrical discharges in water were considered as a efficient source of active radical and non radical species, i.e. H2O2, OH,1O
2, O3 etc., for waste water treatment and removal of
organic contaminants (Malik et al 2001).
Nowadays discharges in liquids are seen far beyond the traditional interest associated with environmental applications for water treatment and electrical insulation. The discharges in liquids are extensively studied for chemical, biotechnology and medical applications. The number of new applications increases gradually ranging from chemical synthesis (Hamdan et al 2013), refining of oils (Geiger and Staack 2012) and medical use for ablation of tissues (Stalder and Woloszko 2007). However the physics underlying the complex phenomena of electric discharge formation is not fully understood. It is reported on extreme conditions in underwater discharge channels including elevated pressures, temperature and electron densities (An et al 2007) which makes them related with some astrophysical objects, like chromospheres
2
of cold stars (Cram and Mullan 1985). Let us note a creation of European working group for plasma in liquids, that is probably the best illustration of the continuous interest in this field.
Biomedical applications of plasma
The first attempt to use the therapeutic properties of electrical discharges in the ambient air has been done already in the end of 19th century using a self-induction coil transformer (Tesla coil) under the name of ‘Violet Ray’ (Weltmann et al 2012), however it is only in 1970s that the first patent for plasma based sterilization has been issued (Menashi 1968). Later on the first plasma coagulator has been introduced (Morrison 1977). It is not earlier than 2003 that the pioneering work on plasma treatment of living eukaryote cells has been done by Stoffels and coworkers (Stoffels et al 2003). Since that time numerous beneficial applications have been proposed and first encouraging results are now being reported. Among the most notable examples of plasma use in bio-medicine are dentistry (Yu et al 2012), dermatology (Heinlin et al 2011), plasma assisted hemostasis (Fridman et al 2008) and oncology (Kim et al 2011).
Over the last ten years application of cold plasma for biomedical purposes has developed from a subdivision of the traditional plasma chemistry into an independent multidisciplinary field. The best example of fast growing interest in plasma-medicine is the exponential increase in number of participants of a specialized biennial International conference on plasma medicine (ICPM) that has been held for already 4 times since its first issue in 2007. The most important international conferences on plasma physics have now sections and workshops entirely devoted to plasma biomedical applications. New laboratories and even entire institutions have been created over last several years in which specialists in plasma science and electrical engineers work together with biologists and medical doctors. In France since 2010 a GDR ABioPlas consolidates the efforts of numerous groups working in vast field of biomedical applications of plasmas.
3
1.2 Organization of the work
Study of nanosecond discharge in liquids in LPP
The first part of this thesis considers formation and properties of gaseous discharge channels produced in liquid dielectrics under HV pulse. This subject has been brought in the Laboratory of Plasma Physics (LPP) with a PhD Thesis of Paul Ceccato under supervision of Dr Antoine Rousseau. Paul performed a detailed parametric study of discharge dynamics in water under positive and negative microsecond pulses (Ceccato et al 2009). He has also considered the questions related to discharge initiation, however due to slowly rising voltage and difficulty of synchronization the first nanoseconds of discharge propagation were inaccessible. At the beginning of my thesis, we have developed a discharge device that enables investigation of nanosecond discharges in liquid with synchronization within 1 ns.
Biomedical applications of cold atmospheric plasma
The research on biomedical applications of plasmas has not existed in LPP before present thesis. Two collaborations have been created with group working on cancer pathophysiology (Hopital St Louis, Inserm UMR-S 728) and group studying the role of reactive oxygen species (ROS) in radiocancerogenesis (IGR, UMR 8200).
First, nanosecond dielectric barrier discharge (DBD) suitable for in-vitro and in-vivo applications was designed, fabricated and characterized.
The first tests on treatment of living cells were conducted with St Louis group under direction of Prof. Anne Janin and Dr Arnaud Duval. Tests have been carried out in vitro on two cell lines (HMEC, Jurkat) and in vivo on nude mice. Influence of plasma was characterized by induction of cell death in the colonies or in the tissues.
The second collaboration was devoted to the study of the mechanisms, namely the role of ROS in plasma action. The work was done under
4
supervision and with great help of Dr Corinne Dupuy and Dr Aurore Carré. Systematic measurements of plasma produced ROS in the culture medium have been done together with control of cell viability on the normal (HTori) and cancer (1205Lu) cell lines.
Treatment and handling of living cells and mice were undertaken in necessary conditions and in full compliance with rules of safety and ethics.
1.3 Organization of the thesis
This thesis consists of two separate parts considering i) initiation and dynamics of nanosecond discharge in liquids (Chapter 2-4) and ii) mechanisms of cells response to in-vitro and in-vivo plasma treatment (Chapter 5-7).
Chapter 2 gives a present state of knowledge on mechanisms of discharge initiation, describing the dynamics and properties of matter in the discharge channel.
Chapter 3 describes the experimental approach applied for the shadowgraphic and spectroscopic study of nanosecond discharge in liquid. The principle and diagnostics of the DBD for biomedical applications is also provided.
Chapter 4 deals with experimental results obtained on nanosecond discharge in water, ethanol and n-pentane. Several mechanisms of discharge initiation depending on applied positive voltage are discussed. Comparison with existing theoretical models of discharge initiation is provided. Experimental results on shadowgraphic, electrical and spectroscopic diagnostics of the discharge propagation dynamics are reported. Estimates of discharge pressure, temperature and plasma density are provided. Discharge reignition under successive reflected HV pulses is considered.
Chapter 5 provides a review on existing application of cold plasma in biology and medicine with focus on treatment of mammalian cells. The
5
basic notions of cellular and molecular biology, i.e. organization of a cell, existence of chemical gradients across the cell membrane, cell cycle and death are discussed.
Chapter 6 gives information on protocols and methods used for treatment of living cells and further analysis of ROS production and cell viability.
Chapter 7 provides the main results obtained on treatment of endothelial (HMEC) and circulating (Jurkat) cell lines. Analysis of apoptosis/necrosis induction has been done by means of flowcytometry with two markers AnnexinV (AV) and Propidium iodide (PI). Data on penetration depth profile of plasma applied on nude mice skin is provided. Results of quantitative measurement of hydrogen peroxide production in culture medium exposed to plasma are discussed. Analysis of normal thyroid (HTori) and cancerous melanoma (1205Lu) cells viability as a function of H2O2 concentration is given.
7
2 Electrical discharges in liquid dielectrics
2.1 State of the art
he appearance of fast optical converter cameras and bright flash light sources together with development of fast broad band oscilloscopes made possible the visualization of prebreakdown structures in liquids and study of their dynamics (Farazmand 1961). Using shadowgraphic or schlieren visualization bushy or filamentary low density structures were found to propagate with sub or supersonic velocity depending and nature of liquid, voltage rate, amplitude and polarity and electrode configuration. As a rule, asymmetric electrodes, e.g. point-to-plane or point-to-wire configurations were used to study the effect of voltage polarity. Thus, for pure hydrocarbons and liquefied noble gases it was found that lower voltage amplitude is required for discharge formation on the negatively polarized point electrode comparing to anode initiated discharge.
The breakdown of dielectric fluid can be divided in 4 stages: initiation, propagation of discharge structures, bridging of discharge gap and postdischarge evolution. Historically, the early work focused on the high-current breakdown phase, which was registered by the drop in voltage on the high-voltage electrode and a strong light emission. The dielectric strength has been characterized by the delay time of breakdown with respect to the instant of HV application to the electrodes. Postdischarge evolution of the discharge structures has been studied in order to calculate the pressure at the time of the breakdown. It was done for acousto-mechanical applications, as well as to study the recovery of the dielectric properties in spark gaps with liquid dielectric. In a special case of underwater welding, gas bubbles formed by the decomposition of liquid were trapped in the discharge region by a special dome. It was found that the discharge developing in the gas bubbles gives a weld of a better quality.
8
As it was shown for water (Gavrilov et al 1994) and several nonpolar dielectrics (McKenny and McGrath 1984), pulsed positive discharge occurs in two distinct forms, depending on applied voltage and tip diameter, i.e. nonunifomity of the field. At lower voltages the discharge ignites in a hemispherical or bushy form propagating with subsonic or supersonic velocity depending on nature of dielectric liquid. For higher voltages and very sharp tips, the discharge ignites in a filamentary streamer-like mode, also called tree-like discharge. For microsecond HV pulses, as a rule, positive discharge first ignites in a bush-like form and then transition to filamentary mode occurs at the time scale of 1 µs. The fast filamentary discharge is always supersonic with propagation velocity in the region between 10 and 100 km/s. It is stated that different physical phenomena are responsible for the propagation of bush-like and tree-like modes, however until recently very few was known about initiation phase of these two modes.
2.2 Mechanisms of discharge initiation
By discharge initiation we will understand a formation of conductive phase on the electrode or in its vicinity. The instant of the initiation is strongly dependent on the form of the applied voltage and the electrode configuration. There is some uncertainty in determination of the instant of discharge initiation from transient current and optical registration of primary discharge structures or light emissions. So, for pure liquids under DC voltage it was found that nanosecond current pulses always precede the formation of low density structures on the submicron point cathode (Kattan et al 1989). If the point electrode had a radius of less than 100 nm, the discharge structures were not detected. Discharge produced with nanometer size electrodes in water and water salt solutions (Staack et al 2008) showed that the corona discharge was formed directly in liquid while boiling or liquid dissociation has been avoided. This was confirmed by the emission spectra with low
9
broadened atomic lines of elements of dissolved salts at the absence of atomic lines of hydrogen and oxygen for pulses shorter than 100 ns. For microsecond anode initiated discharge, the conduction current, which depends on the ionic conductivity of the water, precedes the appearance of a bubble, which plays the role of primary phase of the discharge (Ceccato et al 2009). In the case of ultra-short sub-nanosecond pulses and fields exceeding 1010 V/m (Starikovskiy et al 2011), plasma
emission from the discharge was detected already at the leading edge of the HV pulse of 150 ps. It is clear that the experimental study of the mechanisms of discharge initiation requires a simultaneous optical and electrical diagnostic with sub-nanosecond time resolution.
The formation and development of discharge structures precedes the electric breakdown, but in some cases the discharge gap is not bridged, and such a discharge is called partial. Partial discharges are mainly observed for strongly asymmetric electrode configuration as point to plane or wire to plane. In asymmetrical electrode geometries the field decreases hyperbolically with the distance from the electrode and, at a given duration and amplitude of the applied voltage on the electrode, there is a minimal length of the discharge gap, which avoids the breakdown. A spark formation can be avoided by using a sufficiently long discharge gaps or by covering one of the electrodes with a dielectric. It is done in order to reduce the erosion of the point electrodes and to avoid the eventual damage of electrical and optical equipment. Partial discharges are also most commonly used for environmental (Malik et al 2001) and medical (Stalder and Woloszko 2007) applications, as more energy- efficient for production of reactive oxygen species (ROS), or when substantial water heating must be avoided. Discharge structures consist of conducting channels or gaseous cavities propagating in liquid. Discharge structures are characterized by their shape and propagation velocity. Among the most important parameters determining the form of the discharge structure are polarity of the electrode, the field distribution in the electrode gap, properties of the fluid, the presence of impurities and dissolved gas, hydrostatic pressure and temperature.
10
Figure 2.1 Initiation of slow (bush-like) and fast (tree-like) discharge in n-pentane as a function of applied voltage and tip radius. Taken from (Lesaint and Gournay
1994a).
For point electrode of positive polarity structures of two types, namely bush-like and tree-like modes have been observed in various liquid hydrocarbons by applying a high voltage pulse with rising slope of 10 ns. It was found that, for each value of the tip radius, there was a minimum threshold voltage when the filamentary discharge can only be detected (Figure 2.1). Impurities with low ionization potential were found to diminish the threshold voltage, while electron scavengers did not show any influence. For pulses with a longer rising slope, the discharge was initiated first as a bush-like, and then transformed into tree-like discharge. A similar situation was observed in water under microsecond pulses with a rise time of 20 ns (Ceccato et al 2009). Thus, the discharge structure of the first type was formed and then it turned, in a few hundred of nanoseconds, into a filamentary discharge of the second type. It is worth noting, that both discharge structures were filamentary: the first discharge mode demonstrated a fan-like structure with numerous channels of equal length and the second mode was a tree-like structure showing strong branching of channels. If the rising
11
front of voltage pulse was about 10 ns, the direct formation of the second type structure was detected (Ushakov et al 2007).
The discharge of negative polarity demonstrated a similar bush-like pattern with a rough boundary in number of liquids. For submicron pin electrodes the negative discharge was formed in the form of bubble or series of bubbles. In the case of ultra-high electric fields filamentary negative discharge has been observed. An exhaustive classification of discharge structures depending on polarity and nature of liquid was done in (Beroual et al 1998).
2.3 Discharge initiation in gaseous bubbles
One of widely accepted models of discharge initiation is based on assumption of a gas discharge in cavity or bubble, formed in the high field region in liquid. The bubble can occur naturally from dissolved gas or under the effect of applied electric field. Another argument for the bubble-based mechanism of discharge initiation is also supported by the damage of very sharp pin electrodes observed in inert liquids at prebreakdown fields when only emission/ionization current occurs. It is suggested that sputtering due to the bombardment by ions, accelerated inside the bubble, and cavitation process itself can be an important issue leading to tip erosion (Halpern and Gomer 1969). The possible mechanisms of bubble formation and their role in the discharge initiation will be discussed below.
For micron size bubble filled with air at atmospheric pressure and placed in the electric field of 107 V/m, the time delay to partial
discharge formation inside the bubble is of the order of nanosecond or less (Ushakov et al 2007). The current, necessary to sustain the avalanche, can be as low as 10-10 A. As one can see, the direct
observation of partial discharge in the bubble is a technically demanding task and a number of works were searching for indirect evidence of bubble mechanism. For example, it was shown that
12
degassing, hydrostatic pressure and viscosity of liquid increase the time lag to discharge initiation (Ushakov et al 2007).
Once the avalanche occurs inside the bubble, the electric field decreases due to the charge deposition on the interface between the bubble and the liquid (Gournay and Lesaint 1993). Consequently, voltage across the bubble drops below Paschen minimum and discharge extinguishes. The time necessary to remove adsorbed charges is determined by diffusion of charges through the bulk liquid and by the solvation rate. It is assumed that charges, adsorbed on the bubble wall, are predominately ions, while electrons can penetrate deeper in the liquid where they are rapidly solvated over ~ 1 ps, in the case of water. Successive discharge occurs when the voltage across the bubble recovers to the breakdown value. The total number of partial discharges in the bubble is determined by the duration of the applied field and the rate of diffusion of the charges in the fluid. After each successive breakdown, the bubble size increases due to release of Joule energy as well as the action of the Coulomb and electrostrictive forces.
If we assume that the relaxation time of the surface charge is higher than the formation of the breakdown, the bubble can be approximated by a dielectric sphere with a charged surface. Then, in the field close to a uniform, Coulomb force acting on the bubble surface may be presented in the form of additional pressure (Ushakov et al 2007):
∆
≈
( )( ) (2.1)
Coulomb forces act in the direction of electric field, inducing bubble deformation into prolate spheroid. The deformed bubble is normally not symmetrical and has higher curvature on the side closer to the cathode under uniform field conditions (Beroual 1992). Image forces and redistribution of the surface charges in the external field are thought to be the reason for bubble asymmetry. Field strengthening at the tip, formed in the process of bubble elongation, can provide the electric field amplitude exceeding the breakdown threshold. It was demonstrated (Garton and Krasucki 1964), that if the ratio of dielectric permittivity
13
of the bubble and that of liquid / ≥ 20
,
which is valid mainly for conducting bubbles or drops of highly polar liquids, there is a critical value of bubble elongation. Therefore, if the ratio of major and minor axis of elongated conducting bubble exceeds 1.85, the bubble becomes instable and elongates until the bridging of the gap occurs or bubble disruption at the sharp extremities. Figure 2.2 shows the instability development during elongation of water droplet in silicon oil leading to breakdown. It is suggested that even for bubble as small as 100 nm in diameter, the instability can occur under the field of 108 V/m. Forcharged nanobubble in low viscous liquid, the instability can develop on the nanosecond time scale.
Figure 2.2 Breakdown in silicon oil due to instability development of water droplet under AC electric field of 1 MV/m. Taken from (Garton and Krasucki 1964). As it was shown by Korobeinikov with coworkers (Korobeinikov et al 2002), bubbles of 40 – 100 µm, artificially produced on the electrode surface, can play a role of initiation site for positive and negative discharge in water. It was found that at maximal field amplitude of 8·107 V/m with rising time of 0.2 µs both cathode and anode bubbles
elongated in the direction of the electric field. Anode bubbles were found to contract along transverse axis, and the total time of deformations was of the order of 500 ns after application of high voltage pulse. Then, bubble isotropically increased in size and supersonic streamers forming a fan-shaped structure emerged from the most remote point on bubble surface at about 1 µs (Figure 2.3, a). Ignition of positive streamers was accompanied by emission of spherical shock waves with the origin at the surface of initial bubble. Negative discharge developed from the extremity of deformed bubble in a
bush-14
like form with subsonic velocity below 400 m/s (Figure 2.3, b). For cathode bubbles the ionization processes manifested already 0.25 µs after application of voltage pulse as could be seen from bubble elongation with simultaneous increase of its transverse diameter (Figure 2.3, b).
Figure 2.3 Initiation of a) positive and b) negative discharge with the aid of artificially produced bubbles. Time is given in microseconds and corresponds to delay with respect to application of HV pulse. Modified from (Korobeinikov et al
2002).
In order to explain the polarity effect, the authors assumed that for cathode bubbles the electron injection can produce avalanches in the bubble at the field below the peak amplitude over the rising slope of voltage pulse. The charges, being adsorbed on the bubble surface, experience the action of Coulomb force resulting in bubble expansion. The field inside the bubble is attenuated by the surface charges which prevent avalanche development and breakdown. The pressure inside the cathode structure is believed to be close to atmospheric pressure. As for anode bubbles, electron detachment from negative ions is seen as the main source of seeding electrons. However the density of negative ions adsorbed from the bulk liquid on the bubble surface is rather low and bubble elongates due to the dielectrophoretic force till the field strengthening inside the bubble would allow avalanche to streamer transition. In the case when no bubbles were produced beforehand on the electrode, the delay of breakdown of anode initiated discharge increased by several microseconds, whereas discharge structures
15
demonstrated the similar patterns. The propagation dynamics of positive and negative discharges will be discussed in details in the following section.
In cyclohexane electron injection from the cathode was suggested to explain initiation of the negative discharge, supported by Trichel-like current signal (Kattan et al 1989). The initiation of negative discharge is characterized by a very steep dependence on applied voltage with well defined threshold value of voltage amplitude. The initiation current of negative discharge was found to be insensitive on hydrostatic pressure up to 10 MPa (Dumitrescu et al 2001). It is believed that electrons in sufficiently high electric field are able to gain enough energy for evaporation of a small volume of liquid, leading to electron avalanche in the gaseous phase. Expulsion of the electric field from the conductive cavity acting as electrode extension ensures successive propagation of the discharge. Anode initiated discharge, investigated in the same work, demonstrated smoother dependence of initiation probability on applied voltage. Also inhibition of positive discharge initiation at high pressure and absence of transient current have been observed as opposed to negative discharge.
2.4 Bubble formation in liquid prior to discharge ignition
2.4.1 Existence of stable micro bubbles formed from dissolved gas
All liquids exposed to atmospheric conditions contain dissolved gases whereas solubility of each component mainly depends on nature of liquid, alkaline admixtures and temperature. The existence of stable nanometre scale bubbles, also called bubstons, was predicted theoretically (Bunkin and Bunkin 1992) and was demonstrated experimentally for the case of non-degassed water (Vallee et al 2005, Bunkin et al 2009). Authors suggested, to explain the bubble stabilization, a selective adsorption of the same sign ions in non-degassed water. It was shown that bubstons can be found even at very low ionic concentration of 1015 cm-3. It is stated that autodissociation of
16
ionic concentration in deionized water (Vallee et al 2005). The charging of bubble surface by ion adsorption allows equilibrating of the pressure due to the surface tension by the negative electrostatic pressure of Coulomb repulsion:
=
2. 2
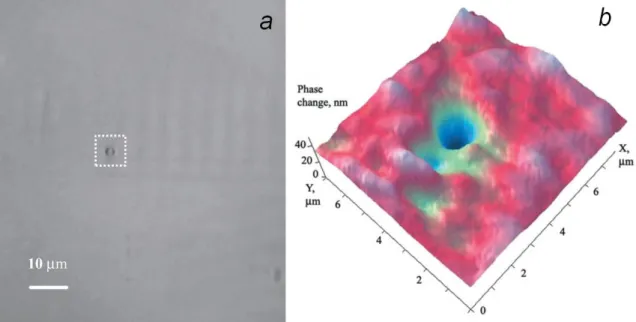
Consequently, the pressure inside the charge bubble is of the order of hydrostatic pressure in liquid. Bubstons are stable and can withstand even double distillation of water. Spontaneous coagulation of bubstons leads to formation of 1 – 1.5 µm size clusters at the density of about 106 cm-3 as detected by optical and interference microscopy (Figure 2.4,
a-b). The number of bubston clusters was found to increase with ionic concentration and basic pH.
Figure 2.4 a) Micrograph demonstrating spontaneous formation of a micrometer scale particle in double distilled and filtered non deionized water. b) Interferogram
corresponding to the zone highlighted on the optical image demonstrating optical density distribution. Taken from (Bunkin et al 2009).
Under conditions of nanosecond laser breakdown in water clusters of mechanically stabilized bubbles can play a role of seed centers of breakdown initiation (Bunkin and Bakum 2006). It is suggested that
17
electron oscillating in the electric field of laser pulse may inside a 10 – 20 nm bubston may gain enough energy for ionization of water molecules on the bubble surface. The development of electron avalanche induces evaporation of interfaces between individual bubstons and formation of microscopic gas bubble.
2.4.2 Gaseous traps on the electrode surface
Generally, even carefully polished electrodes or electrodes produced by electrochemical etching present microscopic and smaller asperities and cavities. Depending on wettability of the electrode surface under study, gaseous bubbles may eventually form at the roughnesses (Figure 2.5). The gas inside the microcavities is typically air at atmospheric pressure that could remain after the electrode was set in contact with ambient air or come from dissolved gas in liquid or electrode material. To give an example, tap water contains about 0.05 cm3/g of dissolved air at
atmospheric pressure and stainless steel contains about 1 mm3/g of air
at normal conditions (Ushakov et al 2007).
Figure 2.5 Formation of gaseous cavities on electrode surface roughnesses. Taken from (Ushakov et al 2007)
18
2.4.3 Bubble nucleation by ionization/emission currents
Electrons produced by emission from the cathode or in the process of autoionization in the anode vicinity can acquire energy in the inter-molecular spacing sufficient to excite vibrational modes of molecules of the liquid. Taking water as an example, the average distance between water molecules is equal to 4·10-10 m and assuming maximal field
strength of 109 V/m, we obtain for the energy gain by an electron the
value of about 0.4 eV (~3200 cm-1) which is comparable with
vibrational energy in a bulk water (3200 – 3500 cm-1, ~1600 cm-1).
Hence, the energy transfer between electrons and vibrational degrees of freedom of water molecules is rather probable under given electric field. Then, the vibrational energy is rapidly converted into heat during collisions between the molecules. Consequently, local heating in highly non-uniform fields due to the emission/ionization current may induce homogeneous nucleation of bubble. Temperature increase in the tip vicinity can be found from the current flux (Halpern and Gomer 1969):
=
⁄
8
( − ),
(2.3)where Ft – field at the tip, rt – tip radius, k – thermal conductivity. The solution for steady-state heat transfer suggests that the maximal temperature increase (ΔTmax) should be at the distance equal to 2rt.The time required to reach ΔTmax can be found byequating the energy input
rate to the temperature rise (Halpern and Gomer 1969):
= 2
⁄
(
2.4)In the superheated liquid the bubble nucleation occurs with the probability defined by a volumetric nucleation frequency:
=
−
( )
,
(
2.5)where N is the number of molecules per unit volume, is the vaporization heat, is the surface tension, m is the mass of molecule of liquid, Pv is the saturated vapor pressure at T, P is the external pressure.
19
2.4.4 Proton hopping (Grotthuss mechanism)
In the case of water it is known that protons have anomalously elevated mobility as compared to other ions. Thus, at the absence of external field proton diffuse almost 7 times faster than Na+. In fact, proton
tunneling through the water molecules occurs via hydrogen bonds. Under the electric field of the order of 109 V/m the hydrogen bonds
along the field axis are considerably strengthened while hydrogen bonds orthogonal to the field become weaker (Vegiri 2004). Therefore, electric current induced by proton hopping can play an important role under the electric fields typical for the discharge formation in water.
2.4.5 Auger process
Auger process is very well known for gases and solids and consists in nonradioactive energy transfer and electron emission by producing a vacancy in the atomic inner shell or valence band. It was proposed for liquids by Lewis (Lewis 2003) in order to explain production of seed charges required for avalanche ignition at both cathode and anode. For biased electrode being cathode the proposed scenario is following. Under strong electric field in the double layer free positive ions reach the cathode surface. Positive ions attached to the cathode have the energy level below Fermi energy of metal electrode. Resonance tunneling can occur between valence band and positive ion acting as a hole (Figure 2.6, a). Energy released in electronic transition from about Fermi level to vacancy is nonradiatively transferred to another electron. Hot electron with energy above Fermi level is injected to the liquid.
In the case of positively polarized electrode, electrons from negative ions and electrons with energy level above Fermi energy can tunnel to the conduction band (Figure 2.6, b). Relaxation of the electron to Fermi lever liberates energy enough to excite another electron from valence band. Finally a hole is formed in liquid by tunneling of electron to the vacancy.
20
Figure 2.6 a) Generation of Auger electron from the cathode by neutralization of positive ion b) Generation of positive hole in Auger process of neutralization of
negative ion or electron. Taken from (Lewis 2003) 2.4.6 Lippmann effect
An ion naturally present in liquid can form a chemical bond with electrode surface due to the difference between Fermi level and energy level in ion. Polar molecules can also be adsorbed on the metal surface by image force. Thus, the interface between liquid and metal consists of double charged layer of opposite sign, also called electric double layer. As a rule, in the double layer the substance with higher dielectric permittivity has a positive charge. Consequently, at the electrode/liquid interface liquid would have net negative charge, while for liquid/gas boundary liquid would be charged positively. Double layer consists of dense Helmholtz layer formed by adsorbed ions and molecules and diffuse (Gouy-Chapman) layer extending in the bulk liquid and screening the space charge of double layer.
It is worth noting the importance of electrode polarity on formation of double layer. For biased anode more negative ions are attracted and adsorbed on the electrode surface strengthening the double layer (Figure 2.7, a). On the contrary, for cathode negative ions are repulsed while net positive charge is increased with applied voltage. From mentioned above it directly follows that if a short pulsed voltage is
21
applied to the anode the interfacial tension would decrease until the liquid layer lost the cohesion. For cathode the effect would be opposite at low voltages and after the change of double layer sign the interfacial tension would drop.
Figure 2.7 a)Distribution of potential between cathode and anode for bias increasing from i) U=0 to iv) U=Vb. b) Lost of cohesion by liquid in double layer and cavity
formation under nonuniform electric field. Taken from (Lewis 2003)
Under highly nonuniform electric field at the sharp point electrode the reduction of interfacial tension and loss of cohesion lead to formation of a low density cavity (Figure 2.7, b). The evolution of the cavity is defined by competition between screening of local field by improved ion flux inside the low density region and instability development of charged interface.
2.4.7 Bubble cavitation induced by electrostrictive force
Recently Shneider and coworkers (Shneider et al 2012, Shneider and Pekker 2013b) stated that, at initial stage of the discharge development, for polar liquids in highly nonuniform fields, the pressure gradient due to electrostriction effect can be an important issue in streamer formation mechanism. The force acting on unit volume of
22
dielectric liquid placed in nonuniform electric field is given by Helmholtz equation (Ushakov et al 2007)
⃗ =
⃗ +
+
(
2.6)where the first term corresponds to force acting on free charges, the second term arises in the case of inhomogeneous dielectric and the third term describes the force acting in the nonuniform electric field. For prebreakdown conditions (before discharge ignition) the first two terms can be neglected. Fast reorganization of electrical dipoles in nonuniform field leads to strong electrostriction effect. The size of area R where the rupture of liquid may occur has a typical size of the order of the tip radius and is given by (Shneider et al 2012)
≈
= 7 × 10
⁄ ⁄,
(2.7)where
r
is the radius of the tip, V is the applied voltage and P is the critical pressure corresponding to rupture of liquid and cavitation induction which is about 30 MPa in case of fast stretching of water (Herbert et al 2006). The negative pressure arising from stretching of dielectric in nonuniform electric field by ponderomotive forces can be found using (Shneider and Pekker 2013b)= −0.5
,
(2.8)where is empirical constant relying density variation with change in dielectric constant of polar dielectric
=
. In the case of water equals 1.5 (Ushakov et al 2007).In the discontinuities of liquid, cavitation of dissolved gas can take place while the electrons can accelerate to values exceeding the ionization energy of water (9 eV). Just few recent experimental works (Starikovskiy 2013, Dobrynin et al 2013) considered electrostriction mechanism to be relevant for discharge initiation in dielectric liquids.
23
2.5 Mechanisms of discharge propagation
2.5.1 Lipmann effect
As it was discussed above, the loss of cohesion between liquid and electrode surface under nonuniform electric field may lead to void formation in the double electric layer. It was proposed to extend this mechanism based on Lippmann effect to the bulk liquid (Lewis 1998). At each point the electric field creates a stress E2 acting orthogonally
to the field direction. As a result, the cohesiveness between molecules of liquid decreases along the field lines. It is suggested that sub-microscopic holes can be formed in liquid under the electric fields typical for discharge initiation in dielectric liquid (108 – 109 V/m). The
holes in this case are seen as molecular size voids stochastically appearing in the liquid volume. At some critical holes density, available mechanical energy can satisfy the Griffith criterion inducing crack formation (Figure 2.8a). The time of crack formation is obviously depends on liquid bulk modulus and surface energy that, in the general case, are unknown functions of electric field and can be considerably decreased in the presence of nano-voids. Although, the lack of experimental data on the change in mechanical properties of liquid under electric stress prevents numerical analysis of the problem, the authors estimate that the effect can play a role in discharge propagation on the nanosecond time scale. Note, that the crack propagation is only determined by the field distribution and the generation rate of holes, while formation of the conductive plasma in the crack is not necessary for this model. However, simple estimation shows that energy gain by an electron over crack length of 10-8 m can achieve 10 eV which is
sufficient for impact ionization of liquid molecules. Therefore, avalanche development become possible in the crack. Proposed mechanism depends on E2 and hence should be relevant for both anode and cathode
24
Figure 2.8 a) Generation of sub-micron voids and crack development under E2 stress, Crack guided propagation of b) positive and negative discharge. Taken from
(Lewis 1998).
2.5.2 Negative discharge modes
Slow negative discharges are subsonic and characterized by step-wise propagation, associated with current spikes of several tens of nanoseconds. The average velocity of the discharge varies between tens to hundreds of meter per second. Additives with high electron affinity, like CCl4, were shown to considerably increase up to several times the propagation velocity of the negative discharge (Beroual 1993).
25
Propagation of slow negative discharge could be almost inhibited by hydrostatic pressure of several MPa, in contrast to the initiation phase which, as we have seen above, is insensitive to hydrostatic pressure. It is stated that the negative discharge propagates by hydrodynamic expansion of gaseous cavity, formed by electronic avalanche in liquid. The delay between two successive steps of the discharge propagation is determined by time necessary to remove the negative charge, screening the applied field, from the interface. It explains the role of electron scavengers that are able to increase the average velocity reducing the time interval between consecutive avalanches (Devins et al 1981). Electrohydrodynamic (EHD) instability of the charged interface can explain the bushy morphology of slow negative discharge (Watson and Chadband 1988).
2.5.3 Slow positive discharge
Slow positive discharge in liquid hydrocarbons has similar bushy structure and Trichel–like current waveform with nanosecond current spikes as in slow negative mode (Gournay and Lesaint 1993). Propagation of slow mode is affected by hydrostatic pressure greater than 3 MPa and the discharge is believed to be confined inside gaseous cavity. However, low values of transient currents and hardly detectable emission indicate that the slow structures are weakly conductive. Slow mode is typically sub-sonic in hydrocarbons while supersonic velocities were found in water (An et al 2007). Depending on the duration and the amplitude of applied voltage a transition from slow positive mode to fast filamentary mode can occur (Gavrilov et al 1994). In water the transition from slow to fast mode occurs from one of the channels of primary structure, synchronized with current spike (Ceccato et al 2009). 2.5.4 Fast positive discharge
Fast positive mode consists of the separate channels. Their number and branching vary, depending on liquid and field distribution in the discharge gap (Lesaint and Jung 2000). The fast positive mode is essentially supersonic with the velocity strongly dependent on applied voltage. Propagation velocity does not change with hydrostatic pressure
26
at least up to the values of 7 MPa (Lesaint and Gournay 1994b). However, the discharge length and diameter of the channels are reduced at high hydrostatic pressure. Propagation of fast positive mode is associated with continuous transient current, which is correlated with the number of channels. In the case of water, the light emission and the discharge current increase with ionic conductivity, whereas the propagation velocity does not change (Ceccato et al 2009). However, it was found that in the case of liquid hydrocarbons and mineral oils, the propagation velocity increases with addition of low ionization potential compounds (Devins et al 1981). Propagation of the fast mode in water is step-wise with typical delay of 300 ps between two successive steps (Katsuki et al 2006). Each step of the discharge propagation initiates a spherical shock wave. For long gaps transition to leader mode bridging the gap can occur.
2.6 Properties of matter in the discharge channel
2.6.1 From metastable liquid to gas at high pressures
It is suggested that electron avalanche in liquid may bring it to the superheated metastable state that can occasionally turn in vapor. Pressure measurements inside the discharge channel of the fast mode, using optical interferometry, gives the values as high as 109 Pa (An et
al 2007). Estimations of the energy dissipation inside the discharge channel demonstrate that no substantial heating of liquid inside the channel occurs and, hence, the dissociative mechanism of gas formation at high pressure is assumed. High pressure inside the discharge channel at inception explains insensitivity of fast positive mode to hydrostatic pressure. However, the hydrostatic pressure inhibits the expansion of the channel thus limiting the current and preventing initiation of new sections of the discharge channel.
2.6.2 Plasma parameters (ne,Te)
The main source of information on plasma parameters in liquid is nonintrusive optical emission spectroscopy (OES). OES has been
27
applied to study plasma density and chemical composition inside the discharge channels in a number of liquid dielectric including pure hydrocarbons (Sakamoto and Yamada 1980, Ingebrigtsen et al 2008), mineral oils (Bårmann et al 1997), liquefied gases (Hernandez-Avila et al 1994, Frayssines and Bonifaci 2002) and water (Sunka et al 1999, Nieto-Salazar et al 2005, Namihira and Sakai 2007, Bruggeman et al 2010). Typically emission spectra in visible and near UV region consisted of continuum emission and atomic lines corresponding to the electronically excited levels.
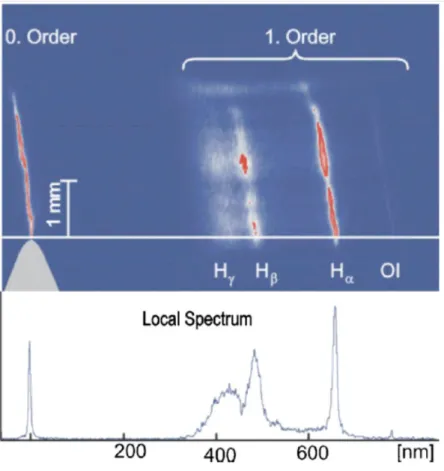
Figure 2.9 Spatially and time resolved OES of tree-like mode in water. Taken from (An et al 2007)
Figure 2.9 shows spatially resolved spectrum, emitted by one branch of tree-like discharge produced in water (An et al 2007). Horizontally dispersed spectral images of emitting filament were observed in the first diffraction order of the grating with a CCD camera. As one can see, the emission spectrum was dominated by Balmer series of atomic hydrogen and weak emission of the atomic oxygen IO line. The authors reported
28
that at the discharge ignition continuum emission was observed at the position of Balmer series. Separate line became apparent only several tens of nanoseconds after ignition. Continuum emission was also observed at the initial stage of discharge propagation in n-heptane before Balmer lines and C2 Swan band became evident (Sakamoto and Yamada 1980). Authors attributed continuum emission to recombination of molecular fragments. In recent study, considering breakdown in water with bubbles, strong continuum emission was observed at the moment of the spark formation. Continuum was ascribed to black-body emission due to the strong Joule heating with typical blackbody temperatures in the range 6000 – 9000 K.
The main species observed from OES in water are atomic hydrogen and oxygen and OH radical. In some cases of saline solutions atomic lines corresponding to the elements constituting dissolved salts are present. For microsecond positive discharge in water it was found that a half width of atomic hydrogen Balmer alpha line was correlated with current signal of the positive discharge (Namihira and Sakai 2007). Emission spectra were registered starting from about 1 µs after discharge ignition over the decay of applied voltage pulse. The authors attributed the broadening to collisional Stark process which directly gives evolution of electronic density inside the discharge channels. It was found that spatially averaged plasma density varied between 1018 – 1019 cm-3 during
the applied voltage pulse. Sputtering of the pin electrode made of Cu produced well defined atomic lines in emission spectra. Boltzmann temperature obtained from the atomic spectra of Cu, assuming thermal equilibrium, was found to be as high as 15000 K, although no spark occurred in this case. Spatially resolved measurements along the fast positive streamer in microsecond discharge in water were done in (An et al 2007). Similarly, only Stark collision broadening was taken into account. It was found that the electron density decreased from 5·1019 to 2·1018 along the channel from tip to the channel origin.
A two component profile of hydrogen alpha line was observed in positive discharge in transformer oil (Bårmann et al 1997) and in
29
discharge initiated in gaseous bubbles in water (Bruggeman et al 2010). In both cases the best fit was obtain as a sum of two Lorentzian profiles which were attributed to Stark broadening in regions with two different plasma densities. The authors proposed a model of the discharge channel with a dense plasma core and a sheath with lower plasma density in which recombination occurs predominantly. It was also shown that assuming Stark effect due to the macroscopic external fields Hα line profile could not reproduced (Bruggeman et al 2010).
In (Ingebrigtsen et al 2008) spectroscopic analysis of positive and negative microsecond pulsed discharge was performed in a series of chlorinated hydrocarbons. Broadening and red wing asymmetry of time averaged atomic chlorine lines was treated in assumption of simultaneous action of Stark and Van der Waals mechanisms. Deduced gas density inside the discharge channels was about 10% of critical density while degree of ionization varied between 0.1 – 1%. Average gas temperature calculated from C2 Swan bands was of the order of 2·103 –
6·103 K.
The attempt to attribute rotational temperature of OH (A-X) band to gas temperature inside the discharge channels was done in several papers (Nieto-Salazar et al 2005, An et al 2007). The authors obtained 3000 – 5000 K from a comparison between experimental and simulated spectrum. However, as it was shown by Bruggeman with colleagues (Bruggeman et al 2009) the rotational temperature of OH band cannot be used as an accurate estimate for the gas temperature, since rotational distribution is influenced by production process, i.e. ‘hot’ OH radicals can be produced in some recombination process. Hence, the gas temperature calculated from OH band rotational structure seems to be overestimated.
Results presented above, demonstrate that the development of electrical discharge in liquid dielectrics is highly transient process, which implies that plasma density can strongly vary from the moment of discharge inception. Moreover, fast propagation on the nanosecond time scale brings into question the existence of local thermodynamic equilibrium,
30
although elevated electron and gas densities should induce strong interaction between the particles. In addition the complex discharge morphology induces spatial gradients of gas and plasma density. As it follows from mentioned above time and spatially resolved measurement are necessary for understanding of underlying physical phenomena.
31
3 Experimental setup
3.1 Nanosecond discharge in liquid dielectrics
he experimental techniques commonly applied for diagnostics of electrical discharges in liquid media are optical shadowgraphy, schlieren visualization, interferometry and broadband electrical measurements. Optical emission spectroscopy (OES) gained an increasing attention over the last years being a nonintrusive tool with a great potential to estimate plasma composition and parameters (ne, Te).
However, the results obtained from the OES can hardly be used without information on discharge morphology and dynamics. As it was discussed in Chapter 2 electrical breakdown of liquid dielectrics occurs via formation of streamer-like structures propagating at velocities from 102 m/s up to 105 m/s depending on nature of liquid, electrode polarity
and voltage rate. If we consider a fast positive streamer with a propagation velocity of 50 km/s, the simple estimate shows that the streamer covers the distance of 1 mm in just 20 ns, while typical streamer diameter is about 10 µm. It means that detailed information on streamer dynamics may be obtained only if nanosecond time resolution and microscopic spatial resolution are available. From the other hand, when microsecond and longer HV pulses are used to ignite the discharge the delay time prior to fast streamer formation may reach one microsecond whereas the jitter exceeds several tens of nanoseconds. Hence, the synchronization of detecting system with the discharge appearance becomes an important issue. One of possible solutions is to trigger the discharge ignition by HV pulses with a rise time of the order of streamer initiation time, i.e. by using nanosecond HV pulses.
Thus, we decided first to perform shadowgraph imaging of pulsed nanosecond discharge in water and several other dielectric liquids in order to characterize the conditions of the discharge initiation and discharge propagation dynamics. Afterwards, time-resolved
T
32
spectroscopic analysis of light emitted by the discharge was done. Figure 3.1 schematically summarizes the experimental approach that was used for time resolved diagnostics of pulsed nanosecond discharge. The setup consisted of generator, producing nanosecond pulses that were applied to the discharge device and electrical and optical diagnostics synchronized in time with HV pulse. Experimental technique was designed to achieve microscopic spatial and nanosecond temporal resolution of shadowgraph visualization synchronized within 1 ns with HV pulse. Below, each part of the experimental setup is discussed in details.
Figure 3.1 Schematic diagram of experimental setup.
3.2 Electrode configuration
Discharge initiation in liquid medium is a stochastic process which may be influenced by the presence of electrode asperities, dust particles or gaseous bubbles. For large spherical electrodes the discharge initiates randomly on the electrode surface and at arbitrary time instants, if low rate pulsed or DC voltage is used. In such non-reproducible conditions the study of discharge ignition and propagation becomes a tricky task. The use of asymmetric point-to-plate or point-to-wire electrode configuration allows producing highly nonuniform electric field at the