Description of a Turbofan Engine Product Development Process by
Douglas C. Hague
Ph.D. Materials Science & Engineering, The Pennsylvania State University, 1995 M.S. Metals Science & Engineering, The Pennsylvania State University, 1992
B.S. Engineering Physics, The University of Tulsa, 1989 Submitted to the System Design & Management Program In Partial Fulfillment of the Requirements for the Degree of
Master of Science in Engineering & Management at the
Massachusetts Institute of Technology February 2001
02001 Douglas C. Hague, All Rights Reserved The author hereby grants to MIT permission to reproduce and to distribute electronic copies of this Pwhis document in whole or in part.
BARKER
FF ,
JTE
publicly paper and
Signature of Author
Douglas C. Hague System Design and Management December 15, 2000 Certified By__
Accepted By
Steven D. Eppinger General Motors LFM Associate Professor of Management Science Thesis Supervisor
"/ FPaul A. Lagace
LFM/SDM Co-Director Professor of Aeronautics & Astronautics and Engineering Systems Accepted By
Stephen C. Graves
LFM/SDM Co-Director Abraham Siegel Professor of Management Science
Description of a Turbofan Engine Product Development Process by
Douglas C. Hague
Submitted to the System Design & Management Program on December 15, 2000 in Partial Fulfillment of the Requirements for the Degree of Master of Science
in Engineering & Management
ABSTRACT
This research explores what requirements are necessary for the development of a turbofan engine and how they evolve through the product development cycle. This work utilizes a
parameter-based design structure matrix (DSM) to define the interfaces and interdependencies present in a large commercial aircraft propulsion system. The DSM was developed from the system level to the module level allowing one to examine the assumptions made throughout the entire life cycle of the product.
The work utilizes the system-level DSM to show the similarities between the turbofan engine product development process (PDP) and the software spiral product development process. This work examines the parameter-based DSM in each of the design phases and attempts to understand the assumptions made in each phase and how the assumptions change as the product proceeds through the development cycle. By examination of the DSM, it was found that
program goals and requirements lead to an initial set of design parameters. These design parameters are then iterated until a satisfactory product defmition is developed. Each stage
concludes with the integration and testing of that stages work. In all stages risk management occurs and with the necessary revision of the program plan for subsequent stages (not in the system-level DSM). The work shows that the PDP for a turbofan engine can be viewed as a spiral process. The thesis then suggests that, in general, the current industry practices for the development of complex physical systems have similarity to the spiral framework for
development of software.
Thesis Advisor: Steven D. Eppinger
ACKNOWLEDGEMENTS
I would like to thank my advisor Steve Eppinger for his guidance and suggestions in this work. I would like to thank Glenn Bartkowski for sharing his in-depth knowledge of the gas turbine engines both during the development of the DSM utilized throughout this work and during our classes as we discussed the implications and situations within the Pratt & Whitney. I would also like to thank Ronnie Thebeau for keeping us balanced within UTC. The discussions and conversations between Glenn, Ronnie and I significantly enhanced the learning in our classes.
I would like to thank those whom sponsored me within P&W. Bill Yee was instrumental for nominating me for the opportunity to participate in the SDM program. His guidance and insight while I was in the Materials Lab opened many doors for me. I would also like to thank Tom Johnson and Jim Adams for supporting me during the program. Tom allowed me to work in his Design Integration group while participating in the program. This allowed me to both learn and attempt to apply the knowledge I was learning concurrently. This taught me about the many opportunities and difficulties in attempting to apply the new knowledge within a
corporation. Thanks to Jim for being so flexible with my work arrangements.
Finally, I would like to thank my wife and my sons Collin and Galen. Thanks for being patient and for allowing me the opportunity to participate in this program. Without your
unfaltering (and often unacknowledged) support I would not have made it to this point. May we move into the future on the path together without so many "opportunities."
Table of Contents
A bstract... 3
A cknowledgem ents... 5
Chapter 1: Introduction... 11
Chapter 2: Background ... 16
Product D evelopm ent (faster/better/cheaper)... 16
Product D evelopm ent at Pratt & W hitney... 17
System Engineering at P& W ... 19
Requirem ents Docum entation w ithin P& W ... 21
Design Structure M atrix ... 25
D SM Research... 27
D SM w ithin P& W ... 29
Chapter 3: System Level Param eter DSM ... 32
Developm ent of the D SM ... 32
Direct and Indirect Parameter Interactions within the DSM ... 35
Validation of the D SM ... 37
Baseline D SM ... 40
Partitioning and Tearing the Param eter DSM ... 40
Chapter 4: Variation of Assumptions by Stage of Product Development... 63
Assum ptions for Conceptual Design... 64
Assum ptions for Prelim inary Design... 76
Assum ptions for Detailed Design ... 78
Assum ptions for V alidation... 84
Sum m ary ... 91
Chapter 5: D iscussion... 95
Im plications for Pratt & W hitney... 95
Requirem ents Docum entation... 95
Organizational Im pacts ... 97
Sim ulation vs. D SM ... 100
Applications for D SM within P& W ... 101
G eneral Im plications of W ork... 102
Lessons from Pratt & W hitney... 102
System M odeling and Sim ulation... 105
Assumptions, the Parameter DSM, and the Product Development Cycle ... 106
Spiral vs. W aterfall Fram eworks for Product Developm ent ... 110
Spiral Developm ent and Derivative Products. ... 119
Chapter 6: Conclusions and Future W ork ... 120
Conclusions... 120
Future W ork ... 121
List of Figures
Figure 1: Generic product development process [after Ulrich and Eppinger, 2000]... 12
Figure 2: Schematic waterfall development process [Boehm, 1988]. ... 13
Figure 3: Schematic spiral development process with 4 cycles [Boehm, 1988; Rechtin and Maier, 19 9 7 ]. ... 14
Figure 4: Schematic large commercial gas turbine. Subsystems are identified within the d raw in g . ... 17
Figure 5: Product development organizational structure at P&W... 20
Figure 6: P&W integrated product development process [Anonymous, 2000]... 22
Figure 7: Example Program DSM of Kodak Cheetah Project [Ulrich and Eppinger, 1995]... 25
Figure 8: Sets of the P&W organization utilized in various work... 34
Figure 9: Baseline DSM developed in cooperation with Bartkowski [Bartkowski, 2001]. ... 41
Figure 10: DSM organized by the organizational structure... 43
Figure 11: Partitioned DSM with large block of interdependent parameters. ... 49
Figure 12: The DSM with the Design parameters torn by column... 53
Figure 13: The DSM with the Design parameters torn by row... 55
Figure 14: Base DSM for stages that have the Designs determined late... 59
Figure 15: Base DSM for stages that have the Designs determined early... 61
Figure 16: DSM with thrust and design parameters assumed... 65
Figure 17: Partitioned DSM with assumptions for new temperature capabilities. ... 69
Figure 18: DSM with one set of assumption during the aerothermal design... 71
Figure 19: DSM with a second set of assumptions during the aerothermal design... 73
Figure 20: Schem atic DSM for Conceptual Design. ... 75
Figure 21: DSM with assumptions for Preliminary Design... 79
Figure 22: Schem atic DSM for Preliminary Design... 81
Figure 23: Levels of decomposition examined during product development stages... 81
Figure 24: Hierarchical set of DSMs with ever increasing detail... 82
Figure 25: DSM of detailed design for gas turbine engine [Mascoli, 1999]. ... 85
Figure 26: Schem atic D SM for detail design... 87
Figure 27: System Level DSM with assumptions for validation... 89
Figure 28: Schem atic DSM for the validation phase... 93
Figure 29: Schematic DSM for the entire product development cycle... 93
Figure 30: Comparison of sequences of Conceptual Design, Preliminary Design, and Validation. ... . . . . ... ... ... 94
Figure 31: Spiral representation of the conceptual design stage... 112
Figure 32: Schematic conceptual design DSM with labels for spiral development. ... 112
Figure 33: Spiral representation of the preliminary design stage. ... 113
Figure 34: Schematic preliminary design DSM with labels for spiral development... 114
Figure 35: Spiral representation of the detail design stage... 115
Figure 36: Schematic detail design DSM with labels for spiral development... 115
Figure 37: Spiral representation of the validation stage. ... 117
Figure 38: Schematic validation DSM with labels for spiral development... 117
List of Tables
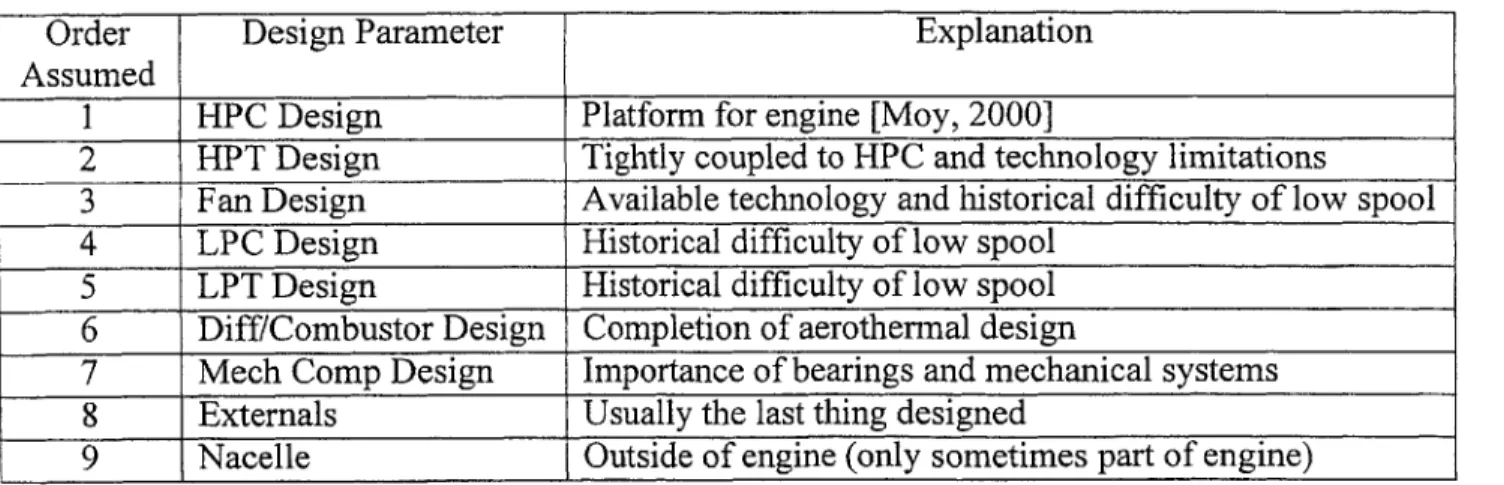
Table 1: Parameters and their unique identifiers used throughout this thesis... 38 Table 2: Sequence and reasons for assuming module design parameters. ... 52
CHAPTER 1: INTRODUCTION
Product development of complex products has been studied for many years. The field of system engineering has been developed to assist in many of the technical aspects of developing a product. While many of the tools of system engineering focus on the marketing (customer)
needs and how to relate them to the functions and high level requirements of a product, this thesis uses one system engineering tool to focus on the timing of assumptions made during the product development process. Finally, this work suggests that the current product development process (PDP) for turbofan engines most closely resembles the spiral product development
framework that has been outlined in the software industry.
The present work was originally undertaken to further understand what requirements are necessary and how they evolve through the product development cycle, conceptual design through validation. Production, field support, and disposal are not included in this work. This work utilizes a parameter-based design structure matrix (DSM) to define the interfaces and interdependencies present in a large commercial aircraft propulsion system. The DSM was developed from the top down instead of the bottom up (i.e., from a system level rather than the subsystem level). This unique perspective allows one to examine the assumptions made throughout the entire life cycle of the product. It concludes that the assumptions made in one stage of product development, once validated, often become the requirements for subsequent stages. The system perspective allows one to take (as we say in the industry) "the 40,000 feet" view of the propulsion system. The DSM work in this thesis expands upon previous work of
Craig Rowles and Greg Mascoli [Rowles, 1999; Mascoli, 1999]. The development of the parameters and their interactions for the DSM in this work was done in cooperation with Glenn
Bartkowski [Bartkowski, 2001].
Within the aircraft propulsion industry, as well as many industries, product development can be viewed as proceeding along a generic program plan [Ulrich and Eppinger, 2000]. Figure 1 shows the generic product development cycles as it exists within many industries. While this process looks linear, many planned and unplanned iteration cycles occur within the process. Desire to reduce product development time and cost have put tremendous pressure upon the product development teams not only to eliminate unplanned iteration, but also to minimize planned iteration (if not eliminate it entirely).
Stage 0 Stage I Stage 2 Stage 3 Stage 4 Stage 5
Concept System-Level Detail Testing and Production and
Planning Development Design Design Validation Field Support
Figure 1: Generic product development process [after Ulrich and Eppinger, 2000].
This pressure has led to many techniques and methods that shorten the generic program plan. Among these are concurrent engineering, integrated product teams, integrated computer master models, and reordering tasks for more optimal information flow. Each of these allows for the shortening and overlap of the generic program plan given in Figure 1. When attempting to put the generic PDP into a framework, the process is generally described as a waterfall
product development process (Figure 2) [Boehm, 1988]. However, this work examines the PDP for a turbofan engine and it concludes that a second framework for product development more closely resembles the turbofan PDP. This second framework has been termed a spiral
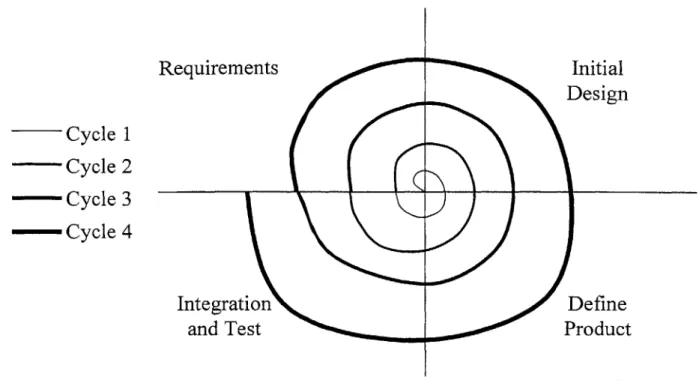
development process due to its conceptual graphic (Figure 3) [Boehm, 1988; Rechtin and Maier, 1997]. In a spiral development process, the product is developed in every increasing complexity by progressing through a set of tasks very quickly and doing so several times. For each spiral around the process, the product becomes more complex and has more functionality. By
validating the product in small increments, issues and errors within the product design are caught early and only small amounts of rework (iteration) are necessary to correct the issues. The reduced rework leads to significantly shorter development time and lower cost (as well as mitigating risk). System feasibility talidation ,.. Plans and Requiremen Validation Produc~tDesign OVerification Detailed Design Verification Code Unit Test Integration Product Verification Implementation System Test Operations and Maintenance ReLlidation
Requirements Cycle 1 Cycle 2 -- Cycle 3 - Cycle 4
Irr
Integration
and Test
Initial
Design
Define
Product
Figure 3: Schematic spiral development process with 4 cycles [Boehm, 1988; Rechtin and Maier, 19971.
Two primary differences exists between a waterfall PDP and a spiral PDP. First, the product requirements in a waterfall development process are set very early in the process and
should not change throughout the process. In a spiral process, the requirements are more flexible. Exactly how flexible is not clear in the literature. Second, the spiral process
emphasizes risk analysis and mitigation. There is no such emphasis in the waterfall process.
The current work utilizes the system-level DSM to show the similarities between the turbofan engine product development cycle and the spiral product development process. This work examines the single DSM in each of the design phases and attempts to understand the assumptions made in each phase and how the assumptions change as the product proceeds through the development cycle. A process called tearing is used to examine the assumptions in the DSM. Tearing a DSM is the process of making an assumption and then reordering the
parameters based upon the assumption. By ordering the tears according to how information is developed in a particular stage of the product development process, each stage may be examined as to how and what is occurring during the phase.
By examination of the information flow between parameters in the DSM and the iteration that occurs in a stage, it was found that the information flows from the determination of program goals and requirements to an initial estimation of the design to an iterative cycle of product definition. Each stage concludes with the integration and testing of that stage's work. In all stages, risk management occurs and the necessary revision of the program plan is developed for subsequent stages. The work shows that the PDP for a turbofan engine can be viewed as a spiral process. The thesis then suggests that that, in general, the current industry practice for the
development of a complex physical system is equivalent to the spiral framework for development of software. This work also develops specific recommendations for Pratt & Whitney as well as implications for general product development processes.
CHAPTER 2: BACKGROUND
Product Development (faster/better/cheaper)
As a market becomes more competitive and as the "clock speed" of an industry increases, the product development process is put under pressure to develop improved products in less time for less investment. This push towards faster/better/cheaper has led to the adoption of concepts
such as concurrent engineering and product development process optimization. The design structure matrix technique is one of many tools that may be employed to improve the PDP through optimal ordering of the tasks and improved information flow. Given the large push to
make drastic improvements, many changes are made without full recognition of their impacts and interactions with other portions of the product development cycle. Such blind reduction of the process without understanding of the interfaces and the interdependencies can ultimately lead to failure. One example of this was the Mars Polar Lander developed by Lockheed Martin for NASA. This failure was directly attributed to the push for development time and cost reductions [Dornheim, 2000]. Failures such as the Mars Polar Lander probably occur much more frequently than documented in public literature simply because companies are extremely reluctant to put any failure into the public arena. Under such an environment, product development management must continually push to improve their process, but must do so by developing a deep
understanding of the interdependencies of the process and the risks they accept when pushing to achieve their goals.
Product Development at Pratt & Whitney
Pratt & Whitney (P&W) develops, manufactures and supports a wide range of gas turbines. The current work will focus on a gas turbine for large commercial aircraft. A schematic of a propulsion system for a large commercial aircraft is given in Figure 4.
Traditionally, the overall system has been decomposed into nine major subsystems (fan, low pressure compressor, high pressure compressor, diffuser/combustor, high pressure turbine, low pressure turbine, mechanical components, externals/controls, and nacelle). The combination of the gas turbine (the first eight subsystems) with the nacelle is termed a propulsion system.
Externals
HpC Diff/ HPT Core/Primary
Mech Comp. -i Comb Airflow
Bypass Airflow
Nacelle
Figure 4: Schematic large commercial gas turbine. Subsystems are identified within the drawing.
A gas turbine provides propulsion to an aircraft by significantly increasing the
momentum of air that goes through the engine. The propulsion systems accomplishes this by first compressing the ambient atmosphere, fuel is then added to the air and burned in a continuous manner to greatly accelerate the air. The gasses then pass through a turbine that turns the compressor stages. The hot gas then exits the core of the engine and provides thrust to the aircraft. This gas is termed the core or primary airflow. For large commercial aircraft, the thrust
from the hot air exiting the core of the engine is only a minor portion of the overall thrust. The majority of the propulsion is provided by having the fan accelerate a large amount of air by a
small amount. This is termed the by-pass air. (To increase the momentum of air, mass*velocity, one may significantly increase the velocity of a small mass of air or slightly increase the velocity of a large mass of air. For reasons beyond this thesis, large commercial engines choose to do the
latter [Smith and Mindell, 2000]).
From the early development of gas turbines through the early 1980s, a product
development cycle within the commnercial gas turbine industry typically lasted about 5-6 years [Epstein, 2000]. This length of time was from "launch" of the product (start of detailed design), to certification of the engine by the United States Federal Aviation Administration (FAA) or the European Joint Airworthiness Authority (JAA). Due to the drive for better products in a more timely manner, P&W implemented process improvement initiatives to reduce the product development time to 2.5 years by the year 2000. P&W strove to accomplish this while reducing the development cost by 70%. These reductions were undertaken to increase the attractiveness of P&W engines to our customers. Integrated Product Development, integrated 3-D modeling, alignment (and eventual merging) of manufacturing and engineering organizations, and the development of a system engineering organization are among the initiatives implemented at P&W in support of these goals.
These initiatives eliminate wasted effort and significant amounts of rework within the product development cycle. The philosophy within the engineering and product development leadership was that the product development cycle should be replaced by a product validation cycle. P&W was to validate designs developed using the software tools implemented through
the process initiatives listed above. As P&W transitioned from a development company to a validation company, there was recognition that a minimal set of development tests would be necessary. However, extreme pressure from management was put on any single test to either eliminate it or minimize the amount of work necessary. Of course the design teams would push to include as much testing as possible in order to validate their software tools and designs prior to FAA/JAA certification tests (i.e., validation) were failure is unacceptable. This tension between the management and the design teams is necessary and can in fact serve to balance the process. When one of the sides develops too much power, there is no balance and the process
suffers. P&W recognized this tension and initiated the formation of a system engineering organization in 1997 to help maintain this balance. For detail discussion of the organizational transformation at P&W see the following references: Womak and Jones, 1996; Rowles, 1999; Mascoli, 1999; Glynr and Pelland, 2000.
System Engineering at P&W
System engineering at P&W was formally instated in 1997. At that time a "three-legged stool" was put in place with three system engineering organizations representing the three legs. The three organizations are Propulsion System Analysis (PSA), Product Development &
Validation (PD&V), and System Design & Component Integration (SD&CI). The organizations were developed such that each had specific responsibilities and that together, they were
responsible for the technical (engineering) side of product development and field service. The current organizational structure is shown in Figure 5. (Note that the true organizational structure cannot be drawn as neat boxes in a figure and that full understanding of the organization is only developed with experience, if ever). Prior work of Mascoli, 1999 and Rowles, 1999 has the
perspective of the IPTs in the organization while the current work's perspective is from the system engineer (two very different parts of the organization).
Chief Operating Officer
VP Engineering VP Operations VP Prograrms
Dir. Mod Ctr ---___ --- Turbine Other Module Post Cert.
Engineering Module Center Centers (3) Engines
Test-- PD&V -Engineering Business Ctr
Certification Manager Manager (4) GP7000
Other CIPT Tech
pebiyLeaders (6) Manager PW6000
PSA Performance
-Turbine CIPT - IPTs
PW40000 Software orgaizatoa PW4000 _Design Managers Other Secondary Programs Flow Functional Systems Orgs
Figure 5: Product development organizational structure at P&W.
PSA has the responsibility for engine (system) level parameters. They own the
simulations and models for the aerothermal cycle analysis of the engine as well as analysis for such integrative parameters as noise. In addition, PSA is responsible for the software that controls the engine. This system engineering organization is primarily responsible for the
performance and operation of the engine. The PSA organization owns the "primary" gas flow in the engine.
The PD&V organization is primarily responsible for the assembly, testing, and
certification of the engines. They are by far the largest of the system engineering organizations in that they include many assembly mechanics and test engineers. The PD&V organization develops and maintains the engine validation plan (EVP), formerly termed the engine development plan (EDP). This plan is developed within the overall schedule and resource constraints of the program (i.e., product development cycle). This organization is constantly attempting to balance the multi-project problem with limited physical resources (test cells).
The SD&CI organization is by far the smallest organization in terms of people, but they have the responsibility for leading and integrating the entire physical design of the engines. In
effect they have the responsibility, but not the direct supervisory link, for the entire design team and all the IPTs that design the individual components. The SD&CI organization owns the requirements and the configuration of the engines. Also within SD&CI are groups responsible for the secondary (as opposed to primary) flow within the engine, static and dynamic structural considerations at the system level (e.g., fan blade out stress loads and engine vibration). These later groups are a very functional organization while the requirements, configuration, and system integration portion of SD&CI is very program focused.
Requirements Documentation within P&W
The documentation of requirements for a propulsion system is the responsibility of the SD&CI organization. The process for this has been evolving over the last 5 years to facilitate integrated product development (IPD) process (Figure 6). The internal IPD process and system
level procedures developed for IS09000 outline the expectations for a Propulsion System and Components Requirements Document (PS/CRD). The Propulsion System Requirements Document (Chapter 1 of the PS/CRD) is developed during the preliminary design phase and is approved upon completion of the preliminary design review, termed a Level II Review. Thus, system level parameters and their associated requirements are developed early in the product development cycle. Many of these requirements are developed in Advanced Engine System Engineering organizations using a detailed aerothermal simulation and other system level models and heuristics developed over the last 50 years within P&W.
IPD Phases Concept Plan Develop and Validate In Service
Prior to Program Initial Final Follow
MOU Approval Quality Quality the Fleet
& Funding Validation Validation
Senior Management
K
>SM <3 SM SM jjSM KjSM K& SMSystems S s s < s < S S
9 Modules M < nM M M M
Parts < >P < '> <>p <& P Concept Concept Preliminary First Certification Service Options Choice Configuration Engine Entry
Timing
77 7
7
7
7
Figure 6: P&W integrated product development process [Anonymous, 2000].
Following a successful Level II Review, senior management launches product
development cycle and detailed design begins. At this point the responsibility for the system engineering is handed from the Advanced Engine organizations to the program specific PSA,
PD&V, and SD&CI organizations. This handoff is the general case for new engine designs (about one every 10 years). For derivative designs within a product family, the program specific system engineering organizations are responsible for the conceptual and preliminary design as well as the detailed design, validation and field support.
One of the first tasks after launch is the development of the Component Requirements Document (Chapter 2 of the PS/CRD). Each major subsystem (fan, LPC, HPC,
diffuser/combustor, HPT, LPT, mechanical components, externals/controls, and nacelle) develops the detailed requirements that will enable the subsystem (modules as they are called P&W) to meet the requirements laid out in the Propulsion System Requirements. A review and approval of the Component Requirements occurs at a Level III Design Review.
Following the development of the detailed module requirements, the detailed engineering design begins. (This is sequential only in an idealized world. In actuality, the detailed design and development of requirements happen concurrently). During the detailed design, the requirements for the manufacturing of the parts are developed and when rolled together at the module level become sections of Chapter 3 in the PS/CRD. Review of the detailed design and the manufacturing requirements occurs at Level IV reviews in each integrated product team
(IPT). During the detailed design of a component, it is common practice to have 3-5 designs for a specific component. These various designs define the window of design space the component will occupy. During the design and validation of the components and engine, the design is narrowed to a final design that is then released as the production design. There is a constant
tension between the desire of manufacturing to have the final design to produce and the desire of the design engineers to maintain as wide a design window for as long as possible.
As the components and modules are produced and assembled into an integrated engine, the verification of each requirement should occur during the validation phase of the product development cycle. As gaps are identified between the actual engines and the requirements,
individual recovery plans are put in place. If the gaps are in system level parameters, the system engineers usually lead a team of module level integration leaders (Deputy CIPTs) to develop and implement the recovery plan.
While the procedure for developing a PS/CRD and its relationship to IPD has been in place, it is written as a suggested process and its implementation has varied widely. Of particular note is the PS/CRD for derivative products. For derivative products, the PS/CRD has been implemented as a "what has changed" or a "what is at risk" instead of as a baseline for a complete design. Often PS/CRD documents do not exist for the baseline design (the original designs were completed prior to the development of the PS/CRD methodology and no effort has been made to retroactively develop comprehensive requirements). Thus, for several platforms within P&W only highly annotated sets of requirements exist. This methodology of only
developing requirements for high risk areas is similar to the suggestions for a spiral development process [Boehm, 1988]. However, as will be discussed later in this thesis, this practice carries the risk of omission of a critical interface or requirement. For highly interdependent products, this may not be the most preferred technique.
Design Structure Matrix
The design structure matrix (DSM) is a system engineering tool that graphically
represents the information flow and interdependencies among a set of items. The items can be tasks, parameters, teams or another set of related items. The DSM is a square matrix with the
items listed both down the column and across the rows. An "X" or other mark at the intersection of the row and column indicates interdependency between items. The DSM analysis attempts to develop a preferred order to accomplish the items. The convention is that when completing items, a team starts at the top and works down. Note that in the convention used throughout this thesis, the marks below the diagonal are feedforwards and the marks above the diagonal are feedbacks. The following example DSM is taken directly from Ulrich and Eppinger, 1995.
In Figure 7, Task A is not dependent upon any other task and can be completed first. Task B is dependent upon Task A and therefore Task B must be completed following Task A (i.e., they are sequential tasks). Since Task E is not dependent upon Task D, they may be accomplished concurrently (i.e., they are parallel tasks).
Task A B C D E F G H I J K L M N
Receive and accept specification A A
Concept generation/selection B X Sequential Tasks
Design beta cartridges C X X C Parallel Tasks
Produce beta cartridges D X D -- l7
Develop testing program E X X X E
Test beta cartridges F X X X F Coupled Tasks
Design production cartridge G X X X X G X X
Design mold H X X X X H X
Design assembly tooling I X X I
Purchase assembly equipment J X X X J
Frabricate molds K X K
Debug molds L X X X L
Certify cartridge M X X M
Initial production run N X X X N
For Task H, information from items A, B, F, G, and I are necessary. In this case, Task G cannot be completed until Task H and I are completed; however, Tasks H and I cannot be
completed until Task G is completed. Thus in all likelihood, iteration will be necessary when completing G, H, I. These are termed coupled tasks. Completing a set of coupled tasks always involves making an initial set of assumptions. In this example, Task G can be accomplished by first guessing the output of H and I. Next H could be completed with the information from G and an assumption about I. The designer would then have a choice on whether to go on to Task I or to check the assumption made in G about the output of H. If the assumption was too far off the output, the designer may want to iterate on G prior to completing I. In this methodology, how to complete coupled tasks is left up to the development teams.
A second methodology to completing a set of coupled tasks is to make the assumptions a requirement. In this way, items completed later are actually forced to fit the initial assumption. While this may not be ideal (or even possible), this practice is fairly prevalent in industry, especially for items that have a very long feedback loop.
Reordering of items within a DSM has been the subject of much research. Algorithms for clustering (reordering into groups of interdependent tasks) and partitioning (reordering in an attempt to have all the dependencies below the diagonal to eliminate coupling) have been developed [Fernandez, 1998; Thebeau, 2001; Steward, 1981]. The method that allows one to make assumptions on the outputs of items and then reorder the DSM is called tearing and partitioning [Steward, 1981]. Repeated tearing and reordering will eventually result in all
unassuned dependencies lying below the diagonal. In this manner, by making the assumptions given, the DSM can be completed without iteration (if all assumptions are valid). In Figure 7, the three interdependencies above the diagonal would all have to be assumed. There is no reordering of this DSM that would reduce the feedback loops above the diagonal. The current work uses tearing extensively. An analysis of what parameters are assumed when and the resultant progression through parameters is used to develop the main conclusion in this thesis.
Assumptions can be made for two reasons. First as discussed above, assumptions can be made to break a set of coupled tasks. Second, an assumption may be made to reduce the product development time. Returning to the prior example in Figure 7, if the output of Task K could be assumed, then Tasks J, K, L and M could be accomplished in parallel (resulting in a reduction in the overall product development time). Thus, by making selective assumptions throughout an
entire set of tasks, product development time can be reduced. Of course, this assumes that the development team can develop a good set of assumptions that do not force rework at a later time. Good program managers are aware of these relationships and will make the appropriate trades of time vs. rework probability. (For significantly more detail on risk management using the DSM, see the work of Browning, 1998).
DSM Research
The interfaces and information flow within a product development cycle have been studied by research groups lead by Eppinger and Whitney over the last 10 years [Pinunler and Eppinger, 1994; Eppinger et al., 1994; Cronemyr et al., 1999; McCord and Eppinger, 1993;
Smith and Eppinger, 1997; Whitney et al., 1999]. Their work expanded the work of Steward on the DSM [Steward, 1981]. By defining the information flow between teams, parameters, or tasks, the DSM graphically represents the product development cycle. Partitioning and
clustering of tasks within the DSM has lead to many suggestions for improvements concerning program planning (concurrent engineering and minimization of iterations and risk), product architecture, and organizational structure. The DSM has been utilized in many research groups to study a wide variety of products and is now being developed for use within various industries (see Second MIT DSM Workshop Program, Sept. 2000 [MIT DSM, 2000]).
The DSM is a graphical method for showing iteration and information flow between a series of items. Four main types of DSMs have evolved [MIT DSM, 2000]:
Team-based: where the items of concern are teams and information flows is passed between teams and through the organization.
Component-based: where the items are physical components of product architecture and the relationships are material, energy, spatial, structural, and/or information.
Activity-based: where the items are tasks to be completed within an overall program plan and the interactions are precedence relationships.
Parameter-based: where the items are variables or design points within a product and the interactions are often mathematical relationships between the parameters.
Each of these types of DSMs has specific benefits and may even be combined to show alignment between the various structures present within a companies product development process
[Rowles, 1999; Sosa et al., 2000].
The technique of using a DSM has been extensively studied in industry-university relationships. Although much of the initial work utilized automotive examples, various
industries have now been involved in the academic research on DSMs. The latest conference on DSM provides some perspective on the applicability of this technique. Industries involved
included automotive, aerospace, construction, and telecommunications. The primary link in all these industries is that they have a complex product (i.e., a product with many interfaces and interdependencies of the subsystems). Many large DSM systems are now being developed. For example, Boeing has a large, interlinked DSM that contains around 1000 parameters [Whitney et
al.; Stowe, 2000]. While the process group has expended a large effort to develop this DSM, it
has yet to gain general acceptance within the company and their program managers [Stowe, 2000]. Another interesting application comes from the construction industry for program planning [Huovila et al., 2000]. Here a company has developed a generic DSM (program plan) for the construction of a building. For each individual project, they spend a small amount of time altering the generic DSM for the specific building on that project. In this manner they have been able to streamline the planning and construction of a building.
DSM within P&W
Pratt & Whitney students in the System Design and Management program at MIT have completed three Masters theses that utilized DSM. Craig Rowles examined component-based and team-based DSMs to determine the degree of alignment between the physical architecture and the organization. Greg Mascoli developed module (subsystem) parameter-based DSMs and combined them into a system level DSM to provide a view of the architecture of a gas turbine. Steve Glynn and Tom Pelland jointly examined the work of Mascoli and Rowles to determine how information flows through Pratt & Whitney. The DSM developed later in this thesis
attempts to examine Pratt & Whitney's architecture from the perspective of the entire propulsion system. This present work differs in that it takes a top down methodology instead of a bottoms up methodology that was used in the prior Pratt & Whitney students work.
Rowles developed an IPT (organizational) DSM as well as a physical component (architectural) DSM [Rowles, 1999]. The overlay of these matrices lead to several conclusions and recommendations on the organizational structure and integration aspects of the product
development cycle. Detailed analysis and refinement of the hypotheses were completed to further understand the data and the second order interactions [Sosa et al., 2000]. Through Rowles' work, it was found that indirect interactions between components and teams are an important part of the propulsion system development and the system integration efforts were required to facilitate the interactions between large subsystems.
Mascoli approached the same development process from the parameter point of view [Mascoli, 1999]. He developed a large parameter-based DSM that showed that the system architecture and the organization were aligned. The level of refinement in Mascoli's work was below the system level, but above the large subsystem level. Thus, he showed that the gas turbine engine can be decomposed into major subsections, but that there were many "system" level parameters that did not fit well with any subsystem. In fact, many research projects have found "system" level parameters/teams/components that are usually put at the top or bottom of a DSM. Following the segregation of the system parameters, the remainder of the DSM is
partitioned independently. Similar to Rowles, Mascoli recommended that the system integration efforts be strengthened between the subsystem organizations.
Pelland and Glynn showed how the recent organizational restructuring has traded system integration effectiveness for design-for-manufacturing effectiveness. While the communication and information transfer between modules has been made significantly less likely, the
manufacturing and design engineers are communicating well. This trade presupposes that the system integration can still be effectively managed by the system engineers. They recommended that a "smart" DSM be developed by the subsystems technical discipline chiefs and managed by
one of the system engineering organizations. In this manner, the flow of information between IPTs and across modules could be managed with minimal wasted effort.
CHAPTER 3: SYSTEM LEVEL PARAMETER DSM
Development of the DSM
As one of the goals of this work was to approach the product development and interface management from a different perspective than prior work, the DSM developed in this work took a "system" level perspective. In this statement it is meant that the parameters used in the
development of the DSM are those most often used and thought of within the system engineering organizations. Although the system engineers often delve into subsystem parameters, the
objective was to view the subsystems (modules) defined in prior work as black boxes and to focus on the integrative, highly dependent, variables that define a gas turbine engine and its cycle. While prior work encompassed the system, the perspective was from a component or module level. This work utilized PW4000 engines as the basis for the DSM. The development of the DSM was accomplished cooperatively with Glenn Bartkowski [Bartkowski, 2001].
To obtain the system level perspective, interviews were conducted primarily with the system engineers within three system engineering organizations in P&W. The lowest level person interviewed for the production of the DSM was a Deputy Component Integrated Product Team Leader (Deputy CIPT), who is responsible for an entire module and many integrated
product teams (IPTs). This contrasts with prior work where the primary focus was at the IPT level [Rowles, 1999; Mascoli, 1999]. This is shown schematically in Figure 8 of the P&W organizational structure. Note that there is some overlap in the people used, but the people used in this work are primarily referred to as design experts and system engineers in the prior work.
Rowles used "design experts" to develop his architectural DSM. The specific employees that Rowles used were what are now referred to as discipline chiefs within the Module Centers. Rowles then utilized several systems engineers to validate the work of the discipline chiefs. While this may appear to be similar to the present approach, Rowles work was developed from the Module Center perspective and then checked by the system engineers. While subtle, it is different than the present work. Upon detailed comparison of Rowles work with the present work, the identical situation is present when Mascoli's work is compared to the present work. In both cases, ~10 of their "system" parameters have been expanded into -100 parameters while the majority (60-100) of their parameters have been collapsed to 10 parameters. The work of Glynn
and Pelland on the communication flow included the majority of the product development organization [Glynn and Pelland, 2000].
The parameters to be used in the DSM where obtained from written sources and from the system engineers experience. The types of documents that were used were all proprietary
documents within P&W and are as follows: Design tables, internal training manuals, product reviews, FAA certification reports, Model Integrated Product Team reviews, airframe
manufacturers requirements documents, and Chief Engineer's meeting presentations. Current PS/CRDs were specifically not used to define the list of parameters such that a later comparison could be made to determine what overlap and omissions were present between the documents.
The list of variables was developed and reviewed by system engineers within System Design & Component Integration and Propulsion System Analysis (two of the three system engineering organizations within P&W). The entire list was then grouped and narrowed to focus
the list on what was considered the variables that would define the gas turbine engine to a knowledgeable outside expert. A list of 110 variables was developed.
Chief Operating Officer
VP Engineering VP Operations VP Programs
rModule Center Centers (3) Engines
- Test
-PD&V - ngineering Business Ctr
-- Certification Manager Manager (4) GP7000
Operability Other CIPT Tech
Leaders (6) - Manager Secondary focus PW6000
of current work
PSA -- Performance
-Prime focus Discipline
of current Software Ch-es --- -- PW4000
work
(secondary
---focus of Design CIP Ldr.
prior work) Managers PW4000 IPTs Other
Secondary Programs
SD&CI Flow
-Prime focus of prior
Functional work [Mascoli,
Systems Orgs 1999; Rowles 1999]
Figure 8: Sets of the P&W organization utilized in various work.
The method that was used to develop the interactions was to have the system engineers and other design experts in a room 2 or 3 at a time and to project the DSM onto a large screen from the computer. The design relationships were then discussed utilizing the particular
expertise and knowledge of the system engineers in the room. Discussion between the engineers proved to be one of the most useful aspects of accomplishing the development of the interactions
in this manner. The development of the list of parameters and their interactions was
accomplished in a series of one-hour meetings. These meetings occurred 2-4 times per week over a three-month period. This practice is different from most DSM work where one-on-one interviews and surveys are sent to experts. By using a participatory methodology, a consistent set of definitions and model of the gas turbine engine emerged. Specific relationships that applied to one PW4000 model but not the others were not included in the matrix. In this way, the matrix may be thought of as a platform model. For any specific design, the DSM would need to be tailored to the specific architecture.
As has been discussed in prior work [Rowles, 1999], one trend of system engineers and design experts is to assume all parameters are related to all other parameters. This tendency to believe in full interaction was found to be common during the development of the current DSM. This belief was overcome by developing definitions and relationships within the parameters for direct interaction versus indirect interaction. In general, it was found that all interactions the system engineers believed were present could be found by tracing through direct relationships to get to the variables thought to be related. Thus, there are many indirect relationships that are considered important by the experts.
Direct and Indirect Parameter Interactions within the DSM
The distinction between direct and indirect interactions within the DSM was developed early in the work and was refined continuously as the situation merited. The working definition developed was that the parameters needed a mathematical relationship (or the possibility of such
relationship was not sufficient to deem an interaction a direct relationship. It was quickly realized that with a series of mathematical equations, the equations could be combined and reworked such that again all parameters can be related to most other parameters. Thus, a second constraint was added that the relationship should be as simple as possible. While this constraint is subject to interpretation, system engineers are used to ambiguity and this constraint was very powerful in practical use. Third, if an indirect relationship could be thought of that explained the perceived direct relationship of variables within the DSM then no direct relationship was entered into the matrix.
When applying these constraints on direct interactions, it was found that the
aerodynamics of the engine could be used to separate the variables into groups and determine generic relationships. For example is was found that using core airflow as a general group and treating all the airflow parameters identically helped simplify the thought process and maintain consistency within the matrix. As an example, for core airflow the general mathematical relationship between the variables is conservation of mass. Thus, Fan Flow Capacity (airflow) has a direct link to LPC Flow Capacity has a direct link to HPC Flow Capacity. Stability Bleed flow has a direct link to HPC Flow Capacity, but it only indirectly links to the LPC Flow
Capacity. To continue this example, HPC Flow Capacity and the HPC PR (pressure ratio) directly define a line called HPC Op Line. Similarly, the LPC Flow Capacity and the LPC PR define the LPC Op Line. As surge margin in a gas turbine engine is an important safety measure, it is defined as the Op Line subtracted from the stall line. The stall line is a parameter
defined by the physical module design. Thus, Surge Margins are defined as directly related to the Op Line and the Design.
The system engineer may know that the Stability Bleed is used to change the HPC Bodie Surge Margin. In the DSM, this is accounted for in the following manner: the Stability Bleed is directly related to the HPC Flow that is directly related to the HPC Op Line that is directly related to the HPC Bodie Surge Margin. This one example is typical of the interactions and tracing of the "known" relationships through the DSM. The tracing of indirect relationships through the DSM was one method used to validate DSM.
Validation of the DSM
Validation of the DSM was accomplished in several ways. First, the use of many system engineers and their discussion of the interactions amongst themselves proved to be valuable in both developing the relationships as well as their mental model of the system. Second, the tracing of direct relationships to verify a known indirect relationship was used extensively while the matrix was being developed as well as after completion of the matrix (see Bartkowski, 2001 for several additional examples). Tracing of past areas of difficulty (many times called mistakes) through the DSM proved to be both valuable for validation as well as interesting and insightful to the system engineers. Third, the DSM was validated using lecture notes and textbooks from a
course in gas turbines offered at MIT [Kerrebrock, 1992]. This material was used to validate both the direct interactions as well as the groupings of parameters and mathematical relationships between the variables. Finally, during subsequent analysis by both developers of the DSM (the author and Bartkowski), the interactions were validated. In the author's case, this was primarily accomplished by understanding the results of partitioning and tearing of the DSM. The
Table 1: Parameters and their unique identifiers used throughout this thesis.
1 Low Rotor Speed
2 High Rotor Speed
3 TSFC
4 LPC Stability (Op Line)
5 HPC Stability (Op Line) 6 Acceleration Time 7 Deceleration Time 8 Fan Op Line 9 Fan Design 10 LPC Design 11 HPC Design
12 Corrected Main Oil Pressure
13 Main Oil Temperature
14 Take Off Thrust
15 Reverse Thrust 16 Emissions 17 Noise
18 LPC Takeoff Surge Margin 19 HPCT/O Surge Margin
20 HPC Bodie Surge Margin (Sea Level) 21 HPC Bodie Surge Margin (Altitude) 22 HPC Accel Surge Margin
23 LPC Surge Margin (Max Climb)
24 LPC Surge Margin (Cruise)
25 LCF Mission (Flight Cycle) 26 Flight Envelopes (Alt, MN, Temp) 27 Typical Operating Mission 28 Burst Margin
29 Rotating Part Life 30 Vibration Low Rotor 31 Vibration High Rotor 32 Engine Weight 33 Bird Loads
34 Fan Blade Out Loads
35 Nacelle Thermals
36 External Component Thermals 37 Nacelle Drag 38 ECS Bleed 39 TCA 40 TCC Bleed 41 Starting Bleed 42 Stability Bleed 43 Thrust Balance 44 Nacelle Cooling 45 Air Oil Coolers 46 Buffer Cooler 47 HPT/LPT Leakages 48 HPT/LPT Clearances 49 Anti-Ice Bleed
50 Diff/Combustor Design 51 Life Cycle Cost 52 Manufacturing Cost 53 Airline Operating Cost
55 Unscheduled Engine Removals 56 Shop Visit Rate
57 Engine Change Time 58 TMC
59 Delays and Cancellations 60 Fan Flow Capacity 61 LPC Flow Capacity 62 HPC Flow Capacity
63 Burner Flow Capacity
64 HPT Flow Parameter
65 LPT Flow Parameter 66 Fan Exit Area
67 Jet Exit Area 68 Fuel Flow
69 Total Inlet Temperature/Profile 70 HPC Inlet Temperature/Profile 71 Burner Inlet Temperature/Profile
72 HPT Inlet Temperature/Profile 73 LPT Inlet Temperature/Profile
74 Exhaust Gas Temperature/Profile
75 Fan PR 76 LPC PR 77 HPC PR 78 Burner dP 79 HPT Expansion Ratio 80 LPT Expansion Ratio 81 Fan Efficiency 82 LPC Efficiency 83 HPC Efficiency 84 Burner Efficiency 85 HPT Efficiency 86 LPT Efficiency 87 LPT Design
88 Fan Nozzle Performance 89 Primary Nozzle Performance 90 Duct Losses
91 HPC Clearances 92 Low Rotor Inertia 93 High Rotor Inertia
94 Control Stability
95 Time to Light 96 Time to Idle
97 Burner Blowout Margin 98 Stator Vane Schedule 99 Ambient Temperature 100 Warranty Cost 101 2.5 Bleed
102 Engine Pressure Ratio
103 Control Laws
104 Fan/LPC Tip Clearance
105 Fuel /Air Ratio 106 HPT Design 107 Nacelle Design
108 External/Control Design 109 Mechanical Components Design
Baseline DSM
The baseline DSM developed for this work is shown in Figure 9. No immediate structure was obvious. By grouping of the parameters by areas of responsibility (i.e., imposing the current organizational structure), some structure begins to emerge in the DSM (Figure 10). However, there is no neat clustering of the interactions as found in previous work of Mascoli and Rowles. Bartkowski explores organizational and manual methods of organizing the DSM in more detail. This work focuses on mathematical partitioning and tearing of the DSM.
Partitioning and Tearing the Parameter DSM
Partitioning of a matrix involves reordering of the elements such that as many of the interactions as possible are all in the lower portion of the matrix (termed lower triangular). By ordering the elements in this way, information and interactions flow from one parameter to the next without any feedback. When a lower triangular matrix is not possible, partitioning may break the matrix into several sections with coupled blocks. Partitioning is not clustering in that no weighting is used to bring the upper triangular dependencies close to the diagonal.
Partitioning makes no attempt to order items within a coupled block.
In a lower triangular matrix, a designer may determine the values of the parameters in the order of their listing and while doing so have complete information to determine the parameters. As a designer proceeds through the listing of parameters and a parameter has a feedback from a
later parameter, the designer must make an assumption concerning the value of the parameter that has yet to be determined. By making this assumption, the designer is then able to determine
Items
Itao Rotor Sped 2 H CghRotor Speed
3 7060 4 LP0 Stabilty (Op ULi) 5 1-IF Stailty (OF Uim)
6 Aceleratin Tme 7 Decaleration Time 8 Fan Op Lim 9 F.. Dsign 10 LPC Design 11 HPC Design 12 Corected Main 0 Pressure
13 Main Oil Temperature 14 Take Off Thrust 15 Reverse Thrust 16 Emissions 17 Noise
18 LPC Takeoff Surge Margin 19 HPCT/O Surge Margin
20 HPC Bode Surge Margin (Sea Level)
21 HPC Bodie Surge Margin (Aftitude) 22 HPC Accel Surge Margin 23 LPC Surge Margin (Max Climb)
24 LPC Surge Margin (Cruise)
25 LCF Mission (Fight Cycle)
26 Flight Envelopes (Alt, MN, Temp)
27 Typical Oprating Mission 28 Burst Margin 29 Rotating Part Life
30 Vibration Low Rotor
31 Vibration High Rotor 32 Engine Weight 33 Bird Loads 34 Fan Blade Out Loads
35 Nacelle Thermals 36 Extenal Component Themals
37 Nacelle Drag 30 ECS Bleed 39 TCA 40 TCC Bl ee 41 Stating Beed 42 Stability Bleed 43 Thrust Balance 44 Nacelle Coolng 45 Air Oil Coolers
40 Baffer Coler 47 HPT/LPT Leakages 48 HPT/LPT Clearances 49 Ant-a Bleed
50 Diff/Combustor Design
51 Ufe Cycle Cost 52 Manufacturing Cost 53 Airline Operating Cost
54 Ia Right Shut Downs
55 Unscheduled Engine Removals
56 Shop VisitRate
57 Engine Change Time
59 Dlaya nd Caelations
60 FFw ap gacity
61 LPC Flow Capacity
62 HPC Flow Capacity
63 Burner Flow Capacity
64 HPT Flow Paameter 65 (PT Flaw Pwaraatw~
66 F..Fxit Aaa
67 Jet Exit Area
68 Fuel Flow
69 Total Inlet Temperature/Profile
70 HPC Inlet Temperature/Profile
71 Barner InldtTrnpeiatara/PaofIa 72 SPIlet Tetapeaata1e/Poatle
73 LPT Ilet Temperatare/Profle
74 Exhaust Gas Temperature/Profile 75 FanPR 76 LPC PR 77 SPC PR 78 BaT ERdp 79 LPT Expansion Ratio 80 (PT EpFnsian Rato e1.Fan Efftaency 82 LPG Efficienxy 83 HPC Effiency
84 Burner Eff ency 85 HPT Efficiency
86 LPT Efficiency
87 (PT Desgn
80 F.. NazzltPeforancex
89 Pa mary Nozzle Perfomance
91 HPO0Cleanxes
92 Low Rotor Inertia
93 High Rotor Inertia
94 Control Stability
95 Time to Light
96 Tme ta Idle 97 Barner Blawaut Main,
98 Stator Vane Schedule
99 Amient Temperature
00OWaaty Cos
01 25 Bleed
02 Egiae Pssure Ratio 03 Control La.s 04 Fan/LPC Tip Cleance
05 Fel /Air Ratio
06 H-PTDsiga
07 Nacelle Design
0s E x teDa s/G gtna l D e s ig s
09 Mahanhtai CGampanents Deiga
0 Fad-Od Coolers 67 2831611 1213 14 21522 23 24 5 26 27 28 29 30 31 32 33 34 35 36 37 38 3 40 41 42 43 4445 46 4 8 9 W51 52 54 5 66 57 6 6 9 7 7 7 _5 7 7 0 8 3 6 791M 9 8 w3 4 5W 0 8 91 - 0 0 0 o 0 00C - --- --- -S0 0 0 0 0 0 0 4 44 _ 0 1 0 1 1 1 - - - - - - - - --- 0 - - - --- -00-- - -2-0 - - -- --- - --_ 0_ - 0-. 0 0 . 0 - - 0 - :--P 0 0 - ----- --0 S0 0 o 0 0 0 0 0a 0 0 - -- o 0 0 0 0 0 o o _ 0 ___ o a 0 _ 0 - 00-o 0 - -0 S 0 0 0 0 0 0 0 0 _ S00000 0 0 0 a- 0 -______o o 0 00 0 1 0 a 0 a 0 - - - - - 0 0 0 - 0 0 1 O w 0 00 0 0 a 0I u11 0L 0 0 0 0 S0 0 0 0 S0 -D0 0 0 _ _ 0 - --- - ---- -0
![Figure 1: Generic product development process [after Ulrich and Eppinger, 2000].](https://thumb-eu.123doks.com/thumbv2/123doknet/14676683.558140/12.918.113.823.593.661/figure-generic-product-development-process-ulrich-eppinger.webp)
![Figure 2: Schematic waterfall development process [Boehm, 1988].](https://thumb-eu.123doks.com/thumbv2/123doknet/14676683.558140/13.918.99.813.398.1002/figure-schematic-waterfall-development-process-boehm.webp)


![Figure 6: P&W integrated product development process [Anonymous, 2000].](https://thumb-eu.123doks.com/thumbv2/123doknet/14676683.558140/22.918.120.816.413.858/figure-p-amp-integrated-product-development-process-anonymous.webp)
![Figure 7: Example Program DSM of Kodak Cheetah Project [Ulrich and Eppinger, 1995].](https://thumb-eu.123doks.com/thumbv2/123doknet/14676683.558140/25.918.108.656.710.998/figure-example-program-kodak-cheetah-project-ulrich-eppinger.webp)